
Key Insights
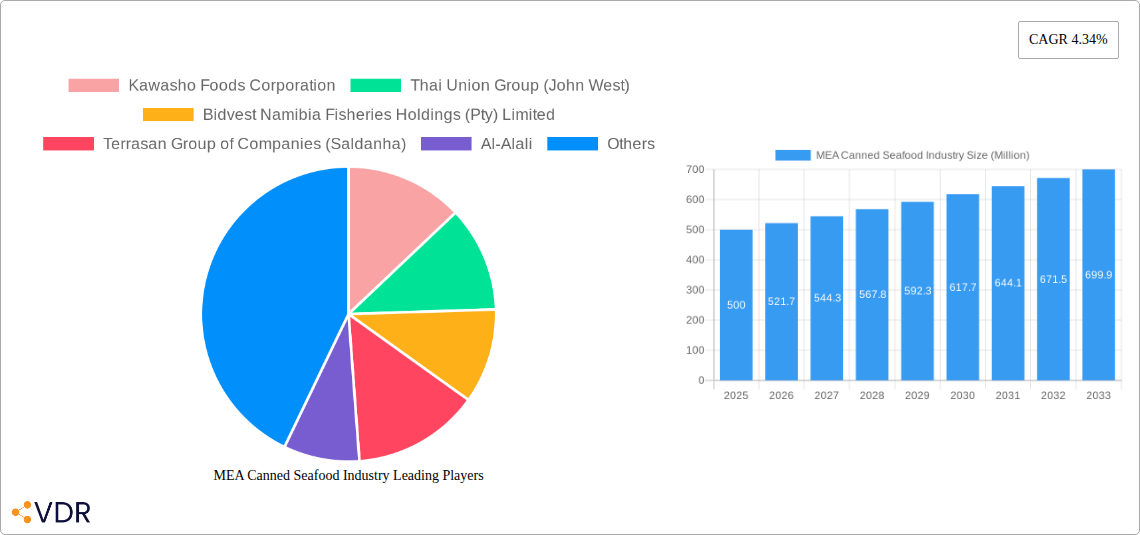
The MEA canned seafood market, encompassing countries like the UAE, Saudi Arabia, and South Africa, presents a promising investment landscape. Driven by factors such as rising disposable incomes, increasing urbanization leading to convenience food preference, and a growing awareness of seafood's health benefits, the market experienced a robust CAGR of 4.34% from 2019 to 2024. The market is segmented by distribution channels (supermarkets/hypermarkets, convenience stores, online retailers, and others) and product type (canned fish, shrimp, prawns, and others). Supermarkets and hypermarkets currently dominate distribution, reflecting established retail infrastructure and consumer shopping habits. However, the online retail segment is poised for significant growth due to increasing internet penetration and e-commerce adoption across the region. Canned tuna and sardines are currently high-volume product types, reflecting established consumer preferences and affordability. However, premium canned seafood options, including shrimp and prawns, are witnessing increasing demand, driven by changing consumer lifestyles and a willingness to spend more on higher-quality products. Key players like Thai Union Group (John West) and Oceana Group Limited are leveraging their established brand recognition and distribution networks to capitalize on this market growth.
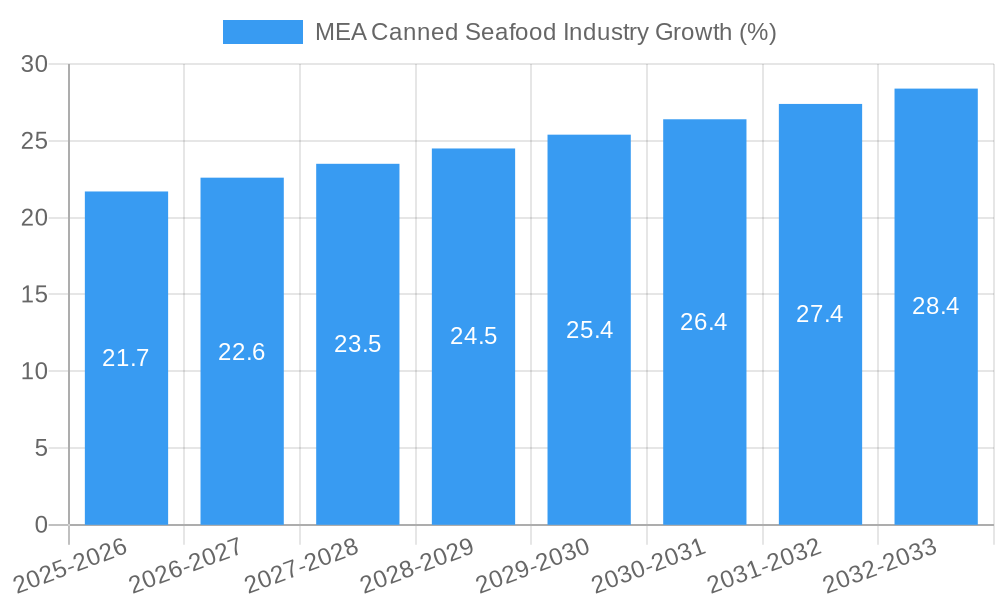
The forecast period (2025-2033) projects continued expansion, albeit potentially at a slightly moderated rate. This moderation could be attributed to factors such as fluctuating global seafood prices, economic volatility impacting consumer spending, and potential supply chain disruptions. However, sustained growth is anticipated due to the region's young and expanding population, ongoing urbanization, and the introduction of innovative products and marketing strategies by established players and new entrants alike. Specific market share within each segment will depend on effective branding, pricing strategies, and successful penetration of diverse distribution channels. Further growth opportunities exist through expanding product offerings, catering to diverse cultural preferences, and focusing on sustainability initiatives to attract environmentally conscious consumers. Successful players will need to adapt to changing consumer preferences and economic conditions, balancing affordability and premium product offerings within the context of a dynamic and diverse marketplace.
MEA Canned Seafood Industry: A Comprehensive Market Report (2019-2033)
This comprehensive report provides an in-depth analysis of the Middle East and Africa (MEA) canned seafood industry, offering invaluable insights for industry professionals, investors, and stakeholders. The report covers the period 2019-2033, with a focus on the base year 2025 and a forecast period from 2025-2033. It examines market dynamics, growth trends, leading players, and emerging opportunities within the canned fish and canned shellfish (shrimp, prawns) segments. The report uses Million units as the unit of measurement for all quantitative data.
MEA Canned Seafood Industry Market Dynamics & Structure
This section analyzes the MEA canned seafood market's competitive landscape, technological advancements, regulatory environment, and market trends. We explore the market concentration, examining the market share held by key players such as Kawasho Foods Corporation, Thai Union Group (John West), Bidvest Namibia Fisheries Holdings (Pty) Limited, Terrasan Group of Companies (Saldanha), Al-Alali, Shrimp Nation, Oceana Group Limited, Bolton Group B.V., Trident Seafood Corporation, and American Tuna Inc. The analysis incorporates M&A activity, assessing its impact on market structure and competition. The report also investigates the influence of technological innovations on production efficiency and product diversification, along with the role of regulatory frameworks in shaping industry practices. The impact of substitute products and changing consumer preferences are also discussed.
- Market Concentration: xx% of the market is controlled by the top 5 players in 2025.
- Technological Innovation: Focus on automation, improved canning techniques, and sustainable packaging.
- Regulatory Framework: Analysis of existing food safety regulations and their impact on the industry.
- Competitive Substitutes: Examination of alternative protein sources and their competitive pressure on canned seafood.
- End-User Demographics: Analysis of consumer preferences, dietary habits, and purchasing power across different demographics.
- M&A Trends: xx M&A deals recorded between 2019 and 2024, with a predicted xx deals for 2025-2033.
MEA Canned Seafood Industry Growth Trends & Insights
This section offers a detailed analysis of the MEA canned seafood market's growth trajectory. We examine historical data (2019-2024) and forecast future trends (2025-2033) using comprehensive data and market research methodologies. Key performance indicators (KPIs) like CAGR, market penetration rates, and adoption trends are incorporated to provide a comprehensive view of the market's evolution. The analysis explores shifts in consumer behavior, technological disruptions, and their impact on market growth. The influence of economic factors, changing dietary preferences, and the rise of online retail are also thoroughly investigated.
- Market Size Evolution: xx Million units in 2019, projected to reach xx Million units by 2033.
- CAGR: xx% during the forecast period (2025-2033).
- Adoption Rates: Analysis of the increasing adoption of canned seafood across various demographics.
- Technological Disruptions: Impact of innovations in processing, packaging, and distribution on market growth.
- Consumer Behavior Shifts: Analysis of shifting preferences, demand for sustainable products, and health consciousness affecting purchasing decisions.
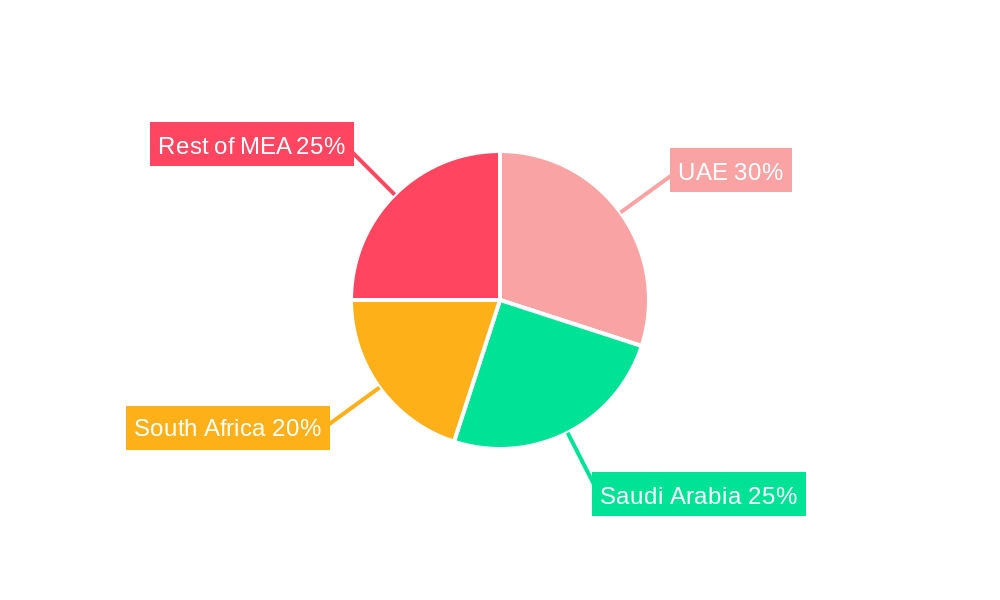
Dominant Regions, Countries, or Segments in MEA Canned Seafood Industry
This section identifies the key regions, countries, and segments within the MEA canned seafood market driving growth. We analyze the performance of various distribution channels (supermarkets/hypermarkets, convenience stores, online retailers, other channels) and product types (canned fish, canned shrimp, canned prawns, other types) to pinpoint the leading segments. The analysis explores the underlying drivers contributing to the dominance of specific regions, countries, or product segments. Key drivers such as economic policies, infrastructure development, and consumer preferences are analyzed. Market share and growth potential are assessed for each segment, providing a comprehensive understanding of the industry's regional and segmental performance.
- Leading Region/Country: xx (Based on market share and growth rate in 2025)
- Dominant Distribution Channel: Supermarkets/Hypermarkets (xx% market share in 2025)
- Fastest-Growing Segment: Canned Shrimp (xx% CAGR during 2025-2033)
- Key Drivers: Increasing disposable incomes, rising urbanization, and growing preference for convenient food options.
MEA Canned Seafood Industry Product Landscape
This section provides a concise overview of the product landscape within the MEA canned seafood industry. It highlights key product innovations, applications, and performance metrics, focusing on unique selling propositions (USPs) and advancements in technology that enhance product quality, shelf life, and consumer appeal. The discussion will also touch upon the development and introduction of new products catering to specific consumer demands and preferences.
The MEA canned seafood market showcases a diverse range of products, including various fish types packed in oil, brine, or sauce, alongside a variety of canned shrimp and prawn options tailored to diverse tastes and preferences. Technological advancements are focused on enhancing food safety, extending shelf life, and creating innovative packaging solutions.
Key Drivers, Barriers & Challenges in MEA Canned Seafood Industry
This section identifies the key factors driving growth in the MEA canned seafood industry and analyzes the challenges and restraints the industry faces.
Key Drivers: Increasing population, rising disposable incomes in several MEA countries, growing demand for convenient and affordable protein sources, and the expanding retail sector.
Challenges and Restraints: Fluctuations in raw material prices, dependence on imports in some regions, stringent food safety regulations, and increasing competition from substitute protein sources. Supply chain disruptions caused by geopolitical instability can lead to price volatility and product shortages (estimated impact: xx% reduction in sales during periods of disruption).
Emerging Opportunities in MEA Canned Seafood Industry
This section highlights emerging opportunities within the MEA canned seafood market. Growth is expected in areas such as sustainable sourcing, innovative packaging solutions, and the expansion into untapped markets. Opportunities also exist in developing value-added products, catering to specific dietary needs (e.g., organic, low-sodium options), and tapping into the growing online retail sector.
Growth Accelerators in the MEA Canned Seafood Industry
Technological advancements, strategic partnerships, and expansion into new markets will be key drivers of long-term growth in the MEA canned seafood industry. Investment in sustainable fishing practices and eco-friendly packaging will also enhance the sector’s appeal to environmentally conscious consumers.
Key Players Shaping the MEA Canned Seafood Industry Market
- Kawasho Foods Corporation
- Thai Union Group (John West) [Thai Union Website]
- Bidvest Namibia Fisheries Holdings (Pty) Limited
- Terrasan Group of Companies (Saldanha)
- Al-Alali
- Shrimp Nation
- Oceana Group Limited [Oceana Group Website]
- Bolton Group B.V.
- Trident Seafood Corporation
- American Tuna Inc
Notable Milestones in MEA Canned Seafood Industry Sector
- August 2021: Bolton Group B.V. acquires Wild Planet Foods, expanding its sustainable seafood portfolio and global presence.
- April 2022: Shrimp Nation launches a new branch in the UAE, tapping into the growing demand for high-quality seafood.
- November 2022: Thai Union Group converts its investment in Aegir Seafood into a 50% shareholding, expanding its product portfolio to include high-quality cod liver.
In-Depth MEA Canned Seafood Industry Market Outlook
The MEA canned seafood market is poised for significant growth over the forecast period, driven by factors such as increasing urbanization, rising disposable incomes, and the growing popularity of convenient food options. Strategic partnerships, investments in sustainable practices, and innovative product development will be crucial in capitalizing on this growth potential. The market's long-term outlook is positive, with significant opportunities for expansion and diversification.
MEA Canned Seafood Industry Segmentation
-
1. Type
-
1.1. Canned Fish
- 1.1.1. Tuna
- 1.1.2. Salmon
- 1.1.3. Sardines
- 1.1.4. Mackrel
- 1.2. Canned Shrimp
- 1.3. Canned Prawns
- 1.4. Other Types
-
1.1. Canned Fish
-
2. Distribution Channel
- 2.1. Supermarkets/Hypermarkets
- 2.2. Convenience Stores
- 2.3. Online Retailers
- 2.4. Other Distruibution Channels
-
3. Geography
- 3.1. United Arab Emirates
- 3.2. South Africa
- 3.3. Rest of the Middle East and Africa
MEA Canned Seafood Industry Segmentation By Geography
- 1. United Arab Emirates
- 2. South Africa
- 3. Rest of the Middle East and Africa
MEA Canned Seafood Industry REPORT HIGHLIGHTS
| Aspects | Details |
|---|---|
| Study Period | 2019-2033 |
| Base Year | 2024 |
| Estimated Year | 2025 |
| Forecast Period | 2025-2033 |
| Historical Period | 2019-2024 |
| Growth Rate | CAGR of 4.34% from 2019-2033 |
| Segmentation |
|
Table of Contents
- 1. Introduction
- 1.1. Research Scope
- 1.2. Market Segmentation
- 1.3. Research Methodology
- 1.4. Definitions and Assumptions
- 2. Executive Summary
- 2.1. Introduction
- 3. Market Dynamics
- 3.1. Introduction
- 3.2. Market Drivers
- 3.2.1. Increasing Consumer Demand for Convenient Food such as Canned seafood
- 3.3. Market Restrains
- 3.3.1. Many consumers perceive fresh seafood as healthier compared to canned options
- 3.4. Market Trends
- 3.4.1. Growing Popularity For Seafood Among Meat Products
- 4. Market Factor Analysis
- 4.1. Porters Five Forces
- 4.2. Supply/Value Chain
- 4.3. PESTEL analysis
- 4.4. Market Entropy
- 4.5. Patent/Trademark Analysis
- 5. Global MEA Canned Seafood Industry Analysis, Insights and Forecast, 2019-2031
- 5.1. Market Analysis, Insights and Forecast - by Type
- 5.1.1. Canned Fish
- 5.1.1.1. Tuna
- 5.1.1.2. Salmon
- 5.1.1.3. Sardines
- 5.1.1.4. Mackrel
- 5.1.2. Canned Shrimp
- 5.1.3. Canned Prawns
- 5.1.4. Other Types
- 5.1.1. Canned Fish
- 5.2. Market Analysis, Insights and Forecast - by Distribution Channel
- 5.2.1. Supermarkets/Hypermarkets
- 5.2.2. Convenience Stores
- 5.2.3. Online Retailers
- 5.2.4. Other Distruibution Channels
- 5.3. Market Analysis, Insights and Forecast - by Geography
- 5.3.1. United Arab Emirates
- 5.3.2. South Africa
- 5.3.3. Rest of the Middle East and Africa
- 5.4. Market Analysis, Insights and Forecast - by Region
- 5.4.1. United Arab Emirates
- 5.4.2. South Africa
- 5.4.3. Rest of the Middle East and Africa
- 5.1. Market Analysis, Insights and Forecast - by Type
- 6. United Arab Emirates MEA Canned Seafood Industry Analysis, Insights and Forecast, 2019-2031
- 6.1. Market Analysis, Insights and Forecast - by Type
- 6.1.1. Canned Fish
- 6.1.1.1. Tuna
- 6.1.1.2. Salmon
- 6.1.1.3. Sardines
- 6.1.1.4. Mackrel
- 6.1.2. Canned Shrimp
- 6.1.3. Canned Prawns
- 6.1.4. Other Types
- 6.1.1. Canned Fish
- 6.2. Market Analysis, Insights and Forecast - by Distribution Channel
- 6.2.1. Supermarkets/Hypermarkets
- 6.2.2. Convenience Stores
- 6.2.3. Online Retailers
- 6.2.4. Other Distruibution Channels
- 6.3. Market Analysis, Insights and Forecast - by Geography
- 6.3.1. United Arab Emirates
- 6.3.2. South Africa
- 6.3.3. Rest of the Middle East and Africa
- 6.1. Market Analysis, Insights and Forecast - by Type
- 7. South Africa MEA Canned Seafood Industry Analysis, Insights and Forecast, 2019-2031
- 7.1. Market Analysis, Insights and Forecast - by Type
- 7.1.1. Canned Fish
- 7.1.1.1. Tuna
- 7.1.1.2. Salmon
- 7.1.1.3. Sardines
- 7.1.1.4. Mackrel
- 7.1.2. Canned Shrimp
- 7.1.3. Canned Prawns
- 7.1.4. Other Types
- 7.1.1. Canned Fish
- 7.2. Market Analysis, Insights and Forecast - by Distribution Channel
- 7.2.1. Supermarkets/Hypermarkets
- 7.2.2. Convenience Stores
- 7.2.3. Online Retailers
- 7.2.4. Other Distruibution Channels
- 7.3. Market Analysis, Insights and Forecast - by Geography
- 7.3.1. United Arab Emirates
- 7.3.2. South Africa
- 7.3.3. Rest of the Middle East and Africa
- 7.1. Market Analysis, Insights and Forecast - by Type
- 8. Rest of the Middle East and Africa MEA Canned Seafood Industry Analysis, Insights and Forecast, 2019-2031
- 8.1. Market Analysis, Insights and Forecast - by Type
- 8.1.1. Canned Fish
- 8.1.1.1. Tuna
- 8.1.1.2. Salmon
- 8.1.1.3. Sardines
- 8.1.1.4. Mackrel
- 8.1.2. Canned Shrimp
- 8.1.3. Canned Prawns
- 8.1.4. Other Types
- 8.1.1. Canned Fish
- 8.2. Market Analysis, Insights and Forecast - by Distribution Channel
- 8.2.1. Supermarkets/Hypermarkets
- 8.2.2. Convenience Stores
- 8.2.3. Online Retailers
- 8.2.4. Other Distruibution Channels
- 8.3. Market Analysis, Insights and Forecast - by Geography
- 8.3.1. United Arab Emirates
- 8.3.2. South Africa
- 8.3.3. Rest of the Middle East and Africa
- 8.1. Market Analysis, Insights and Forecast - by Type
- 9. United Arab Emirates MEA Canned Seafood Industry Analysis, Insights and Forecast, 2019-2031
- 10. Saudi Arabia MEA Canned Seafood Industry Analysis, Insights and Forecast, 2019-2031
- 11. South Africa MEA Canned Seafood Industry Analysis, Insights and Forecast, 2019-2031
- 12. Rest of Middle East and Africa MEA Canned Seafood Industry Analysis, Insights and Forecast, 2019-2031
- 13. Competitive Analysis
- 13.1. Global Market Share Analysis 2024
- 13.2. Company Profiles
- 13.2.1 Kawasho Foods Corporation
- 13.2.1.1. Overview
- 13.2.1.2. Products
- 13.2.1.3. SWOT Analysis
- 13.2.1.4. Recent Developments
- 13.2.1.5. Financials (Based on Availability)
- 13.2.2 Thai Union Group (John West)
- 13.2.2.1. Overview
- 13.2.2.2. Products
- 13.2.2.3. SWOT Analysis
- 13.2.2.4. Recent Developments
- 13.2.2.5. Financials (Based on Availability)
- 13.2.3 Bidvest Namibia Fisheries Holdings (Pty) Limited
- 13.2.3.1. Overview
- 13.2.3.2. Products
- 13.2.3.3. SWOT Analysis
- 13.2.3.4. Recent Developments
- 13.2.3.5. Financials (Based on Availability)
- 13.2.4 Terrasan Group of Companies (Saldanha)
- 13.2.4.1. Overview
- 13.2.4.2. Products
- 13.2.4.3. SWOT Analysis
- 13.2.4.4. Recent Developments
- 13.2.4.5. Financials (Based on Availability)
- 13.2.5 Al-Alali
- 13.2.5.1. Overview
- 13.2.5.2. Products
- 13.2.5.3. SWOT Analysis
- 13.2.5.4. Recent Developments
- 13.2.5.5. Financials (Based on Availability)
- 13.2.6 Shrimp Nation
- 13.2.6.1. Overview
- 13.2.6.2. Products
- 13.2.6.3. SWOT Analysis
- 13.2.6.4. Recent Developments
- 13.2.6.5. Financials (Based on Availability)
- 13.2.7 Oceana Group Limited
- 13.2.7.1. Overview
- 13.2.7.2. Products
- 13.2.7.3. SWOT Analysis
- 13.2.7.4. Recent Developments
- 13.2.7.5. Financials (Based on Availability)
- 13.2.8 Bolton Group B V
- 13.2.8.1. Overview
- 13.2.8.2. Products
- 13.2.8.3. SWOT Analysis
- 13.2.8.4. Recent Developments
- 13.2.8.5. Financials (Based on Availability)
- 13.2.9 Trident Seafood Corporation
- 13.2.9.1. Overview
- 13.2.9.2. Products
- 13.2.9.3. SWOT Analysis
- 13.2.9.4. Recent Developments
- 13.2.9.5. Financials (Based on Availability)
- 13.2.10 American Tuna Inc
- 13.2.10.1. Overview
- 13.2.10.2. Products
- 13.2.10.3. SWOT Analysis
- 13.2.10.4. Recent Developments
- 13.2.10.5. Financials (Based on Availability)
- 13.2.1 Kawasho Foods Corporation
List of Figures
- Figure 1: Global MEA Canned Seafood Industry Revenue Breakdown (Million, %) by Region 2024 & 2032
- Figure 2: Global MEA Canned Seafood Industry Volume Breakdown (K Tons, %) by Region 2024 & 2032
- Figure 3: MEA MEA Canned Seafood Industry Revenue (Million), by Country 2024 & 2032
- Figure 4: MEA MEA Canned Seafood Industry Volume (K Tons), by Country 2024 & 2032
- Figure 5: MEA MEA Canned Seafood Industry Revenue Share (%), by Country 2024 & 2032
- Figure 6: MEA MEA Canned Seafood Industry Volume Share (%), by Country 2024 & 2032
- Figure 7: United Arab Emirates MEA Canned Seafood Industry Revenue (Million), by Type 2024 & 2032
- Figure 8: United Arab Emirates MEA Canned Seafood Industry Volume (K Tons), by Type 2024 & 2032
- Figure 9: United Arab Emirates MEA Canned Seafood Industry Revenue Share (%), by Type 2024 & 2032
- Figure 10: United Arab Emirates MEA Canned Seafood Industry Volume Share (%), by Type 2024 & 2032
- Figure 11: United Arab Emirates MEA Canned Seafood Industry Revenue (Million), by Distribution Channel 2024 & 2032
- Figure 12: United Arab Emirates MEA Canned Seafood Industry Volume (K Tons), by Distribution Channel 2024 & 2032
- Figure 13: United Arab Emirates MEA Canned Seafood Industry Revenue Share (%), by Distribution Channel 2024 & 2032
- Figure 14: United Arab Emirates MEA Canned Seafood Industry Volume Share (%), by Distribution Channel 2024 & 2032
- Figure 15: United Arab Emirates MEA Canned Seafood Industry Revenue (Million), by Geography 2024 & 2032
- Figure 16: United Arab Emirates MEA Canned Seafood Industry Volume (K Tons), by Geography 2024 & 2032
- Figure 17: United Arab Emirates MEA Canned Seafood Industry Revenue Share (%), by Geography 2024 & 2032
- Figure 18: United Arab Emirates MEA Canned Seafood Industry Volume Share (%), by Geography 2024 & 2032
- Figure 19: United Arab Emirates MEA Canned Seafood Industry Revenue (Million), by Country 2024 & 2032
- Figure 20: United Arab Emirates MEA Canned Seafood Industry Volume (K Tons), by Country 2024 & 2032
- Figure 21: United Arab Emirates MEA Canned Seafood Industry Revenue Share (%), by Country 2024 & 2032
- Figure 22: United Arab Emirates MEA Canned Seafood Industry Volume Share (%), by Country 2024 & 2032
- Figure 23: South Africa MEA Canned Seafood Industry Revenue (Million), by Type 2024 & 2032
- Figure 24: South Africa MEA Canned Seafood Industry Volume (K Tons), by Type 2024 & 2032
- Figure 25: South Africa MEA Canned Seafood Industry Revenue Share (%), by Type 2024 & 2032
- Figure 26: South Africa MEA Canned Seafood Industry Volume Share (%), by Type 2024 & 2032
- Figure 27: South Africa MEA Canned Seafood Industry Revenue (Million), by Distribution Channel 2024 & 2032
- Figure 28: South Africa MEA Canned Seafood Industry Volume (K Tons), by Distribution Channel 2024 & 2032
- Figure 29: South Africa MEA Canned Seafood Industry Revenue Share (%), by Distribution Channel 2024 & 2032
- Figure 30: South Africa MEA Canned Seafood Industry Volume Share (%), by Distribution Channel 2024 & 2032
- Figure 31: South Africa MEA Canned Seafood Industry Revenue (Million), by Geography 2024 & 2032
- Figure 32: South Africa MEA Canned Seafood Industry Volume (K Tons), by Geography 2024 & 2032
- Figure 33: South Africa MEA Canned Seafood Industry Revenue Share (%), by Geography 2024 & 2032
- Figure 34: South Africa MEA Canned Seafood Industry Volume Share (%), by Geography 2024 & 2032
- Figure 35: South Africa MEA Canned Seafood Industry Revenue (Million), by Country 2024 & 2032
- Figure 36: South Africa MEA Canned Seafood Industry Volume (K Tons), by Country 2024 & 2032
- Figure 37: South Africa MEA Canned Seafood Industry Revenue Share (%), by Country 2024 & 2032
- Figure 38: South Africa MEA Canned Seafood Industry Volume Share (%), by Country 2024 & 2032
- Figure 39: Rest of the Middle East and Africa MEA Canned Seafood Industry Revenue (Million), by Type 2024 & 2032
- Figure 40: Rest of the Middle East and Africa MEA Canned Seafood Industry Volume (K Tons), by Type 2024 & 2032
- Figure 41: Rest of the Middle East and Africa MEA Canned Seafood Industry Revenue Share (%), by Type 2024 & 2032
- Figure 42: Rest of the Middle East and Africa MEA Canned Seafood Industry Volume Share (%), by Type 2024 & 2032
- Figure 43: Rest of the Middle East and Africa MEA Canned Seafood Industry Revenue (Million), by Distribution Channel 2024 & 2032
- Figure 44: Rest of the Middle East and Africa MEA Canned Seafood Industry Volume (K Tons), by Distribution Channel 2024 & 2032
- Figure 45: Rest of the Middle East and Africa MEA Canned Seafood Industry Revenue Share (%), by Distribution Channel 2024 & 2032
- Figure 46: Rest of the Middle East and Africa MEA Canned Seafood Industry Volume Share (%), by Distribution Channel 2024 & 2032
- Figure 47: Rest of the Middle East and Africa MEA Canned Seafood Industry Revenue (Million), by Geography 2024 & 2032
- Figure 48: Rest of the Middle East and Africa MEA Canned Seafood Industry Volume (K Tons), by Geography 2024 & 2032
- Figure 49: Rest of the Middle East and Africa MEA Canned Seafood Industry Revenue Share (%), by Geography 2024 & 2032
- Figure 50: Rest of the Middle East and Africa MEA Canned Seafood Industry Volume Share (%), by Geography 2024 & 2032
- Figure 51: Rest of the Middle East and Africa MEA Canned Seafood Industry Revenue (Million), by Country 2024 & 2032
- Figure 52: Rest of the Middle East and Africa MEA Canned Seafood Industry Volume (K Tons), by Country 2024 & 2032
- Figure 53: Rest of the Middle East and Africa MEA Canned Seafood Industry Revenue Share (%), by Country 2024 & 2032
- Figure 54: Rest of the Middle East and Africa MEA Canned Seafood Industry Volume Share (%), by Country 2024 & 2032
List of Tables
- Table 1: Global MEA Canned Seafood Industry Revenue Million Forecast, by Region 2019 & 2032
- Table 2: Global MEA Canned Seafood Industry Volume K Tons Forecast, by Region 2019 & 2032
- Table 3: Global MEA Canned Seafood Industry Revenue Million Forecast, by Type 2019 & 2032
- Table 4: Global MEA Canned Seafood Industry Volume K Tons Forecast, by Type 2019 & 2032
- Table 5: Global MEA Canned Seafood Industry Revenue Million Forecast, by Distribution Channel 2019 & 2032
- Table 6: Global MEA Canned Seafood Industry Volume K Tons Forecast, by Distribution Channel 2019 & 2032
- Table 7: Global MEA Canned Seafood Industry Revenue Million Forecast, by Geography 2019 & 2032
- Table 8: Global MEA Canned Seafood Industry Volume K Tons Forecast, by Geography 2019 & 2032
- Table 9: Global MEA Canned Seafood Industry Revenue Million Forecast, by Region 2019 & 2032
- Table 10: Global MEA Canned Seafood Industry Volume K Tons Forecast, by Region 2019 & 2032
- Table 11: Global MEA Canned Seafood Industry Revenue Million Forecast, by Country 2019 & 2032
- Table 12: Global MEA Canned Seafood Industry Volume K Tons Forecast, by Country 2019 & 2032
- Table 13: United Arab Emirates MEA Canned Seafood Industry Revenue (Million) Forecast, by Application 2019 & 2032
- Table 14: United Arab Emirates MEA Canned Seafood Industry Volume (K Tons) Forecast, by Application 2019 & 2032
- Table 15: Saudi Arabia MEA Canned Seafood Industry Revenue (Million) Forecast, by Application 2019 & 2032
- Table 16: Saudi Arabia MEA Canned Seafood Industry Volume (K Tons) Forecast, by Application 2019 & 2032
- Table 17: South Africa MEA Canned Seafood Industry Revenue (Million) Forecast, by Application 2019 & 2032
- Table 18: South Africa MEA Canned Seafood Industry Volume (K Tons) Forecast, by Application 2019 & 2032
- Table 19: Rest of Middle East and Africa MEA Canned Seafood Industry Revenue (Million) Forecast, by Application 2019 & 2032
- Table 20: Rest of Middle East and Africa MEA Canned Seafood Industry Volume (K Tons) Forecast, by Application 2019 & 2032
- Table 21: Global MEA Canned Seafood Industry Revenue Million Forecast, by Type 2019 & 2032
- Table 22: Global MEA Canned Seafood Industry Volume K Tons Forecast, by Type 2019 & 2032
- Table 23: Global MEA Canned Seafood Industry Revenue Million Forecast, by Distribution Channel 2019 & 2032
- Table 24: Global MEA Canned Seafood Industry Volume K Tons Forecast, by Distribution Channel 2019 & 2032
- Table 25: Global MEA Canned Seafood Industry Revenue Million Forecast, by Geography 2019 & 2032
- Table 26: Global MEA Canned Seafood Industry Volume K Tons Forecast, by Geography 2019 & 2032
- Table 27: Global MEA Canned Seafood Industry Revenue Million Forecast, by Country 2019 & 2032
- Table 28: Global MEA Canned Seafood Industry Volume K Tons Forecast, by Country 2019 & 2032
- Table 29: Global MEA Canned Seafood Industry Revenue Million Forecast, by Type 2019 & 2032
- Table 30: Global MEA Canned Seafood Industry Volume K Tons Forecast, by Type 2019 & 2032
- Table 31: Global MEA Canned Seafood Industry Revenue Million Forecast, by Distribution Channel 2019 & 2032
- Table 32: Global MEA Canned Seafood Industry Volume K Tons Forecast, by Distribution Channel 2019 & 2032
- Table 33: Global MEA Canned Seafood Industry Revenue Million Forecast, by Geography 2019 & 2032
- Table 34: Global MEA Canned Seafood Industry Volume K Tons Forecast, by Geography 2019 & 2032
- Table 35: Global MEA Canned Seafood Industry Revenue Million Forecast, by Country 2019 & 2032
- Table 36: Global MEA Canned Seafood Industry Volume K Tons Forecast, by Country 2019 & 2032
- Table 37: Global MEA Canned Seafood Industry Revenue Million Forecast, by Type 2019 & 2032
- Table 38: Global MEA Canned Seafood Industry Volume K Tons Forecast, by Type 2019 & 2032
- Table 39: Global MEA Canned Seafood Industry Revenue Million Forecast, by Distribution Channel 2019 & 2032
- Table 40: Global MEA Canned Seafood Industry Volume K Tons Forecast, by Distribution Channel 2019 & 2032
- Table 41: Global MEA Canned Seafood Industry Revenue Million Forecast, by Geography 2019 & 2032
- Table 42: Global MEA Canned Seafood Industry Volume K Tons Forecast, by Geography 2019 & 2032
- Table 43: Global MEA Canned Seafood Industry Revenue Million Forecast, by Country 2019 & 2032
- Table 44: Global MEA Canned Seafood Industry Volume K Tons Forecast, by Country 2019 & 2032
Frequently Asked Questions
1. What is the projected Compound Annual Growth Rate (CAGR) of the MEA Canned Seafood Industry?
The projected CAGR is approximately 4.34%.
2. Which companies are prominent players in the MEA Canned Seafood Industry?
Key companies in the market include Kawasho Foods Corporation, Thai Union Group (John West), Bidvest Namibia Fisheries Holdings (Pty) Limited, Terrasan Group of Companies (Saldanha), Al-Alali, Shrimp Nation, Oceana Group Limited, Bolton Group B V, Trident Seafood Corporation, American Tuna Inc.
3. What are the main segments of the MEA Canned Seafood Industry?
The market segments include Type, Distribution Channel, Geography.
4. Can you provide details about the market size?
The market size is estimated to be USD XX Million as of 2022.
5. What are some drivers contributing to market growth?
Increasing Consumer Demand for Convenient Food such as Canned seafood.
6. What are the notable trends driving market growth?
Growing Popularity For Seafood Among Meat Products.
7. Are there any restraints impacting market growth?
Many consumers perceive fresh seafood as healthier compared to canned options.
8. Can you provide examples of recent developments in the market?
November 2022: Thai Union Group converted its loan-based strategic investment in Aegir Seafood into a 50% shareholding, further strengthening the successful business relationship between the two companies. Since Thai Union's initial investment in 2019, Aegir Seafood has made a substantial contribution to the growth of Thai Union's brands and private label business, particularly for King Oscar and Rügen Fisch. This acquisition has allowed Thai Union Group to expand its product portfolio to include high-quality cod liver, which is a premium product that complements its existing range of seafood products.
9. What pricing options are available for accessing the report?
Pricing options include single-user, multi-user, and enterprise licenses priced at USD 4750, USD 5250, and USD 8750 respectively.
10. Is the market size provided in terms of value or volume?
The market size is provided in terms of value, measured in Million and volume, measured in K Tons.
11. Are there any specific market keywords associated with the report?
Yes, the market keyword associated with the report is "MEA Canned Seafood Industry," which aids in identifying and referencing the specific market segment covered.
12. How do I determine which pricing option suits my needs best?
The pricing options vary based on user requirements and access needs. Individual users may opt for single-user licenses, while businesses requiring broader access may choose multi-user or enterprise licenses for cost-effective access to the report.
13. Are there any additional resources or data provided in the MEA Canned Seafood Industry report?
While the report offers comprehensive insights, it's advisable to review the specific contents or supplementary materials provided to ascertain if additional resources or data are available.
14. How can I stay updated on further developments or reports in the MEA Canned Seafood Industry?
To stay informed about further developments, trends, and reports in the MEA Canned Seafood Industry, consider subscribing to industry newsletters, following relevant companies and organizations, or regularly checking reputable industry news sources and publications.
Methodology
Step 1 - Identification of Relevant Samples Size from Population Database


Step 2 - Approaches for Defining Global Market Size (Value, Volume* & Price*)

Note*: In applicable scenarios
Step 3 - Data Sources
Primary Research
- Web Analytics
- Survey Reports
- Research Institute
- Latest Research Reports
- Opinion Leaders
Secondary Research
- Annual Reports
- White Paper
- Latest Press Release
- Industry Association
- Paid Database
- Investor Presentations

Step 4 - Data Triangulation
Involves using different sources of information in order to increase the validity of a study
These sources are likely to be stakeholders in a program - participants, other researchers, program staff, other community members, and so on.
Then we put all data in single framework & apply various statistical tools to find out the dynamic on the market.
During the analysis stage, feedback from the stakeholder groups would be compared to determine areas of agreement as well as areas of divergence


