

Key Insights
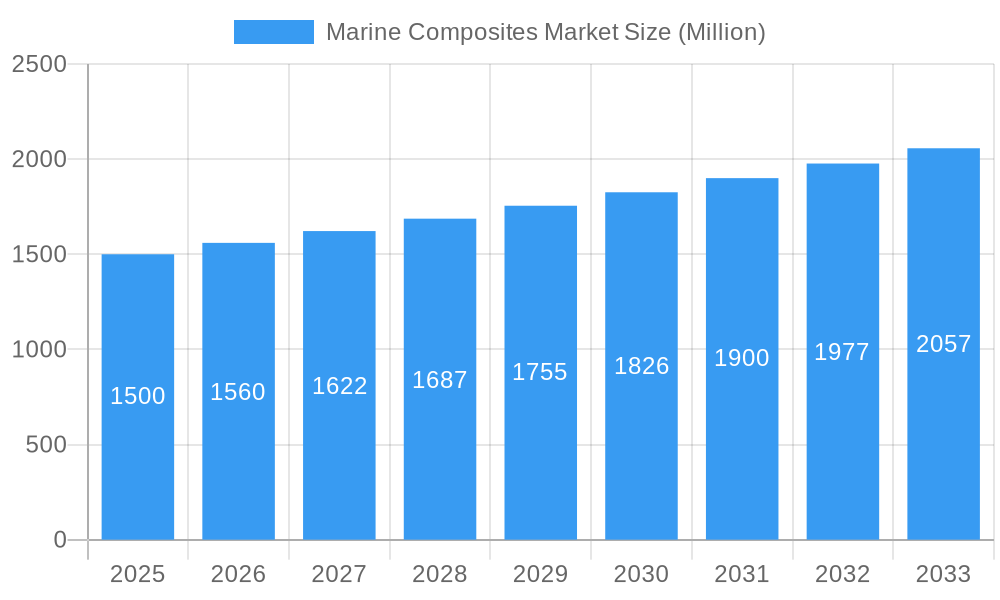
The marine composites market, valued at $1341 million in 2025, is poised for significant expansion with a projected Compound Annual Growth Rate (CAGR) of 5% from 2025 to 2033. This robust growth is fueled by the escalating demand for lightweight, high-strength materials across the shipbuilding sector, including sailboats, powerboats, and cruise ships. The marine industry's commitment to enhanced fuel efficiency and reduced emissions further drives the adoption of composites due to their superior performance-to-weight ratios over traditional materials. Continuous advancements in resin systems, such as epoxy and polyester, are expanding the capabilities and applications of marine composites. The market offers a diverse range of composite types, including polymer matrix, metal matrix, and ceramic matrix, to meet varied vessel design and operational demands. Key growth regions include Asia Pacific, North America, and Europe, driven by expanding shipbuilding activities and increased consumer spending on recreational boating.
Marine Composites Market Market Size (In Billion)
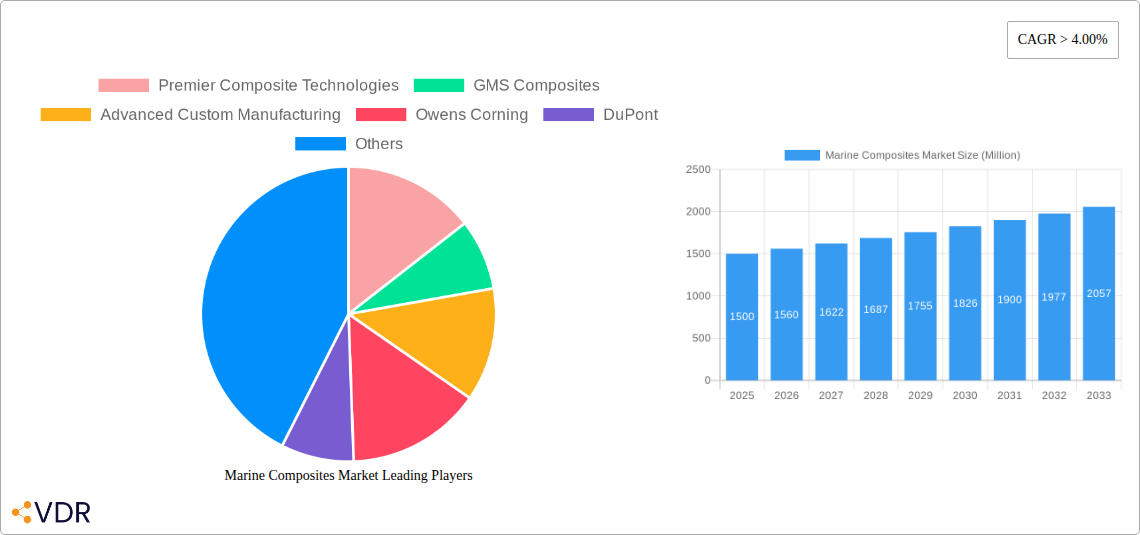
Despite significant growth potential, the marine composites market faces certain constraints. The initial investment cost of composite materials remains higher than conventional alternatives, and complex manufacturing processes requiring specialized expertise present adoption hurdles. Fluctuations in raw material pricing and global economic conditions also influence market dynamics. However, sustained innovation and a growing preference for high-performance, durable, and environmentally conscious materials in the marine sector ensure a positive long-term outlook. Market segmentation by vessel type and composite type offers strategic insights for key players, guiding product development and expansion initiatives. Prominent companies like Premier Composite Technologies, GMS Composites, and Owens Corning are actively contributing to market evolution through their innovative offerings and technological advancements.
Marine Composites Market Company Market Share
Marine Composites Market: A Comprehensive Report (2019-2033)
This in-depth report provides a comprehensive analysis of the Marine Composites Market, encompassing its current state, future projections, and key players. The study period spans from 2019 to 2033, with 2025 serving as the base and estimated year. The report segments the market by vessel type (sailboats, cruise ships, powerboats, other), composite type (metal matrix, polymer matrix, ceramic matrix), and resin type (epoxy, polyester, others), providing granular insights into market dynamics across these segments. The parent market is the broader composites industry, while the child market focuses specifically on marine applications. The total market size is projected at xx Million in 2025 and is expected to reach xx Million by 2033.
Marine Composites Market Market Dynamics & Structure
The marine composites market is characterized by moderate concentration, with several key players dominating specific segments. Technological innovation, particularly in lightweight and high-strength materials, is a primary growth driver. Stringent environmental regulations regarding emissions and waste management are also shaping market trends. Competitive substitutes, such as traditional materials like steel and aluminum, continue to pose a challenge. The market witnesses consistent M&A activity, aiming for consolidation and expansion into new technologies.
- Market Concentration: Moderately concentrated, with top 5 players holding approximately xx% market share in 2025.
- Technological Innovation: Focus on lightweight, high-strength materials (e.g., carbon fiber reinforced polymers) driving growth.
- Regulatory Framework: Environmental regulations impacting material choices and manufacturing processes.
- Competitive Substitutes: Steel and aluminum remain prevalent alternatives, impacting market penetration.
- End-User Demographics: Growing demand from leisure boating and commercial shipping sectors.
- M&A Trends: xx M&A deals observed in the historical period (2019-2024), signifying industry consolidation.
Marine Composites Market Growth Trends & Insights
The marine composites market has witnessed a steady growth trajectory over the historical period (2019-2024). Driven by increasing demand for high-performance vessels and a shift towards sustainable materials, the market experienced a CAGR of xx% during this time. The adoption rate of composites in various vessel types, particularly in leisure boating, has been significant. Technological advancements, including the development of more durable and cost-effective composite materials, are further accelerating market growth. Consumer preferences are shifting towards lighter, faster, and more fuel-efficient vessels, fueling the demand for advanced composites. The market penetration rate of composites in the marine industry is expected to reach xx% by 2033.
Dominant Regions, Countries, or Segments in Marine Composites Market
North America currently dominates the marine composites market, followed by Europe and Asia-Pacific. Within vessel types, the powerboats segment holds the largest market share, driven by high demand for recreational boats. Polymer matrix composites constitute the most widely used composite type, owing to their versatility and cost-effectiveness. Epoxy resins are the dominant resin type, favored for their high strength and durability.
- Key Drivers:
- Growing leisure boating market in North America and Europe.
- Increasing demand for high-performance vessels in the commercial sector.
- Government incentives promoting the adoption of sustainable materials.
- Dominance Factors:
- Established manufacturing base in North America.
- High disposable income in developed economies.
- Favorable regulatory environment promoting technological innovation.
Marine Composites Market Product Landscape
The marine composites market offers a diverse range of products, including hulls, decks, bulkheads, and other structural components. Continuous innovation focuses on enhancing material properties, such as strength-to-weight ratio, impact resistance, and UV resistance. New resin systems and reinforcement fibers are constantly being developed to improve performance and reduce manufacturing costs. Key selling propositions include reduced weight, improved fuel efficiency, and enhanced durability compared to traditional materials.
Key Drivers, Barriers & Challenges in Marine Composites Market
Key Drivers:
- Growing demand for fuel-efficient and high-performance vessels.
- Increasing adoption of sustainable and eco-friendly materials.
- Technological advancements leading to improved material properties and cost reductions.
Challenges & Restraints:
- High initial investment costs associated with composite manufacturing.
- Skilled labor shortages impacting production efficiency.
- Potential supply chain disruptions affecting material availability and pricing.
Emerging Opportunities in Marine Composites Market
- Growing demand for sustainable and recyclable composite materials.
- Expanding applications of composites in smaller boat segments.
- Development of advanced manufacturing techniques, such as 3D printing, for customized composite components.
Growth Accelerators in the Marine Composites Market Industry
Strategic partnerships between material suppliers and boat manufacturers are accelerating market growth. Technological advancements in resin systems and fiber reinforcements are continuously enhancing the performance and cost-effectiveness of composite materials. Expansion into emerging markets with high growth potential, such as Asia-Pacific, is driving market expansion.
Key Players Shaping the Marine Composites Market Market
- Premier Composite Technologies
- GMS Composites
- Advanced Custom Manufacturing
- Owens Corning
- DuPont
- Hyosung
- Hexcel Corporation
- Gurit
- Airborne
- Toray Group (ZOLTEK Corporation)
Notable Milestones in Marine Composites Market Sector
- 2022-Q4: Launch of a new high-strength epoxy resin by Hexcel Corporation.
- 2023-Q1: Merger between two key players in the polymer matrix composite segment.
- 2024-Q3: Introduction of a novel 3D printing technique for composite hull manufacturing.
In-Depth Marine Composites Market Market Outlook
The marine composites market is poised for continued growth over the forecast period (2025-2033), driven by increasing demand, technological innovation, and favorable regulatory policies. Strategic investments in research and development, along with the adoption of sustainable manufacturing practices, will be crucial for long-term success in this dynamic market. The market presents significant opportunities for companies that can innovate and adapt to the evolving needs of the marine industry.
Marine Composites Market Segmentation
-
1. Composite Type
- 1.1. Metal Matrix Composites
- 1.2. Polymer Matrix Composites
- 1.3. Ceramic Matrix Composites
-
2. Resin Type
- 2.1. Epoxy
- 2.2. Polyester
- 2.3. Other Resin Types
-
3. Vessel Type
- 3.1. Sailboats
- 3.2. Cruise Ships
- 3.3. Power Boats
- 3.4. Other Vessel Types
Marine Composites Market Segmentation By Geography
-
1. Asia Pacific
- 1.1. China
- 1.2. India
- 1.3. Japan
- 1.4. South Korea
- 1.5. Rest of Asia Pacific
-
2. North America
- 2.1. United States
- 2.2. Canada
- 2.3. Mexico
-
3. Europe
- 3.1. Germany
- 3.2. United Kingdom
- 3.3. Italy
- 3.4. France
- 3.5. Rest of Europe
-
4. South America
- 4.1. Brazil
- 4.2. Argentina
- 4.3. Rest of South America
-
5. Middle East and Africa
- 5.1. Saudi Arabia
- 5.2. South Africa
- 5.3. Rest of Middle East and Africa
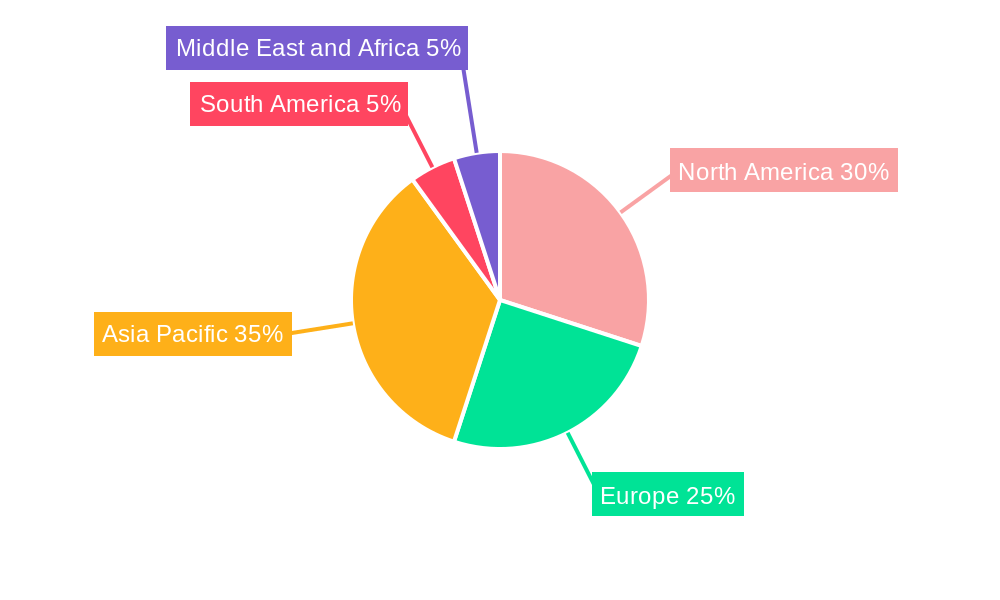
Marine Composites Market Regional Market Share
Geographic Coverage of Marine Composites Market
Marine Composites Market REPORT HIGHLIGHTS
| Aspects | Details |
|---|---|
| Study Period | 2020-2034 |
| Base Year | 2025 |
| Estimated Year | 2026 |
| Forecast Period | 2026-2034 |
| Historical Period | 2020-2025 |
| Growth Rate | CAGR of 5% from 2020-2034 |
| Segmentation |
|
Table of Contents
- 1. Introduction
- 1.1. Research Scope
- 1.2. Market Segmentation
- 1.3. Research Objective
- 1.4. Definitions and Assumptions
- 2. Executive Summary
- 2.1. Market Snapshot
- 3. Market Dynamics
- 3.1. Market Drivers
- 3.2. Market Restrains
- 3.3. Market Trends
- 3.4. Market Opportunities
- 4. Market Factor Analysis
- 4.1. Porters Five Forces
- 4.1.1. Bargaining Power of Suppliers
- 4.1.2. Bargaining Power of Buyers
- 4.1.3. Threat of New Entrants
- 4.1.4. Threat of Substitutes
- 4.1.5. Competitive Rivalry
- 4.2. PESTEL analysis
- 4.3. BCG Analysis
- 4.3.1. Stars (High Growth, High Market Share)
- 4.3.2. Cash Cows (Low Growth, High Market Share)
- 4.3.3. Question Mark (High Growth, Low Market Share)
- 4.3.4. Dogs (Low Growth, Low Market Share)
- 4.4. Ansoff Matrix Analysis
- 4.5. Supply Chain Analysis
- 4.6. Regulatory Landscape
- 4.7. Current Market Potential and Opportunity Assessment (TAM–SAM–SOM Framework)
- 4.8. VDR Analyst Note
- 4.1. Porters Five Forces
- 5. Market Analysis, Insights and Forecast 2021-2033
- 5.1. Market Analysis, Insights and Forecast - by Composite Type
- 5.1.1. Metal Matrix Composites
- 5.1.2. Polymer Matrix Composites
- 5.1.3. Ceramic Matrix Composites
- 5.2. Market Analysis, Insights and Forecast - by Resin Type
- 5.2.1. Epoxy
- 5.2.2. Polyester
- 5.2.3. Other Resin Types
- 5.3. Market Analysis, Insights and Forecast - by Vessel Type
- 5.3.1. Sailboats
- 5.3.2. Cruise Ships
- 5.3.3. Power Boats
- 5.3.4. Other Vessel Types
- 5.4. Market Analysis, Insights and Forecast - by Region
- 5.4.1. Asia Pacific
- 5.4.2. North America
- 5.4.3. Europe
- 5.4.4. South America
- 5.4.5. Middle East and Africa
- 5.1. Market Analysis, Insights and Forecast - by Composite Type
- 6. Global Marine Composites Market Analysis, Insights and Forecast, 2021-2033
- 6.1. Market Analysis, Insights and Forecast - by Composite Type
- 6.1.1. Metal Matrix Composites
- 6.1.2. Polymer Matrix Composites
- 6.1.3. Ceramic Matrix Composites
- 6.2. Market Analysis, Insights and Forecast - by Resin Type
- 6.2.1. Epoxy
- 6.2.2. Polyester
- 6.2.3. Other Resin Types
- 6.3. Market Analysis, Insights and Forecast - by Vessel Type
- 6.3.1. Sailboats
- 6.3.2. Cruise Ships
- 6.3.3. Power Boats
- 6.3.4. Other Vessel Types
- 6.1. Market Analysis, Insights and Forecast - by Composite Type
- 7. Asia Pacific Marine Composites Market Analysis, Insights and Forecast, 2021-2033
- 7.1. Market Analysis, Insights and Forecast - by Composite Type
- 7.1.1. Metal Matrix Composites
- 7.1.2. Polymer Matrix Composites
- 7.1.3. Ceramic Matrix Composites
- 7.2. Market Analysis, Insights and Forecast - by Resin Type
- 7.2.1. Epoxy
- 7.2.2. Polyester
- 7.2.3. Other Resin Types
- 7.3. Market Analysis, Insights and Forecast - by Vessel Type
- 7.3.1. Sailboats
- 7.3.2. Cruise Ships
- 7.3.3. Power Boats
- 7.3.4. Other Vessel Types
- 7.1. Market Analysis, Insights and Forecast - by Composite Type
- 8. North America Marine Composites Market Analysis, Insights and Forecast, 2021-2033
- 8.1. Market Analysis, Insights and Forecast - by Composite Type
- 8.1.1. Metal Matrix Composites
- 8.1.2. Polymer Matrix Composites
- 8.1.3. Ceramic Matrix Composites
- 8.2. Market Analysis, Insights and Forecast - by Resin Type
- 8.2.1. Epoxy
- 8.2.2. Polyester
- 8.2.3. Other Resin Types
- 8.3. Market Analysis, Insights and Forecast - by Vessel Type
- 8.3.1. Sailboats
- 8.3.2. Cruise Ships
- 8.3.3. Power Boats
- 8.3.4. Other Vessel Types
- 8.1. Market Analysis, Insights and Forecast - by Composite Type
- 9. Europe Marine Composites Market Analysis, Insights and Forecast, 2021-2033
- 9.1. Market Analysis, Insights and Forecast - by Composite Type
- 9.1.1. Metal Matrix Composites
- 9.1.2. Polymer Matrix Composites
- 9.1.3. Ceramic Matrix Composites
- 9.2. Market Analysis, Insights and Forecast - by Resin Type
- 9.2.1. Epoxy
- 9.2.2. Polyester
- 9.2.3. Other Resin Types
- 9.3. Market Analysis, Insights and Forecast - by Vessel Type
- 9.3.1. Sailboats
- 9.3.2. Cruise Ships
- 9.3.3. Power Boats
- 9.3.4. Other Vessel Types
- 9.1. Market Analysis, Insights and Forecast - by Composite Type
- 10. South America Marine Composites Market Analysis, Insights and Forecast, 2021-2033
- 10.1. Market Analysis, Insights and Forecast - by Composite Type
- 10.1.1. Metal Matrix Composites
- 10.1.2. Polymer Matrix Composites
- 10.1.3. Ceramic Matrix Composites
- 10.2. Market Analysis, Insights and Forecast - by Resin Type
- 10.2.1. Epoxy
- 10.2.2. Polyester
- 10.2.3. Other Resin Types
- 10.3. Market Analysis, Insights and Forecast - by Vessel Type
- 10.3.1. Sailboats
- 10.3.2. Cruise Ships
- 10.3.3. Power Boats
- 10.3.4. Other Vessel Types
- 10.1. Market Analysis, Insights and Forecast - by Composite Type
- 11. Middle East and Africa Marine Composites Market Analysis, Insights and Forecast, 2021-2033
- 11.1. Market Analysis, Insights and Forecast - by Composite Type
- 11.1.1. Metal Matrix Composites
- 11.1.2. Polymer Matrix Composites
- 11.1.3. Ceramic Matrix Composites
- 11.2. Market Analysis, Insights and Forecast - by Resin Type
- 11.2.1. Epoxy
- 11.2.2. Polyester
- 11.2.3. Other Resin Types
- 11.3. Market Analysis, Insights and Forecast - by Vessel Type
- 11.3.1. Sailboats
- 11.3.2. Cruise Ships
- 11.3.3. Power Boats
- 11.3.4. Other Vessel Types
- 11.1. Market Analysis, Insights and Forecast - by Composite Type
- 12. Competitive Analysis
- 12.1. Company Profiles
- 12.1.1 Premier Composite Technologies
- 12.1.1.1. Company Overview
- 12.1.1.2. Products
- 12.1.1.3. Company Financials
- 12.1.1.4. SWOT Analysis
- 12.1.2 GMS Composites
- 12.1.2.1. Company Overview
- 12.1.2.2. Products
- 12.1.2.3. Company Financials
- 12.1.2.4. SWOT Analysis
- 12.1.3 Advanced Custom Manufacturing
- 12.1.3.1. Company Overview
- 12.1.3.2. Products
- 12.1.3.3. Company Financials
- 12.1.3.4. SWOT Analysis
- 12.1.4 Owens Corning
- 12.1.4.1. Company Overview
- 12.1.4.2. Products
- 12.1.4.3. Company Financials
- 12.1.4.4. SWOT Analysis
- 12.1.5 DuPont
- 12.1.5.1. Company Overview
- 12.1.5.2. Products
- 12.1.5.3. Company Financials
- 12.1.5.4. SWOT Analysis
- 12.1.6 Hyosung
- 12.1.6.1. Company Overview
- 12.1.6.2. Products
- 12.1.6.3. Company Financials
- 12.1.6.4. SWOT Analysis
- 12.1.7 Hexcel Corporation
- 12.1.7.1. Company Overview
- 12.1.7.2. Products
- 12.1.7.3. Company Financials
- 12.1.7.4. SWOT Analysis
- 12.1.8 Gurit
- 12.1.8.1. Company Overview
- 12.1.8.2. Products
- 12.1.8.3. Company Financials
- 12.1.8.4. SWOT Analysis
- 12.1.9 Airborne
- 12.1.9.1. Company Overview
- 12.1.9.2. Products
- 12.1.9.3. Company Financials
- 12.1.9.4. SWOT Analysis
- 12.1.10 Toray Group (ZOLTEK Corporation)*List Not Exhaustive
- 12.1.10.1. Company Overview
- 12.1.10.2. Products
- 12.1.10.3. Company Financials
- 12.1.10.4. SWOT Analysis
- 12.1.1 Premier Composite Technologies
- 12.2. Market Entropy
- 12.2.1 Company's Key Areas Served
- 12.2.2 Recent Developments
- 12.3. Company Market Share Analysis 2025
- 12.3.1 Top 5 Companies Market Share Analysis
- 12.3.2 Top 3 Companies Market Share Analysis
- 12.4. List of Potential Customers
- 13. Research Methodology
List of Figures
- Figure 1: Global Marine Composites Market Revenue Breakdown (million, %) by Region 2025 & 2033
- Figure 2: Asia Pacific Marine Composites Market Revenue (million), by Composite Type 2025 & 2033
- Figure 3: Asia Pacific Marine Composites Market Revenue Share (%), by Composite Type 2025 & 2033
- Figure 4: Asia Pacific Marine Composites Market Revenue (million), by Resin Type 2025 & 2033
- Figure 5: Asia Pacific Marine Composites Market Revenue Share (%), by Resin Type 2025 & 2033
- Figure 6: Asia Pacific Marine Composites Market Revenue (million), by Vessel Type 2025 & 2033
- Figure 7: Asia Pacific Marine Composites Market Revenue Share (%), by Vessel Type 2025 & 2033
- Figure 8: Asia Pacific Marine Composites Market Revenue (million), by Country 2025 & 2033
- Figure 9: Asia Pacific Marine Composites Market Revenue Share (%), by Country 2025 & 2033
- Figure 10: North America Marine Composites Market Revenue (million), by Composite Type 2025 & 2033
- Figure 11: North America Marine Composites Market Revenue Share (%), by Composite Type 2025 & 2033
- Figure 12: North America Marine Composites Market Revenue (million), by Resin Type 2025 & 2033
- Figure 13: North America Marine Composites Market Revenue Share (%), by Resin Type 2025 & 2033
- Figure 14: North America Marine Composites Market Revenue (million), by Vessel Type 2025 & 2033
- Figure 15: North America Marine Composites Market Revenue Share (%), by Vessel Type 2025 & 2033
- Figure 16: North America Marine Composites Market Revenue (million), by Country 2025 & 2033
- Figure 17: North America Marine Composites Market Revenue Share (%), by Country 2025 & 2033
- Figure 18: Europe Marine Composites Market Revenue (million), by Composite Type 2025 & 2033
- Figure 19: Europe Marine Composites Market Revenue Share (%), by Composite Type 2025 & 2033
- Figure 20: Europe Marine Composites Market Revenue (million), by Resin Type 2025 & 2033
- Figure 21: Europe Marine Composites Market Revenue Share (%), by Resin Type 2025 & 2033
- Figure 22: Europe Marine Composites Market Revenue (million), by Vessel Type 2025 & 2033
- Figure 23: Europe Marine Composites Market Revenue Share (%), by Vessel Type 2025 & 2033
- Figure 24: Europe Marine Composites Market Revenue (million), by Country 2025 & 2033
- Figure 25: Europe Marine Composites Market Revenue Share (%), by Country 2025 & 2033
- Figure 26: South America Marine Composites Market Revenue (million), by Composite Type 2025 & 2033
- Figure 27: South America Marine Composites Market Revenue Share (%), by Composite Type 2025 & 2033
- Figure 28: South America Marine Composites Market Revenue (million), by Resin Type 2025 & 2033
- Figure 29: South America Marine Composites Market Revenue Share (%), by Resin Type 2025 & 2033
- Figure 30: South America Marine Composites Market Revenue (million), by Vessel Type 2025 & 2033
- Figure 31: South America Marine Composites Market Revenue Share (%), by Vessel Type 2025 & 2033
- Figure 32: South America Marine Composites Market Revenue (million), by Country 2025 & 2033
- Figure 33: South America Marine Composites Market Revenue Share (%), by Country 2025 & 2033
- Figure 34: Middle East and Africa Marine Composites Market Revenue (million), by Composite Type 2025 & 2033
- Figure 35: Middle East and Africa Marine Composites Market Revenue Share (%), by Composite Type 2025 & 2033
- Figure 36: Middle East and Africa Marine Composites Market Revenue (million), by Resin Type 2025 & 2033
- Figure 37: Middle East and Africa Marine Composites Market Revenue Share (%), by Resin Type 2025 & 2033
- Figure 38: Middle East and Africa Marine Composites Market Revenue (million), by Vessel Type 2025 & 2033
- Figure 39: Middle East and Africa Marine Composites Market Revenue Share (%), by Vessel Type 2025 & 2033
- Figure 40: Middle East and Africa Marine Composites Market Revenue (million), by Country 2025 & 2033
- Figure 41: Middle East and Africa Marine Composites Market Revenue Share (%), by Country 2025 & 2033
List of Tables
- Table 1: Global Marine Composites Market Revenue million Forecast, by Composite Type 2020 & 2033
- Table 2: Global Marine Composites Market Revenue million Forecast, by Resin Type 2020 & 2033
- Table 3: Global Marine Composites Market Revenue million Forecast, by Vessel Type 2020 & 2033
- Table 4: Global Marine Composites Market Revenue million Forecast, by Region 2020 & 2033
- Table 5: Global Marine Composites Market Revenue million Forecast, by Composite Type 2020 & 2033
- Table 6: Global Marine Composites Market Revenue million Forecast, by Resin Type 2020 & 2033
- Table 7: Global Marine Composites Market Revenue million Forecast, by Vessel Type 2020 & 2033
- Table 8: Global Marine Composites Market Revenue million Forecast, by Country 2020 & 2033
- Table 9: China Marine Composites Market Revenue (million) Forecast, by Application 2020 & 2033
- Table 10: India Marine Composites Market Revenue (million) Forecast, by Application 2020 & 2033
- Table 11: Japan Marine Composites Market Revenue (million) Forecast, by Application 2020 & 2033
- Table 12: South Korea Marine Composites Market Revenue (million) Forecast, by Application 2020 & 2033
- Table 13: Rest of Asia Pacific Marine Composites Market Revenue (million) Forecast, by Application 2020 & 2033
- Table 14: Global Marine Composites Market Revenue million Forecast, by Composite Type 2020 & 2033
- Table 15: Global Marine Composites Market Revenue million Forecast, by Resin Type 2020 & 2033
- Table 16: Global Marine Composites Market Revenue million Forecast, by Vessel Type 2020 & 2033
- Table 17: Global Marine Composites Market Revenue million Forecast, by Country 2020 & 2033
- Table 18: United States Marine Composites Market Revenue (million) Forecast, by Application 2020 & 2033
- Table 19: Canada Marine Composites Market Revenue (million) Forecast, by Application 2020 & 2033
- Table 20: Mexico Marine Composites Market Revenue (million) Forecast, by Application 2020 & 2033
- Table 21: Global Marine Composites Market Revenue million Forecast, by Composite Type 2020 & 2033
- Table 22: Global Marine Composites Market Revenue million Forecast, by Resin Type 2020 & 2033
- Table 23: Global Marine Composites Market Revenue million Forecast, by Vessel Type 2020 & 2033
- Table 24: Global Marine Composites Market Revenue million Forecast, by Country 2020 & 2033
- Table 25: Germany Marine Composites Market Revenue (million) Forecast, by Application 2020 & 2033
- Table 26: United Kingdom Marine Composites Market Revenue (million) Forecast, by Application 2020 & 2033
- Table 27: Italy Marine Composites Market Revenue (million) Forecast, by Application 2020 & 2033
- Table 28: France Marine Composites Market Revenue (million) Forecast, by Application 2020 & 2033
- Table 29: Rest of Europe Marine Composites Market Revenue (million) Forecast, by Application 2020 & 2033
- Table 30: Global Marine Composites Market Revenue million Forecast, by Composite Type 2020 & 2033
- Table 31: Global Marine Composites Market Revenue million Forecast, by Resin Type 2020 & 2033
- Table 32: Global Marine Composites Market Revenue million Forecast, by Vessel Type 2020 & 2033
- Table 33: Global Marine Composites Market Revenue million Forecast, by Country 2020 & 2033
- Table 34: Brazil Marine Composites Market Revenue (million) Forecast, by Application 2020 & 2033
- Table 35: Argentina Marine Composites Market Revenue (million) Forecast, by Application 2020 & 2033
- Table 36: Rest of South America Marine Composites Market Revenue (million) Forecast, by Application 2020 & 2033
- Table 37: Global Marine Composites Market Revenue million Forecast, by Composite Type 2020 & 2033
- Table 38: Global Marine Composites Market Revenue million Forecast, by Resin Type 2020 & 2033
- Table 39: Global Marine Composites Market Revenue million Forecast, by Vessel Type 2020 & 2033
- Table 40: Global Marine Composites Market Revenue million Forecast, by Country 2020 & 2033
- Table 41: Saudi Arabia Marine Composites Market Revenue (million) Forecast, by Application 2020 & 2033
- Table 42: South Africa Marine Composites Market Revenue (million) Forecast, by Application 2020 & 2033
- Table 43: Rest of Middle East and Africa Marine Composites Market Revenue (million) Forecast, by Application 2020 & 2033
Frequently Asked Questions
1. What is the projected Compound Annual Growth Rate (CAGR) of the Marine Composites Market?
The projected CAGR is approximately 5%.
2. Which companies are prominent players in the Marine Composites Market?
Key companies in the market include Premier Composite Technologies, GMS Composites, Advanced Custom Manufacturing, Owens Corning, DuPont, Hyosung, Hexcel Corporation, Gurit, Airborne, Toray Group (ZOLTEK Corporation)*List Not Exhaustive.
3. What are the main segments of the Marine Composites Market?
The market segments include Composite Type, Resin Type, Vessel Type.
4. Can you provide details about the market size?
The market size is estimated to be USD 1341 million as of 2022.
5. What are some drivers contributing to market growth?
; Increasing Production of Leisure Boats and Cruise Ships; Other Drivers.
6. What are the notable trends driving market growth?
Increasing Demand for Cruise Ships.
7. Are there any restraints impacting market growth?
; Unfavorable Conditions Arising Due to COVID-19 Outbreak; Other Restraints.
8. Can you provide examples of recent developments in the market?
N/A
9. What pricing options are available for accessing the report?
Pricing options include single-user, multi-user, and enterprise licenses priced at USD 4750, USD 5250, and USD 8750 respectively.
10. Is the market size provided in terms of value or volume?
The market size is provided in terms of value, measured in million.
11. Are there any specific market keywords associated with the report?
Yes, the market keyword associated with the report is "Marine Composites Market," which aids in identifying and referencing the specific market segment covered.
12. How do I determine which pricing option suits my needs best?
The pricing options vary based on user requirements and access needs. Individual users may opt for single-user licenses, while businesses requiring broader access may choose multi-user or enterprise licenses for cost-effective access to the report.
13. Are there any additional resources or data provided in the Marine Composites Market report?
While the report offers comprehensive insights, it's advisable to review the specific contents or supplementary materials provided to ascertain if additional resources or data are available.
14. How can I stay updated on further developments or reports in the Marine Composites Market?
To stay informed about further developments, trends, and reports in the Marine Composites Market, consider subscribing to industry newsletters, following relevant companies and organizations, or regularly checking reputable industry news sources and publications.
Methodology
Step 1 - Identification of Relevant Samples Size from Population Database


Step 2 - Approaches for Defining Global Market Size (Value, Volume* & Price*)

Note*: In applicable scenarios
Step 3 - Data Sources
Primary Research
- Web Analytics
- Survey Reports
- Research Institute
- Latest Research Reports
- Opinion Leaders
Secondary Research
- Annual Reports
- White Paper
- Latest Press Release
- Industry Association
- Paid Database
- Investor Presentations

Step 4 - Data Triangulation
Involves using different sources of information in order to increase the validity of a study
These sources are likely to be stakeholders in a program - participants, other researchers, program staff, other community members, and so on.
Then we put all data in single framework & apply various statistical tools to find out the dynamic on the market.
During the analysis stage, feedback from the stakeholder groups would be compared to determine areas of agreement as well as areas of divergence