
Key Insights
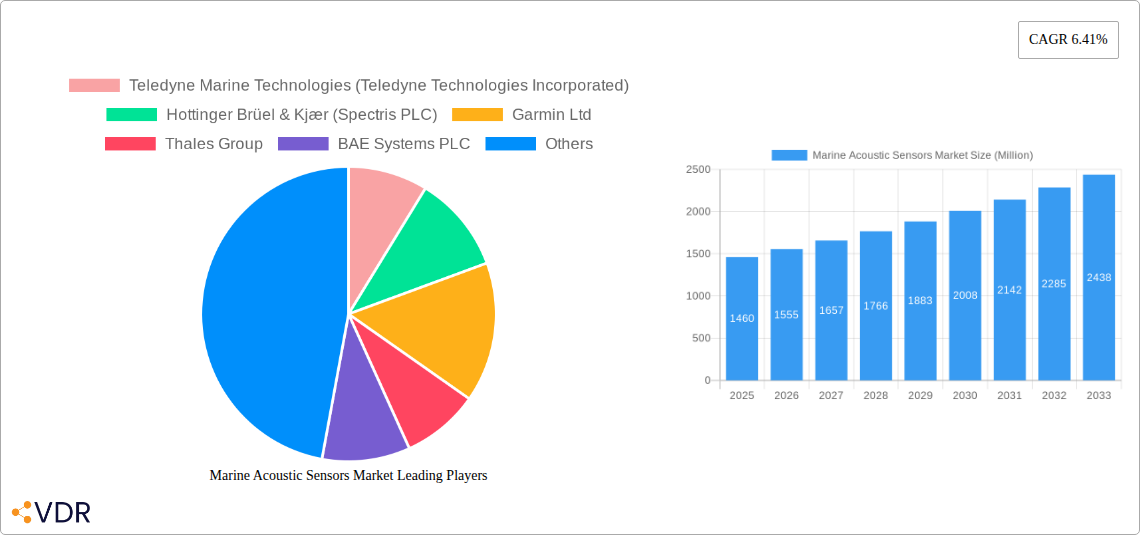
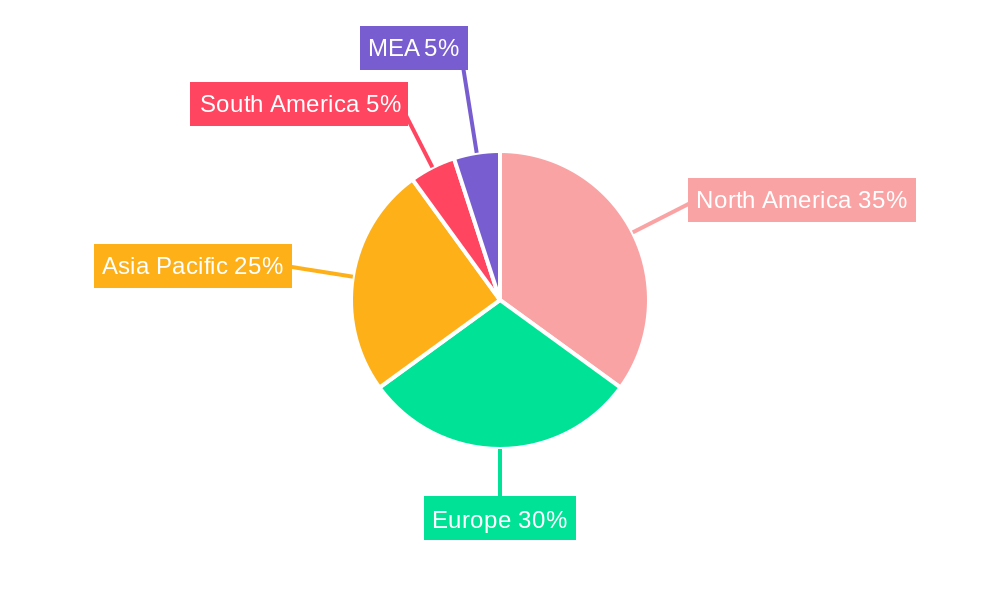
The marine acoustic sensors market, valued at $1.46 billion in 2025, is projected to experience robust growth, driven by increasing demand for advanced underwater surveillance and exploration technologies. A Compound Annual Growth Rate (CAGR) of 6.41% from 2025 to 2033 indicates a significant expansion, fueled by several key factors. Firstly, the rising adoption of autonomous underwater vehicles (AUVs) and remotely operated vehicles (ROVs) in various applications, including oceanographic research, defense, and offshore oil and gas exploration, is significantly boosting market growth. Secondly, advancements in sensor technology, leading to enhanced accuracy, resolution, and range capabilities, are driving the demand for sophisticated marine acoustic sensors. Furthermore, stringent regulations for maritime safety and environmental monitoring are creating a compelling need for reliable and effective acoustic monitoring solutions. The market is segmented by product type, encompassing hydrophones, underwater transducers, acoustic towed arrays, and side-scan sonar, each catering to specific applications and contributing to the overall market size. Geographically, North America and Europe currently hold significant market shares, but the Asia-Pacific region is expected to witness rapid growth in the coming years due to increasing investments in infrastructure development and marine research within this region.
The competitive landscape is characterized by the presence of both established players and emerging companies. Key players like Teledyne Marine Technologies, Hottinger Brüel & Kjær, and Garmin Ltd are leveraging their expertise and technological advancements to consolidate their market positions. However, the market also presents opportunities for smaller, specialized companies focusing on niche applications and innovative sensor technologies. The restraints to market growth are likely to include high initial investment costs for advanced systems and the technical expertise required for installation and operation. Nevertheless, ongoing technological advancements and the increasing demand for precise underwater data are expected to offset these challenges, leading to sustained expansion of the marine acoustic sensors market throughout the forecast period.
This comprehensive report provides an in-depth analysis of the Marine Acoustic Sensors Market, encompassing market dynamics, growth trends, regional analysis, product landscape, key players, and future outlook. The report covers the period from 2019 to 2033, with a base year of 2025 and a forecast period of 2025-2033. The parent market is the broader oceanographic equipment market, while the child market focuses specifically on acoustic sensing technologies. This report is invaluable for industry professionals, investors, and researchers seeking a complete understanding of this evolving sector. The market size is estimated at xx Million units in 2025 and is projected to reach xx Million units by 2033.
Marine Acoustic Sensors Market Dynamics & Structure
The Marine Acoustic Sensors market is characterized by a moderately concentrated structure, with several key players holding significant market share. Technological innovation, particularly in areas such as improved signal processing and miniaturization, is a primary growth driver. Stringent regulatory frameworks concerning environmental impact, particularly regarding marine life, influence product development and deployment. Competitive pressures stem from both established players and emerging companies introducing innovative solutions. End-user demographics include government agencies, research institutions, defense organizations, and the energy sector (oil & gas, offshore wind). M&A activity has been moderate, with a total of xx deals recorded between 2019 and 2024, representing a xx% market share shift in the period.
- Market Concentration: Moderately concentrated, with top 5 players holding approximately xx% market share in 2024.
- Technological Innovation: Focus on higher sensitivity, lower power consumption, and improved signal processing algorithms.
- Regulatory Landscape: Increasingly stringent regulations concerning marine mammal protection and environmental impact assessments.
- Competitive Substitutes: Limited direct substitutes, but alternative sensing technologies (e.g., optical sensors) pose indirect competition.
- End-User Demographics: Government agencies (xx%), Research institutions (xx%), Defense (xx%), Energy (Oil & Gas, Offshore Wind - xx%).
- M&A Trends: xx M&A deals between 2019-2024, leading to xx% market share consolidation. Innovation barriers include high R&D costs and the need for specialized expertise.
Marine Acoustic Sensors Market Growth Trends & Insights
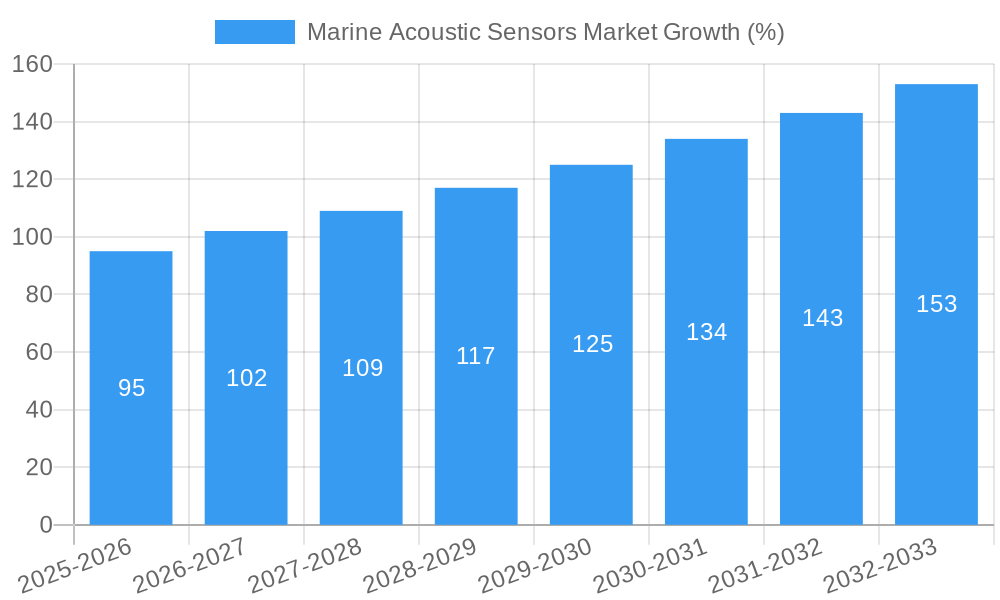
The Marine Acoustic Sensors market has witnessed steady growth over the historical period (2019-2024), with a CAGR of xx%. This growth is driven by increasing demand for underwater surveillance, offshore exploration activities, and scientific research. The adoption rate of advanced acoustic sensors is also increasing, driven by improved performance and reduced costs. Technological disruptions, such as the introduction of AI-powered signal processing, are further accelerating market growth. Consumer behavior shifts towards environmentally conscious practices have increased the demand for sensors with minimized environmental impact. Market penetration is expected to rise to xx% by 2033.
Dominant Regions, Countries, or Segments in Marine Acoustic Sensors Market
North America currently dominates the Marine Acoustic Sensors market, driven by strong government spending on defense and research activities, along with a robust offshore energy sector. Europe follows closely, with significant contributions from both government and private sector initiatives. The Asia-Pacific region shows strong potential for growth, fueled by increasing infrastructure development and rising investments in offshore wind energy. Within product segments, Hydrophones and Underwater Transducers account for the largest market share, driven by their broad applicability across various applications.
- North America: Strong government spending on defense and research, robust offshore energy sector.
- Europe: Significant government and private sector investments in marine research and offshore development.
- Asia-Pacific: Rapid growth driven by increasing infrastructure development and investments in offshore wind energy.
- By Product: Hydrophones (xx% market share), Underwater Transducers (xx%), Acoustic Towed Array (xx%), Side-scan Sonar (xx%).
- Key Drivers: Government funding for research, rising offshore energy investments, increasing focus on marine environmental monitoring.
Marine Acoustic Sensors Market Product Landscape
The market features a diverse range of acoustic sensors, each tailored to specific applications. Hydrophones provide high sensitivity for detecting faint underwater sounds, while underwater transducers offer versatility for both transmission and reception. Acoustic towed arrays are used for long-range detection and surveillance, while side-scan sonars provide high-resolution imagery of the seabed. Recent innovations focus on miniaturization, improved signal processing, and enhanced noise reduction capabilities. Unique selling propositions center on improved accuracy, reliability, and reduced power consumption.
Key Drivers, Barriers & Challenges in Marine Acoustic Sensors Market
Key Drivers:
- Growing demand for underwater surveillance and security.
- Increasing offshore oil & gas and renewable energy exploration activities.
- Expansion of scientific research and oceanographic studies.
- Advancements in signal processing and sensor technologies.
Challenges & Restraints:
- High initial investment costs for advanced sensor systems.
- Stringent environmental regulations related to marine mammal protection.
- Intense competition from established and emerging players.
- Supply chain complexities and potential disruptions. This has resulted in a xx% increase in sensor costs from 2021-2024.
Emerging Opportunities in Marine Acoustic Sensors Market
- Untapped potential in developing economies with increasing investment in maritime infrastructure.
- Growing demand for sensors with enhanced environmental monitoring capabilities.
- Integration of AI and machine learning for improved data analysis and decision-making.
- Development of specialized sensors for specific applications (e.g., underwater communication, seabed mapping).
Growth Accelerators in the Marine Acoustic Sensors Market Industry
Technological advancements, particularly in AI-powered signal processing and miniaturization, are driving market expansion. Strategic partnerships between sensor manufacturers and end-users accelerate innovation and market penetration. Government initiatives promoting oceanographic research and maritime security provide additional momentum. Expansion into new applications, such as underwater archaeology and marine habitat monitoring, further fuels market growth.
Key Players Shaping the Marine Acoustic Sensors Market Market
- Teledyne Marine Technologies (Teledyne Technologies Incorporated)
- Hottinger Brüel & Kjær (Spectris PLC)
- Garmin Ltd
- Thales Group
- BAE Systems PLC
- L3harris Technologies Inc
- Cobham Ultra Seniorco S à R l
- CTS Corporation
- Ocean Sonics Ltd
- Geospectrum Technologies Inc
Notable Milestones in Marine Acoustic Sensors Market Sector
- June 2023: RPS presented Neptune, a predictive algorithm for marine mammal vocalization detection, enhancing environmental protection during offshore activities.
- January 2023: Launch of the 'Jaywun' marine research vessel in the UAE, boosting national and global marine science capabilities.
In-Depth Marine Acoustic Sensors Market Market Outlook
The Marine Acoustic Sensors market is poised for significant growth over the forecast period (2025-2033), driven by technological innovation, increasing demand from various sectors, and supportive government policies. Strategic partnerships and expansion into new application areas will further accelerate market expansion. The market offers substantial opportunities for both established players and new entrants, particularly those focusing on environmentally conscious solutions and advanced data analytics capabilities.
Marine Acoustic Sensors Market Segmentation
-
1. Product
- 1.1. Hydrophones
- 1.2. Underwater Transducer
- 1.3. Acoustic Towed Array
- 1.4. Side-scan Sonar
-
2. Application
- 2.1. Offshore Oil & Gas
- 2.2. Defense
- 2.3. Oceanography
- 2.4. Fisheries
-
3. Geography
- 3.1. North America
- 3.2. Europe
- 3.3. Asia-Pacific
- 3.4. Rest of the World
Marine Acoustic Sensors Market Segmentation By Geography
- 1. North America
- 2. Europe
- 3. Asia
- 4. Australia and New Zealand
- 5. Latin America
Marine Acoustic Sensors Market REPORT HIGHLIGHTS
| Aspects | Details |
|---|---|
| Study Period | 2019-2033 |
| Base Year | 2024 |
| Estimated Year | 2025 |
| Forecast Period | 2025-2033 |
| Historical Period | 2019-2024 |
| Growth Rate | CAGR of 6.41% from 2019-2033 |
| Segmentation |
|
Table of Contents
- 1. Introduction
- 1.1. Research Scope
- 1.2. Market Segmentation
- 1.3. Research Methodology
- 1.4. Definitions and Assumptions
- 2. Executive Summary
- 2.1. Introduction
- 3. Market Dynamics
- 3.1. Introduction
- 3.2. Market Drivers
- 3.2.1. Growing Deployment of Acoustic Navigation for Underwater Positioning; Rising Defense Spending in Several Countries
- 3.3. Market Restrains
- 3.3.1. High Initial Setup and Installation Cost; Limited Product variety and Capacity
- 3.4. Market Trends
- 3.4.1. Underwater Transducer to Hold Major Share in the Product Segment
- 4. Market Factor Analysis
- 4.1. Porters Five Forces
- 4.2. Supply/Value Chain
- 4.3. PESTEL analysis
- 4.4. Market Entropy
- 4.5. Patent/Trademark Analysis
- 5. Global Marine Acoustic Sensors Market Analysis, Insights and Forecast, 2019-2031
- 5.1. Market Analysis, Insights and Forecast - by Product
- 5.1.1. Hydrophones
- 5.1.2. Underwater Transducer
- 5.1.3. Acoustic Towed Array
- 5.1.4. Side-scan Sonar
- 5.2. Market Analysis, Insights and Forecast - by Application
- 5.2.1. Offshore Oil & Gas
- 5.2.2. Defense
- 5.2.3. Oceanography
- 5.2.4. Fisheries
- 5.3. Market Analysis, Insights and Forecast - by Geography
- 5.3.1. North America
- 5.3.2. Europe
- 5.3.3. Asia-Pacific
- 5.3.4. Rest of the World
- 5.4. Market Analysis, Insights and Forecast - by Region
- 5.4.1. North America
- 5.4.2. Europe
- 5.4.3. Asia
- 5.4.4. Australia and New Zealand
- 5.4.5. Latin America
- 5.1. Market Analysis, Insights and Forecast - by Product
- 6. North America Marine Acoustic Sensors Market Analysis, Insights and Forecast, 2019-2031
- 6.1. Market Analysis, Insights and Forecast - by Product
- 6.1.1. Hydrophones
- 6.1.2. Underwater Transducer
- 6.1.3. Acoustic Towed Array
- 6.1.4. Side-scan Sonar
- 6.2. Market Analysis, Insights and Forecast - by Application
- 6.2.1. Offshore Oil & Gas
- 6.2.2. Defense
- 6.2.3. Oceanography
- 6.2.4. Fisheries
- 6.3. Market Analysis, Insights and Forecast - by Geography
- 6.3.1. North America
- 6.3.2. Europe
- 6.3.3. Asia-Pacific
- 6.3.4. Rest of the World
- 6.1. Market Analysis, Insights and Forecast - by Product
- 7. Europe Marine Acoustic Sensors Market Analysis, Insights and Forecast, 2019-2031
- 7.1. Market Analysis, Insights and Forecast - by Product
- 7.1.1. Hydrophones
- 7.1.2. Underwater Transducer
- 7.1.3. Acoustic Towed Array
- 7.1.4. Side-scan Sonar
- 7.2. Market Analysis, Insights and Forecast - by Application
- 7.2.1. Offshore Oil & Gas
- 7.2.2. Defense
- 7.2.3. Oceanography
- 7.2.4. Fisheries
- 7.3. Market Analysis, Insights and Forecast - by Geography
- 7.3.1. North America
- 7.3.2. Europe
- 7.3.3. Asia-Pacific
- 7.3.4. Rest of the World
- 7.1. Market Analysis, Insights and Forecast - by Product
- 8. Asia Marine Acoustic Sensors Market Analysis, Insights and Forecast, 2019-2031
- 8.1. Market Analysis, Insights and Forecast - by Product
- 8.1.1. Hydrophones
- 8.1.2. Underwater Transducer
- 8.1.3. Acoustic Towed Array
- 8.1.4. Side-scan Sonar
- 8.2. Market Analysis, Insights and Forecast - by Application
- 8.2.1. Offshore Oil & Gas
- 8.2.2. Defense
- 8.2.3. Oceanography
- 8.2.4. Fisheries
- 8.3. Market Analysis, Insights and Forecast - by Geography
- 8.3.1. North America
- 8.3.2. Europe
- 8.3.3. Asia-Pacific
- 8.3.4. Rest of the World
- 8.1. Market Analysis, Insights and Forecast - by Product
- 9. Australia and New Zealand Marine Acoustic Sensors Market Analysis, Insights and Forecast, 2019-2031
- 9.1. Market Analysis, Insights and Forecast - by Product
- 9.1.1. Hydrophones
- 9.1.2. Underwater Transducer
- 9.1.3. Acoustic Towed Array
- 9.1.4. Side-scan Sonar
- 9.2. Market Analysis, Insights and Forecast - by Application
- 9.2.1. Offshore Oil & Gas
- 9.2.2. Defense
- 9.2.3. Oceanography
- 9.2.4. Fisheries
- 9.3. Market Analysis, Insights and Forecast - by Geography
- 9.3.1. North America
- 9.3.2. Europe
- 9.3.3. Asia-Pacific
- 9.3.4. Rest of the World
- 9.1. Market Analysis, Insights and Forecast - by Product
- 10. Latin America Marine Acoustic Sensors Market Analysis, Insights and Forecast, 2019-2031
- 10.1. Market Analysis, Insights and Forecast - by Product
- 10.1.1. Hydrophones
- 10.1.2. Underwater Transducer
- 10.1.3. Acoustic Towed Array
- 10.1.4. Side-scan Sonar
- 10.2. Market Analysis, Insights and Forecast - by Application
- 10.2.1. Offshore Oil & Gas
- 10.2.2. Defense
- 10.2.3. Oceanography
- 10.2.4. Fisheries
- 10.3. Market Analysis, Insights and Forecast - by Geography
- 10.3.1. North America
- 10.3.2. Europe
- 10.3.3. Asia-Pacific
- 10.3.4. Rest of the World
- 10.1. Market Analysis, Insights and Forecast - by Product
- 11. North America Marine Acoustic Sensors Market Analysis, Insights and Forecast, 2019-2031
- 11.1. Market Analysis, Insights and Forecast - By Country/Sub-region
- 11.1.1 United States
- 11.1.2 Canada
- 11.1.3 Mexico
- 12. Europe Marine Acoustic Sensors Market Analysis, Insights and Forecast, 2019-2031
- 12.1. Market Analysis, Insights and Forecast - By Country/Sub-region
- 12.1.1 Germany
- 12.1.2 United Kingdom
- 12.1.3 France
- 12.1.4 Spain
- 12.1.5 Italy
- 12.1.6 Spain
- 12.1.7 Belgium
- 12.1.8 Netherland
- 12.1.9 Nordics
- 12.1.10 Rest of Europe
- 13. Asia Pacific Marine Acoustic Sensors Market Analysis, Insights and Forecast, 2019-2031
- 13.1. Market Analysis, Insights and Forecast - By Country/Sub-region
- 13.1.1 China
- 13.1.2 Japan
- 13.1.3 India
- 13.1.4 South Korea
- 13.1.5 Southeast Asia
- 13.1.6 Australia
- 13.1.7 Indonesia
- 13.1.8 Phillipes
- 13.1.9 Singapore
- 13.1.10 Thailandc
- 13.1.11 Rest of Asia Pacific
- 14. South America Marine Acoustic Sensors Market Analysis, Insights and Forecast, 2019-2031
- 14.1. Market Analysis, Insights and Forecast - By Country/Sub-region
- 14.1.1 Brazil
- 14.1.2 Argentina
- 14.1.3 Peru
- 14.1.4 Chile
- 14.1.5 Colombia
- 14.1.6 Ecuador
- 14.1.7 Venezuela
- 14.1.8 Rest of South America
- 15. North America Marine Acoustic Sensors Market Analysis, Insights and Forecast, 2019-2031
- 15.1. Market Analysis, Insights and Forecast - By Country/Sub-region
- 15.1.1 United States
- 15.1.2 Canada
- 15.1.3 Mexico
- 16. MEA Marine Acoustic Sensors Market Analysis, Insights and Forecast, 2019-2031
- 16.1. Market Analysis, Insights and Forecast - By Country/Sub-region
- 16.1.1 United Arab Emirates
- 16.1.2 Saudi Arabia
- 16.1.3 South Africa
- 16.1.4 Rest of Middle East and Africa
- 17. Competitive Analysis
- 17.1. Global Market Share Analysis 2024
- 17.2. Company Profiles
- 17.2.1 Teledyne Marine Technologies (Teledyne Technologies Incorporated)
- 17.2.1.1. Overview
- 17.2.1.2. Products
- 17.2.1.3. SWOT Analysis
- 17.2.1.4. Recent Developments
- 17.2.1.5. Financials (Based on Availability)
- 17.2.2 Hottinger Brüel & Kjær (Spectris PLC)
- 17.2.2.1. Overview
- 17.2.2.2. Products
- 17.2.2.3. SWOT Analysis
- 17.2.2.4. Recent Developments
- 17.2.2.5. Financials (Based on Availability)
- 17.2.3 Garmin Ltd
- 17.2.3.1. Overview
- 17.2.3.2. Products
- 17.2.3.3. SWOT Analysis
- 17.2.3.4. Recent Developments
- 17.2.3.5. Financials (Based on Availability)
- 17.2.4 Thales Group
- 17.2.4.1. Overview
- 17.2.4.2. Products
- 17.2.4.3. SWOT Analysis
- 17.2.4.4. Recent Developments
- 17.2.4.5. Financials (Based on Availability)
- 17.2.5 BAE Systems PLC
- 17.2.5.1. Overview
- 17.2.5.2. Products
- 17.2.5.3. SWOT Analysis
- 17.2.5.4. Recent Developments
- 17.2.5.5. Financials (Based on Availability)
- 17.2.6 L3harris Technologies Inc
- 17.2.6.1. Overview
- 17.2.6.2. Products
- 17.2.6.3. SWOT Analysis
- 17.2.6.4. Recent Developments
- 17.2.6.5. Financials (Based on Availability)
- 17.2.7 Cobham Ultra Seniorco S à R l
- 17.2.7.1. Overview
- 17.2.7.2. Products
- 17.2.7.3. SWOT Analysis
- 17.2.7.4. Recent Developments
- 17.2.7.5. Financials (Based on Availability)
- 17.2.8 CTS Corporatio
- 17.2.8.1. Overview
- 17.2.8.2. Products
- 17.2.8.3. SWOT Analysis
- 17.2.8.4. Recent Developments
- 17.2.8.5. Financials (Based on Availability)
- 17.2.9 Ocean Sonics Ltd
- 17.2.9.1. Overview
- 17.2.9.2. Products
- 17.2.9.3. SWOT Analysis
- 17.2.9.4. Recent Developments
- 17.2.9.5. Financials (Based on Availability)
- 17.2.10 Geospectrum Technologies Inc
- 17.2.10.1. Overview
- 17.2.10.2. Products
- 17.2.10.3. SWOT Analysis
- 17.2.10.4. Recent Developments
- 17.2.10.5. Financials (Based on Availability)
- 17.2.1 Teledyne Marine Technologies (Teledyne Technologies Incorporated)
List of Figures
- Figure 1: Global Marine Acoustic Sensors Market Revenue Breakdown (Million, %) by Region 2024 & 2032
- Figure 2: Global Marine Acoustic Sensors Market Volume Breakdown (K Unit, %) by Region 2024 & 2032
- Figure 3: North America Marine Acoustic Sensors Market Revenue (Million), by Country 2024 & 2032
- Figure 4: North America Marine Acoustic Sensors Market Volume (K Unit), by Country 2024 & 2032
- Figure 5: North America Marine Acoustic Sensors Market Revenue Share (%), by Country 2024 & 2032
- Figure 6: North America Marine Acoustic Sensors Market Volume Share (%), by Country 2024 & 2032
- Figure 7: Europe Marine Acoustic Sensors Market Revenue (Million), by Country 2024 & 2032
- Figure 8: Europe Marine Acoustic Sensors Market Volume (K Unit), by Country 2024 & 2032
- Figure 9: Europe Marine Acoustic Sensors Market Revenue Share (%), by Country 2024 & 2032
- Figure 10: Europe Marine Acoustic Sensors Market Volume Share (%), by Country 2024 & 2032
- Figure 11: Asia Pacific Marine Acoustic Sensors Market Revenue (Million), by Country 2024 & 2032
- Figure 12: Asia Pacific Marine Acoustic Sensors Market Volume (K Unit), by Country 2024 & 2032
- Figure 13: Asia Pacific Marine Acoustic Sensors Market Revenue Share (%), by Country 2024 & 2032
- Figure 14: Asia Pacific Marine Acoustic Sensors Market Volume Share (%), by Country 2024 & 2032
- Figure 15: South America Marine Acoustic Sensors Market Revenue (Million), by Country 2024 & 2032
- Figure 16: South America Marine Acoustic Sensors Market Volume (K Unit), by Country 2024 & 2032
- Figure 17: South America Marine Acoustic Sensors Market Revenue Share (%), by Country 2024 & 2032
- Figure 18: South America Marine Acoustic Sensors Market Volume Share (%), by Country 2024 & 2032
- Figure 19: North America Marine Acoustic Sensors Market Revenue (Million), by Country 2024 & 2032
- Figure 20: North America Marine Acoustic Sensors Market Volume (K Unit), by Country 2024 & 2032
- Figure 21: North America Marine Acoustic Sensors Market Revenue Share (%), by Country 2024 & 2032
- Figure 22: North America Marine Acoustic Sensors Market Volume Share (%), by Country 2024 & 2032
- Figure 23: MEA Marine Acoustic Sensors Market Revenue (Million), by Country 2024 & 2032
- Figure 24: MEA Marine Acoustic Sensors Market Volume (K Unit), by Country 2024 & 2032
- Figure 25: MEA Marine Acoustic Sensors Market Revenue Share (%), by Country 2024 & 2032
- Figure 26: MEA Marine Acoustic Sensors Market Volume Share (%), by Country 2024 & 2032
- Figure 27: North America Marine Acoustic Sensors Market Revenue (Million), by Product 2024 & 2032
- Figure 28: North America Marine Acoustic Sensors Market Volume (K Unit), by Product 2024 & 2032
- Figure 29: North America Marine Acoustic Sensors Market Revenue Share (%), by Product 2024 & 2032
- Figure 30: North America Marine Acoustic Sensors Market Volume Share (%), by Product 2024 & 2032
- Figure 31: North America Marine Acoustic Sensors Market Revenue (Million), by Application 2024 & 2032
- Figure 32: North America Marine Acoustic Sensors Market Volume (K Unit), by Application 2024 & 2032
- Figure 33: North America Marine Acoustic Sensors Market Revenue Share (%), by Application 2024 & 2032
- Figure 34: North America Marine Acoustic Sensors Market Volume Share (%), by Application 2024 & 2032
- Figure 35: North America Marine Acoustic Sensors Market Revenue (Million), by Geography 2024 & 2032
- Figure 36: North America Marine Acoustic Sensors Market Volume (K Unit), by Geography 2024 & 2032
- Figure 37: North America Marine Acoustic Sensors Market Revenue Share (%), by Geography 2024 & 2032
- Figure 38: North America Marine Acoustic Sensors Market Volume Share (%), by Geography 2024 & 2032
- Figure 39: North America Marine Acoustic Sensors Market Revenue (Million), by Country 2024 & 2032
- Figure 40: North America Marine Acoustic Sensors Market Volume (K Unit), by Country 2024 & 2032
- Figure 41: North America Marine Acoustic Sensors Market Revenue Share (%), by Country 2024 & 2032
- Figure 42: North America Marine Acoustic Sensors Market Volume Share (%), by Country 2024 & 2032
- Figure 43: Europe Marine Acoustic Sensors Market Revenue (Million), by Product 2024 & 2032
- Figure 44: Europe Marine Acoustic Sensors Market Volume (K Unit), by Product 2024 & 2032
- Figure 45: Europe Marine Acoustic Sensors Market Revenue Share (%), by Product 2024 & 2032
- Figure 46: Europe Marine Acoustic Sensors Market Volume Share (%), by Product 2024 & 2032
- Figure 47: Europe Marine Acoustic Sensors Market Revenue (Million), by Application 2024 & 2032
- Figure 48: Europe Marine Acoustic Sensors Market Volume (K Unit), by Application 2024 & 2032
- Figure 49: Europe Marine Acoustic Sensors Market Revenue Share (%), by Application 2024 & 2032
- Figure 50: Europe Marine Acoustic Sensors Market Volume Share (%), by Application 2024 & 2032
- Figure 51: Europe Marine Acoustic Sensors Market Revenue (Million), by Geography 2024 & 2032
- Figure 52: Europe Marine Acoustic Sensors Market Volume (K Unit), by Geography 2024 & 2032
- Figure 53: Europe Marine Acoustic Sensors Market Revenue Share (%), by Geography 2024 & 2032
- Figure 54: Europe Marine Acoustic Sensors Market Volume Share (%), by Geography 2024 & 2032
- Figure 55: Europe Marine Acoustic Sensors Market Revenue (Million), by Country 2024 & 2032
- Figure 56: Europe Marine Acoustic Sensors Market Volume (K Unit), by Country 2024 & 2032
- Figure 57: Europe Marine Acoustic Sensors Market Revenue Share (%), by Country 2024 & 2032
- Figure 58: Europe Marine Acoustic Sensors Market Volume Share (%), by Country 2024 & 2032
- Figure 59: Asia Marine Acoustic Sensors Market Revenue (Million), by Product 2024 & 2032
- Figure 60: Asia Marine Acoustic Sensors Market Volume (K Unit), by Product 2024 & 2032
- Figure 61: Asia Marine Acoustic Sensors Market Revenue Share (%), by Product 2024 & 2032
- Figure 62: Asia Marine Acoustic Sensors Market Volume Share (%), by Product 2024 & 2032
- Figure 63: Asia Marine Acoustic Sensors Market Revenue (Million), by Application 2024 & 2032
- Figure 64: Asia Marine Acoustic Sensors Market Volume (K Unit), by Application 2024 & 2032
- Figure 65: Asia Marine Acoustic Sensors Market Revenue Share (%), by Application 2024 & 2032
- Figure 66: Asia Marine Acoustic Sensors Market Volume Share (%), by Application 2024 & 2032
- Figure 67: Asia Marine Acoustic Sensors Market Revenue (Million), by Geography 2024 & 2032
- Figure 68: Asia Marine Acoustic Sensors Market Volume (K Unit), by Geography 2024 & 2032
- Figure 69: Asia Marine Acoustic Sensors Market Revenue Share (%), by Geography 2024 & 2032
- Figure 70: Asia Marine Acoustic Sensors Market Volume Share (%), by Geography 2024 & 2032
- Figure 71: Asia Marine Acoustic Sensors Market Revenue (Million), by Country 2024 & 2032
- Figure 72: Asia Marine Acoustic Sensors Market Volume (K Unit), by Country 2024 & 2032
- Figure 73: Asia Marine Acoustic Sensors Market Revenue Share (%), by Country 2024 & 2032
- Figure 74: Asia Marine Acoustic Sensors Market Volume Share (%), by Country 2024 & 2032
- Figure 75: Australia and New Zealand Marine Acoustic Sensors Market Revenue (Million), by Product 2024 & 2032
- Figure 76: Australia and New Zealand Marine Acoustic Sensors Market Volume (K Unit), by Product 2024 & 2032
- Figure 77: Australia and New Zealand Marine Acoustic Sensors Market Revenue Share (%), by Product 2024 & 2032
- Figure 78: Australia and New Zealand Marine Acoustic Sensors Market Volume Share (%), by Product 2024 & 2032
- Figure 79: Australia and New Zealand Marine Acoustic Sensors Market Revenue (Million), by Application 2024 & 2032
- Figure 80: Australia and New Zealand Marine Acoustic Sensors Market Volume (K Unit), by Application 2024 & 2032
- Figure 81: Australia and New Zealand Marine Acoustic Sensors Market Revenue Share (%), by Application 2024 & 2032
- Figure 82: Australia and New Zealand Marine Acoustic Sensors Market Volume Share (%), by Application 2024 & 2032
- Figure 83: Australia and New Zealand Marine Acoustic Sensors Market Revenue (Million), by Geography 2024 & 2032
- Figure 84: Australia and New Zealand Marine Acoustic Sensors Market Volume (K Unit), by Geography 2024 & 2032
- Figure 85: Australia and New Zealand Marine Acoustic Sensors Market Revenue Share (%), by Geography 2024 & 2032
- Figure 86: Australia and New Zealand Marine Acoustic Sensors Market Volume Share (%), by Geography 2024 & 2032
- Figure 87: Australia and New Zealand Marine Acoustic Sensors Market Revenue (Million), by Country 2024 & 2032
- Figure 88: Australia and New Zealand Marine Acoustic Sensors Market Volume (K Unit), by Country 2024 & 2032
- Figure 89: Australia and New Zealand Marine Acoustic Sensors Market Revenue Share (%), by Country 2024 & 2032
- Figure 90: Australia and New Zealand Marine Acoustic Sensors Market Volume Share (%), by Country 2024 & 2032
- Figure 91: Latin America Marine Acoustic Sensors Market Revenue (Million), by Product 2024 & 2032
- Figure 92: Latin America Marine Acoustic Sensors Market Volume (K Unit), by Product 2024 & 2032
- Figure 93: Latin America Marine Acoustic Sensors Market Revenue Share (%), by Product 2024 & 2032
- Figure 94: Latin America Marine Acoustic Sensors Market Volume Share (%), by Product 2024 & 2032
- Figure 95: Latin America Marine Acoustic Sensors Market Revenue (Million), by Application 2024 & 2032
- Figure 96: Latin America Marine Acoustic Sensors Market Volume (K Unit), by Application 2024 & 2032
- Figure 97: Latin America Marine Acoustic Sensors Market Revenue Share (%), by Application 2024 & 2032
- Figure 98: Latin America Marine Acoustic Sensors Market Volume Share (%), by Application 2024 & 2032
- Figure 99: Latin America Marine Acoustic Sensors Market Revenue (Million), by Geography 2024 & 2032
- Figure 100: Latin America Marine Acoustic Sensors Market Volume (K Unit), by Geography 2024 & 2032
- Figure 101: Latin America Marine Acoustic Sensors Market Revenue Share (%), by Geography 2024 & 2032
- Figure 102: Latin America Marine Acoustic Sensors Market Volume Share (%), by Geography 2024 & 2032
- Figure 103: Latin America Marine Acoustic Sensors Market Revenue (Million), by Country 2024 & 2032
- Figure 104: Latin America Marine Acoustic Sensors Market Volume (K Unit), by Country 2024 & 2032
- Figure 105: Latin America Marine Acoustic Sensors Market Revenue Share (%), by Country 2024 & 2032
- Figure 106: Latin America Marine Acoustic Sensors Market Volume Share (%), by Country 2024 & 2032
List of Tables
- Table 1: Global Marine Acoustic Sensors Market Revenue Million Forecast, by Region 2019 & 2032
- Table 2: Global Marine Acoustic Sensors Market Volume K Unit Forecast, by Region 2019 & 2032
- Table 3: Global Marine Acoustic Sensors Market Revenue Million Forecast, by Product 2019 & 2032
- Table 4: Global Marine Acoustic Sensors Market Volume K Unit Forecast, by Product 2019 & 2032
- Table 5: Global Marine Acoustic Sensors Market Revenue Million Forecast, by Application 2019 & 2032
- Table 6: Global Marine Acoustic Sensors Market Volume K Unit Forecast, by Application 2019 & 2032
- Table 7: Global Marine Acoustic Sensors Market Revenue Million Forecast, by Geography 2019 & 2032
- Table 8: Global Marine Acoustic Sensors Market Volume K Unit Forecast, by Geography 2019 & 2032
- Table 9: Global Marine Acoustic Sensors Market Revenue Million Forecast, by Region 2019 & 2032
- Table 10: Global Marine Acoustic Sensors Market Volume K Unit Forecast, by Region 2019 & 2032
- Table 11: Global Marine Acoustic Sensors Market Revenue Million Forecast, by Country 2019 & 2032
- Table 12: Global Marine Acoustic Sensors Market Volume K Unit Forecast, by Country 2019 & 2032
- Table 13: United States Marine Acoustic Sensors Market Revenue (Million) Forecast, by Application 2019 & 2032
- Table 14: United States Marine Acoustic Sensors Market Volume (K Unit) Forecast, by Application 2019 & 2032
- Table 15: Canada Marine Acoustic Sensors Market Revenue (Million) Forecast, by Application 2019 & 2032
- Table 16: Canada Marine Acoustic Sensors Market Volume (K Unit) Forecast, by Application 2019 & 2032
- Table 17: Mexico Marine Acoustic Sensors Market Revenue (Million) Forecast, by Application 2019 & 2032
- Table 18: Mexico Marine Acoustic Sensors Market Volume (K Unit) Forecast, by Application 2019 & 2032
- Table 19: Global Marine Acoustic Sensors Market Revenue Million Forecast, by Country 2019 & 2032
- Table 20: Global Marine Acoustic Sensors Market Volume K Unit Forecast, by Country 2019 & 2032
- Table 21: Germany Marine Acoustic Sensors Market Revenue (Million) Forecast, by Application 2019 & 2032
- Table 22: Germany Marine Acoustic Sensors Market Volume (K Unit) Forecast, by Application 2019 & 2032
- Table 23: United Kingdom Marine Acoustic Sensors Market Revenue (Million) Forecast, by Application 2019 & 2032
- Table 24: United Kingdom Marine Acoustic Sensors Market Volume (K Unit) Forecast, by Application 2019 & 2032
- Table 25: France Marine Acoustic Sensors Market Revenue (Million) Forecast, by Application 2019 & 2032
- Table 26: France Marine Acoustic Sensors Market Volume (K Unit) Forecast, by Application 2019 & 2032
- Table 27: Spain Marine Acoustic Sensors Market Revenue (Million) Forecast, by Application 2019 & 2032
- Table 28: Spain Marine Acoustic Sensors Market Volume (K Unit) Forecast, by Application 2019 & 2032
- Table 29: Italy Marine Acoustic Sensors Market Revenue (Million) Forecast, by Application 2019 & 2032
- Table 30: Italy Marine Acoustic Sensors Market Volume (K Unit) Forecast, by Application 2019 & 2032
- Table 31: Spain Marine Acoustic Sensors Market Revenue (Million) Forecast, by Application 2019 & 2032
- Table 32: Spain Marine Acoustic Sensors Market Volume (K Unit) Forecast, by Application 2019 & 2032
- Table 33: Belgium Marine Acoustic Sensors Market Revenue (Million) Forecast, by Application 2019 & 2032
- Table 34: Belgium Marine Acoustic Sensors Market Volume (K Unit) Forecast, by Application 2019 & 2032
- Table 35: Netherland Marine Acoustic Sensors Market Revenue (Million) Forecast, by Application 2019 & 2032
- Table 36: Netherland Marine Acoustic Sensors Market Volume (K Unit) Forecast, by Application 2019 & 2032
- Table 37: Nordics Marine Acoustic Sensors Market Revenue (Million) Forecast, by Application 2019 & 2032
- Table 38: Nordics Marine Acoustic Sensors Market Volume (K Unit) Forecast, by Application 2019 & 2032
- Table 39: Rest of Europe Marine Acoustic Sensors Market Revenue (Million) Forecast, by Application 2019 & 2032
- Table 40: Rest of Europe Marine Acoustic Sensors Market Volume (K Unit) Forecast, by Application 2019 & 2032
- Table 41: Global Marine Acoustic Sensors Market Revenue Million Forecast, by Country 2019 & 2032
- Table 42: Global Marine Acoustic Sensors Market Volume K Unit Forecast, by Country 2019 & 2032
- Table 43: China Marine Acoustic Sensors Market Revenue (Million) Forecast, by Application 2019 & 2032
- Table 44: China Marine Acoustic Sensors Market Volume (K Unit) Forecast, by Application 2019 & 2032
- Table 45: Japan Marine Acoustic Sensors Market Revenue (Million) Forecast, by Application 2019 & 2032
- Table 46: Japan Marine Acoustic Sensors Market Volume (K Unit) Forecast, by Application 2019 & 2032
- Table 47: India Marine Acoustic Sensors Market Revenue (Million) Forecast, by Application 2019 & 2032
- Table 48: India Marine Acoustic Sensors Market Volume (K Unit) Forecast, by Application 2019 & 2032
- Table 49: South Korea Marine Acoustic Sensors Market Revenue (Million) Forecast, by Application 2019 & 2032
- Table 50: South Korea Marine Acoustic Sensors Market Volume (K Unit) Forecast, by Application 2019 & 2032
- Table 51: Southeast Asia Marine Acoustic Sensors Market Revenue (Million) Forecast, by Application 2019 & 2032
- Table 52: Southeast Asia Marine Acoustic Sensors Market Volume (K Unit) Forecast, by Application 2019 & 2032
- Table 53: Australia Marine Acoustic Sensors Market Revenue (Million) Forecast, by Application 2019 & 2032
- Table 54: Australia Marine Acoustic Sensors Market Volume (K Unit) Forecast, by Application 2019 & 2032
- Table 55: Indonesia Marine Acoustic Sensors Market Revenue (Million) Forecast, by Application 2019 & 2032
- Table 56: Indonesia Marine Acoustic Sensors Market Volume (K Unit) Forecast, by Application 2019 & 2032
- Table 57: Phillipes Marine Acoustic Sensors Market Revenue (Million) Forecast, by Application 2019 & 2032
- Table 58: Phillipes Marine Acoustic Sensors Market Volume (K Unit) Forecast, by Application 2019 & 2032
- Table 59: Singapore Marine Acoustic Sensors Market Revenue (Million) Forecast, by Application 2019 & 2032
- Table 60: Singapore Marine Acoustic Sensors Market Volume (K Unit) Forecast, by Application 2019 & 2032
- Table 61: Thailandc Marine Acoustic Sensors Market Revenue (Million) Forecast, by Application 2019 & 2032
- Table 62: Thailandc Marine Acoustic Sensors Market Volume (K Unit) Forecast, by Application 2019 & 2032
- Table 63: Rest of Asia Pacific Marine Acoustic Sensors Market Revenue (Million) Forecast, by Application 2019 & 2032
- Table 64: Rest of Asia Pacific Marine Acoustic Sensors Market Volume (K Unit) Forecast, by Application 2019 & 2032
- Table 65: Global Marine Acoustic Sensors Market Revenue Million Forecast, by Country 2019 & 2032
- Table 66: Global Marine Acoustic Sensors Market Volume K Unit Forecast, by Country 2019 & 2032
- Table 67: Brazil Marine Acoustic Sensors Market Revenue (Million) Forecast, by Application 2019 & 2032
- Table 68: Brazil Marine Acoustic Sensors Market Volume (K Unit) Forecast, by Application 2019 & 2032
- Table 69: Argentina Marine Acoustic Sensors Market Revenue (Million) Forecast, by Application 2019 & 2032
- Table 70: Argentina Marine Acoustic Sensors Market Volume (K Unit) Forecast, by Application 2019 & 2032
- Table 71: Peru Marine Acoustic Sensors Market Revenue (Million) Forecast, by Application 2019 & 2032
- Table 72: Peru Marine Acoustic Sensors Market Volume (K Unit) Forecast, by Application 2019 & 2032
- Table 73: Chile Marine Acoustic Sensors Market Revenue (Million) Forecast, by Application 2019 & 2032
- Table 74: Chile Marine Acoustic Sensors Market Volume (K Unit) Forecast, by Application 2019 & 2032
- Table 75: Colombia Marine Acoustic Sensors Market Revenue (Million) Forecast, by Application 2019 & 2032
- Table 76: Colombia Marine Acoustic Sensors Market Volume (K Unit) Forecast, by Application 2019 & 2032
- Table 77: Ecuador Marine Acoustic Sensors Market Revenue (Million) Forecast, by Application 2019 & 2032
- Table 78: Ecuador Marine Acoustic Sensors Market Volume (K Unit) Forecast, by Application 2019 & 2032
- Table 79: Venezuela Marine Acoustic Sensors Market Revenue (Million) Forecast, by Application 2019 & 2032
- Table 80: Venezuela Marine Acoustic Sensors Market Volume (K Unit) Forecast, by Application 2019 & 2032
- Table 81: Rest of South America Marine Acoustic Sensors Market Revenue (Million) Forecast, by Application 2019 & 2032
- Table 82: Rest of South America Marine Acoustic Sensors Market Volume (K Unit) Forecast, by Application 2019 & 2032
- Table 83: Global Marine Acoustic Sensors Market Revenue Million Forecast, by Country 2019 & 2032
- Table 84: Global Marine Acoustic Sensors Market Volume K Unit Forecast, by Country 2019 & 2032
- Table 85: United States Marine Acoustic Sensors Market Revenue (Million) Forecast, by Application 2019 & 2032
- Table 86: United States Marine Acoustic Sensors Market Volume (K Unit) Forecast, by Application 2019 & 2032
- Table 87: Canada Marine Acoustic Sensors Market Revenue (Million) Forecast, by Application 2019 & 2032
- Table 88: Canada Marine Acoustic Sensors Market Volume (K Unit) Forecast, by Application 2019 & 2032
- Table 89: Mexico Marine Acoustic Sensors Market Revenue (Million) Forecast, by Application 2019 & 2032
- Table 90: Mexico Marine Acoustic Sensors Market Volume (K Unit) Forecast, by Application 2019 & 2032
- Table 91: Global Marine Acoustic Sensors Market Revenue Million Forecast, by Country 2019 & 2032
- Table 92: Global Marine Acoustic Sensors Market Volume K Unit Forecast, by Country 2019 & 2032
- Table 93: United Arab Emirates Marine Acoustic Sensors Market Revenue (Million) Forecast, by Application 2019 & 2032
- Table 94: United Arab Emirates Marine Acoustic Sensors Market Volume (K Unit) Forecast, by Application 2019 & 2032
- Table 95: Saudi Arabia Marine Acoustic Sensors Market Revenue (Million) Forecast, by Application 2019 & 2032
- Table 96: Saudi Arabia Marine Acoustic Sensors Market Volume (K Unit) Forecast, by Application 2019 & 2032
- Table 97: South Africa Marine Acoustic Sensors Market Revenue (Million) Forecast, by Application 2019 & 2032
- Table 98: South Africa Marine Acoustic Sensors Market Volume (K Unit) Forecast, by Application 2019 & 2032
- Table 99: Rest of Middle East and Africa Marine Acoustic Sensors Market Revenue (Million) Forecast, by Application 2019 & 2032
- Table 100: Rest of Middle East and Africa Marine Acoustic Sensors Market Volume (K Unit) Forecast, by Application 2019 & 2032
- Table 101: Global Marine Acoustic Sensors Market Revenue Million Forecast, by Product 2019 & 2032
- Table 102: Global Marine Acoustic Sensors Market Volume K Unit Forecast, by Product 2019 & 2032
- Table 103: Global Marine Acoustic Sensors Market Revenue Million Forecast, by Application 2019 & 2032
- Table 104: Global Marine Acoustic Sensors Market Volume K Unit Forecast, by Application 2019 & 2032
- Table 105: Global Marine Acoustic Sensors Market Revenue Million Forecast, by Geography 2019 & 2032
- Table 106: Global Marine Acoustic Sensors Market Volume K Unit Forecast, by Geography 2019 & 2032
- Table 107: Global Marine Acoustic Sensors Market Revenue Million Forecast, by Country 2019 & 2032
- Table 108: Global Marine Acoustic Sensors Market Volume K Unit Forecast, by Country 2019 & 2032
- Table 109: Global Marine Acoustic Sensors Market Revenue Million Forecast, by Product 2019 & 2032
- Table 110: Global Marine Acoustic Sensors Market Volume K Unit Forecast, by Product 2019 & 2032
- Table 111: Global Marine Acoustic Sensors Market Revenue Million Forecast, by Application 2019 & 2032
- Table 112: Global Marine Acoustic Sensors Market Volume K Unit Forecast, by Application 2019 & 2032
- Table 113: Global Marine Acoustic Sensors Market Revenue Million Forecast, by Geography 2019 & 2032
- Table 114: Global Marine Acoustic Sensors Market Volume K Unit Forecast, by Geography 2019 & 2032
- Table 115: Global Marine Acoustic Sensors Market Revenue Million Forecast, by Country 2019 & 2032
- Table 116: Global Marine Acoustic Sensors Market Volume K Unit Forecast, by Country 2019 & 2032
- Table 117: Global Marine Acoustic Sensors Market Revenue Million Forecast, by Product 2019 & 2032
- Table 118: Global Marine Acoustic Sensors Market Volume K Unit Forecast, by Product 2019 & 2032
- Table 119: Global Marine Acoustic Sensors Market Revenue Million Forecast, by Application 2019 & 2032
- Table 120: Global Marine Acoustic Sensors Market Volume K Unit Forecast, by Application 2019 & 2032
- Table 121: Global Marine Acoustic Sensors Market Revenue Million Forecast, by Geography 2019 & 2032
- Table 122: Global Marine Acoustic Sensors Market Volume K Unit Forecast, by Geography 2019 & 2032
- Table 123: Global Marine Acoustic Sensors Market Revenue Million Forecast, by Country 2019 & 2032
- Table 124: Global Marine Acoustic Sensors Market Volume K Unit Forecast, by Country 2019 & 2032
- Table 125: Global Marine Acoustic Sensors Market Revenue Million Forecast, by Product 2019 & 2032
- Table 126: Global Marine Acoustic Sensors Market Volume K Unit Forecast, by Product 2019 & 2032
- Table 127: Global Marine Acoustic Sensors Market Revenue Million Forecast, by Application 2019 & 2032
- Table 128: Global Marine Acoustic Sensors Market Volume K Unit Forecast, by Application 2019 & 2032
- Table 129: Global Marine Acoustic Sensors Market Revenue Million Forecast, by Geography 2019 & 2032
- Table 130: Global Marine Acoustic Sensors Market Volume K Unit Forecast, by Geography 2019 & 2032
- Table 131: Global Marine Acoustic Sensors Market Revenue Million Forecast, by Country 2019 & 2032
- Table 132: Global Marine Acoustic Sensors Market Volume K Unit Forecast, by Country 2019 & 2032
- Table 133: Global Marine Acoustic Sensors Market Revenue Million Forecast, by Product 2019 & 2032
- Table 134: Global Marine Acoustic Sensors Market Volume K Unit Forecast, by Product 2019 & 2032
- Table 135: Global Marine Acoustic Sensors Market Revenue Million Forecast, by Application 2019 & 2032
- Table 136: Global Marine Acoustic Sensors Market Volume K Unit Forecast, by Application 2019 & 2032
- Table 137: Global Marine Acoustic Sensors Market Revenue Million Forecast, by Geography 2019 & 2032
- Table 138: Global Marine Acoustic Sensors Market Volume K Unit Forecast, by Geography 2019 & 2032
- Table 139: Global Marine Acoustic Sensors Market Revenue Million Forecast, by Country 2019 & 2032
- Table 140: Global Marine Acoustic Sensors Market Volume K Unit Forecast, by Country 2019 & 2032
Frequently Asked Questions
1. What is the projected Compound Annual Growth Rate (CAGR) of the Marine Acoustic Sensors Market?
The projected CAGR is approximately 6.41%.
2. Which companies are prominent players in the Marine Acoustic Sensors Market?
Key companies in the market include Teledyne Marine Technologies (Teledyne Technologies Incorporated), Hottinger Brüel & Kjær (Spectris PLC), Garmin Ltd, Thales Group, BAE Systems PLC, L3harris Technologies Inc, Cobham Ultra Seniorco S à R l, CTS Corporatio, Ocean Sonics Ltd, Geospectrum Technologies Inc.
3. What are the main segments of the Marine Acoustic Sensors Market?
The market segments include Product, Application, Geography.
4. Can you provide details about the market size?
The market size is estimated to be USD 1.46 Million as of 2022.
5. What are some drivers contributing to market growth?
Growing Deployment of Acoustic Navigation for Underwater Positioning; Rising Defense Spending in Several Countries.
6. What are the notable trends driving market growth?
Underwater Transducer to Hold Major Share in the Product Segment.
7. Are there any restraints impacting market growth?
High Initial Setup and Installation Cost; Limited Product variety and Capacity.
8. Can you provide examples of recent developments in the market?
June 2023 - RPS presented Neptune, the predictive algorithm for accurately and reliably detecting marine mammal vocalizations. The sub-sea sound emitted during the in-field development of offshore wind and oil and gas exploration efforts can potentially negatively impact marine mammals, causing temporary and permanent hearing loss, disrupted feeding and breeding cycles, and even physical injury.
9. What pricing options are available for accessing the report?
Pricing options include single-user, multi-user, and enterprise licenses priced at USD 4750, USD 5250, and USD 8750 respectively.
10. Is the market size provided in terms of value or volume?
The market size is provided in terms of value, measured in Million and volume, measured in K Unit.
11. Are there any specific market keywords associated with the report?
Yes, the market keyword associated with the report is "Marine Acoustic Sensors Market," which aids in identifying and referencing the specific market segment covered.
12. How do I determine which pricing option suits my needs best?
The pricing options vary based on user requirements and access needs. Individual users may opt for single-user licenses, while businesses requiring broader access may choose multi-user or enterprise licenses for cost-effective access to the report.
13. Are there any additional resources or data provided in the Marine Acoustic Sensors Market report?
While the report offers comprehensive insights, it's advisable to review the specific contents or supplementary materials provided to ascertain if additional resources or data are available.
14. How can I stay updated on further developments or reports in the Marine Acoustic Sensors Market?
To stay informed about further developments, trends, and reports in the Marine Acoustic Sensors Market, consider subscribing to industry newsletters, following relevant companies and organizations, or regularly checking reputable industry news sources and publications.
Methodology
Step 1 - Identification of Relevant Samples Size from Population Database


Step 2 - Approaches for Defining Global Market Size (Value, Volume* & Price*)

Note*: In applicable scenarios
Step 3 - Data Sources
Primary Research
- Web Analytics
- Survey Reports
- Research Institute
- Latest Research Reports
- Opinion Leaders
Secondary Research
- Annual Reports
- White Paper
- Latest Press Release
- Industry Association
- Paid Database
- Investor Presentations

Step 4 - Data Triangulation
Involves using different sources of information in order to increase the validity of a study
These sources are likely to be stakeholders in a program - participants, other researchers, program staff, other community members, and so on.
Then we put all data in single framework & apply various statistical tools to find out the dynamic on the market.
During the analysis stage, feedback from the stakeholder groups would be compared to determine areas of agreement as well as areas of divergence


