


Key Insights
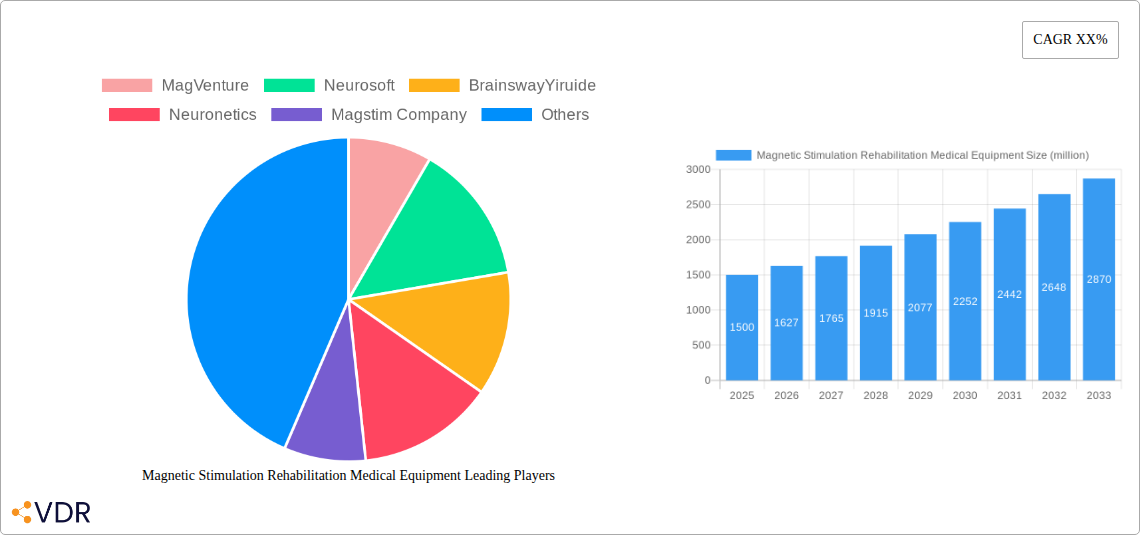
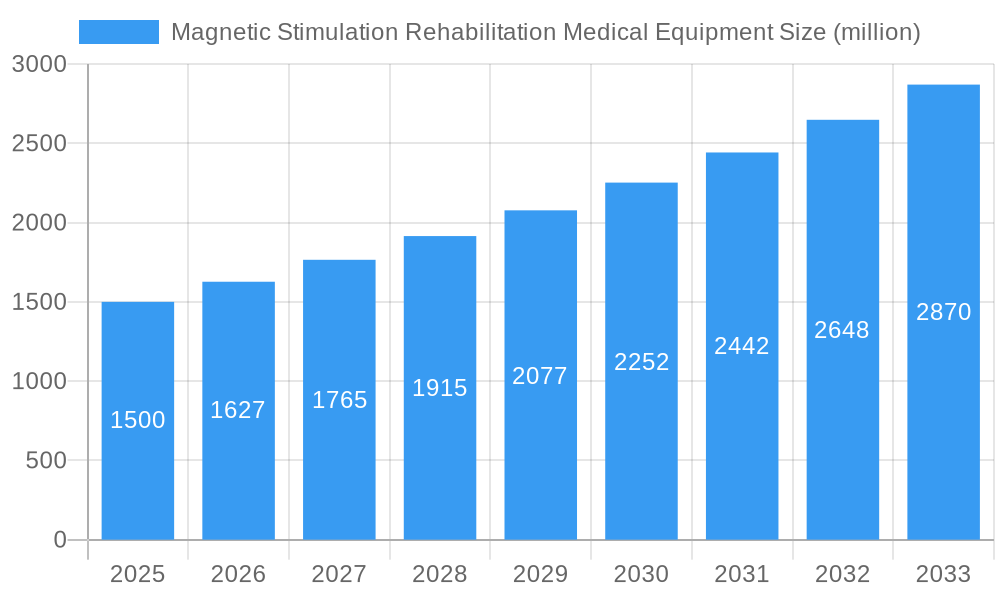
The global Magnetic Stimulation Rehabilitation Medical Equipment market is poised for significant expansion, driven by increasing awareness of non-invasive therapeutic options and a growing prevalence of neurological and psychiatric disorders. With a projected market size of approximately USD 1,500 million in 2025 and an anticipated Compound Annual Growth Rate (CAGR) of around 8.5%, the market is expected to reach over USD 3,000 million by 2033. This robust growth is fueled by key drivers such as the rising demand for effective treatments for conditions like depression, anxiety, and stroke rehabilitation, alongside advancements in TMS (Transcranial Magnetic Stimulation) and pelvic floor functional magnetic stimulator technologies. The application segment, led by hospitals and rehabilitation institutions, is set to dominate, owing to the specialized nature of these treatments and the established healthcare infrastructure. Furthermore, an aging global population and a heightened focus on mental health are contributing to sustained demand.
Magnetic Stimulation Rehabilitation Medical Equipment Market Size (In Billion)

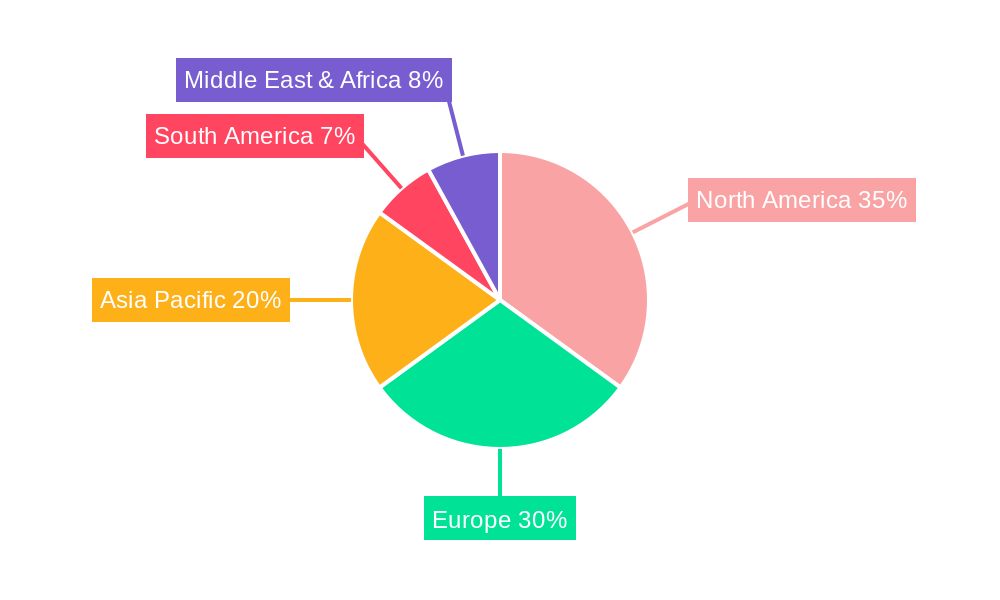
The market's expansion is not without its challenges, with restraints such as the initial cost of equipment and the need for trained professionals to operate them posing potential hurdles. However, ongoing research and development efforts, coupled with increasing reimbursement policies for magnetic stimulation therapies, are expected to mitigate these challenges. Emerging trends include the development of more portable and user-friendly devices, the integration of AI for personalized treatment protocols, and the expansion of home-use magnetic stimulation devices for chronic condition management. Geographically, North America and Europe currently lead the market due to advanced healthcare systems and early adoption of novel therapies, but the Asia Pacific region, particularly China and India, is emerging as a high-growth frontier due to a large patient pool and improving healthcare access. Key players like MagVenture, Neurosoft, and Brainsway are actively investing in innovation and market penetration to capitalize on this burgeoning opportunity.
Magnetic Stimulation Rehabilitation Medical Equipment Company Market Share
Magnetic Stimulation Rehabilitation Medical Equipment Market Dynamics & Structure
The magnetic stimulation rehabilitation medical equipment market is characterized by a moderate concentration, with key players like MagVenture, Neurosoft, Brainsway, Neuronetics, and Magstim Company holding significant stakes. Technological innovation is a primary driver, with continuous advancements in device precision, efficacy, and patient comfort shaping product development. Regulatory frameworks, particularly those from the FDA and EMA, play a crucial role in market access and product approvals, influencing the pace of innovation and adoption. Competitive product substitutes, though limited, include pharmacological treatments and conventional therapies, which exert pressure on magnetic stimulation device pricing and market penetration. End-user demographics are evolving, with increasing demand from aging populations and a growing awareness of non-invasive treatment options for neurological and psychiatric conditions. Mergers and acquisitions (M&A) are a notable trend, facilitating market consolidation and the expansion of product portfolios.
- Market Concentration: Moderate, with a few dominant players.
- Technological Innovation: Driven by enhanced device capabilities and treatment protocols.
- Regulatory Influence: FDA and EMA approvals are critical for market entry.
- Competitive Landscape: Primarily competes with pharmaceuticals and traditional rehabilitation methods.
- End-User Demand: Growing from geriatric populations and those seeking non-invasive treatments.
- M&A Activity: Expected to increase for market consolidation and portfolio expansion.
Magnetic Stimulation Rehabilitation Medical Equipment Growth Trends & Insights
The magnetic stimulation rehabilitation medical equipment market is poised for robust growth, fueled by an escalating prevalence of neurological disorders, a rising demand for non-invasive therapeutic solutions, and continuous technological advancements. Projections indicate a compound annual growth rate (CAGR) of approximately 8.5% from 2025 to 2033, with the global market size expected to reach an estimated $3.2 billion by 2025. This growth trajectory is underpinned by increasing investment in research and development, leading to more sophisticated and targeted magnetic stimulation devices. Adoption rates are steadily climbing across both established and emerging economies, driven by a growing understanding of the efficacy of transcranial magnetic stimulation (TMS) for conditions such as depression, anxiety, and chronic pain, alongside the expanding utility of pelvic floor functional magnetic stimulators for urogynecological issues.
Technological disruptions are continuously redefining the market. Innovations in focused magnetic field technology, increased portability of devices, and the integration of AI for personalized treatment planning are significantly enhancing patient outcomes and user experience. Furthermore, the development of multi-coil systems and adaptive stimulation protocols promises to broaden the therapeutic applications of magnetic stimulation. Consumer behavior shifts are also playing a pivotal role. Patients are increasingly seeking less invasive and drug-free treatment alternatives, demonstrating a higher willingness to adopt advanced medical technologies that offer comparable or superior efficacy with fewer side effects. Healthcare providers, in turn, are recognizing the cost-effectiveness and improved patient satisfaction associated with these technologies, leading to greater integration into standard clinical practice.
The parent market, encompassing the broader neuromodulation and rehabilitation equipment sector, provides a significant foundation for magnetic stimulation devices, valued at approximately $15.8 billion in 2025. Within this parent market, the child market for functional electrical stimulation (FES) and other electrotherapy devices represents a complementary and sometimes overlapping segment, contributing an estimated $2.1 billion in 2025. The magnetic stimulation segment, while a subset, is demonstrating a faster growth rate due to its unique therapeutic advantages and expanding clinical indications. The integration of home-use devices, spurred by the need for continuous or frequent treatment and the convenience of remote care, is a particularly dynamic sub-trend, contributing to accelerated market penetration. The market penetration of magnetic stimulation technologies, currently around 15% in developed nations for key indications, is anticipated to rise significantly as accessibility increases and reimbursement policies evolve.
Dominant Regions, Countries, or Segments in Magnetic Stimulation Rehabilitation Medical Equipment
North America, particularly the United States, stands as the dominant region driving growth in the magnetic stimulation rehabilitation medical equipment market. This regional leadership is attributable to several interconnected factors, including a high prevalence of neurological and psychiatric disorders, a robust healthcare infrastructure capable of adopting advanced medical technologies, and substantial investment in research and development. The U.S. market alone accounted for an estimated 40% of global revenue in 2025, projecting to reach approximately $1.28 billion. Government initiatives promoting mental health awareness and treatment, coupled with favorable reimbursement policies for neurostimulation therapies, further bolster market expansion.
In terms of application, hospitals remain the largest segment, representing over 60% of the market share in 2025, estimated at $1.92 billion. This dominance is due to the advanced diagnostic and treatment capabilities housed within hospital settings, facilitating the widespread adoption of magnetic stimulation devices for conditions like major depressive disorder, obsessive-compulsive disorder, and stroke rehabilitation. Rehabilitation institutions constitute the second-largest application, holding an estimated 25% market share ($0.8 billion), as these facilities increasingly incorporate magnetic stimulation into their patient recovery protocols for neurological deficits. The household segment, though smaller, is exhibiting the fastest growth rate, projected to expand at a CAGR of 10% over the forecast period, driven by the development of more user-friendly, portable devices and an increasing preference for at-home treatment options.
By type, Transcranial Magnetic Stimulation (TWS) devices command the largest market share, estimated at 85% of the total magnetic stimulation market in 2025, approximately $2.72 billion. This is directly linked to the extensive research and clinical application of TMS in treating a wide array of psychiatric and neurological conditions. The Pelvic Floor Functional Magnetic Stimulator segment, while smaller, is experiencing significant growth, with an estimated market share of 10% ($0.32 billion) and a projected CAGR of 9.2%. This rise is attributed to the increasing awareness and diagnosis of pelvic floor disorders, particularly among women, and the growing acceptance of non-invasive treatment modalities.
- Dominant Region: North America (primarily the United States).
- Drivers: High disease prevalence, advanced healthcare infrastructure, R&D investment, supportive reimbursement.
- Market Share: ~40% of global revenue in 2025.
- Dominant Application Segment: Hospitals.
- Drivers: Advanced treatment capabilities, broad clinical indications.
- Market Share: >60% in 2025.
- Fastest Growing Application Segment: Household.
- Drivers: Device portability, patient convenience, remote care trends.
- CAGR: ~10% (2025-2033).
- Dominant Device Type: Transcranial Magnetic Stimulation (TWS).
- Drivers: Wide range of established clinical applications, extensive research base.
- Market Share: ~85% in 2025.
- Fastest Growing Device Type: Pelvic Floor Functional Magnetic Stimulator.
- Drivers: Increasing diagnosis of pelvic floor disorders, preference for non-invasive treatments.
- CAGR: ~9.2% (2025-2033).
Magnetic Stimulation Rehabilitation Medical Equipment Product Landscape
The product landscape for magnetic stimulation rehabilitation medical equipment is characterized by sophisticated technological advancements aimed at enhancing efficacy, safety, and user experience. Innovations include the development of high-frequency and low-frequency stimulation protocols tailored for specific neurological conditions, advanced coil designs for precise targeting of brain regions, and intuitive software interfaces that allow for personalized treatment plans. Emerging products feature enhanced portability, enabling both clinical use and home-based therapy, and integrated feedback systems that monitor patient response in real-time. For instance, advanced TMS devices offer customizable pulse shapes and intensities, while pelvic floor stimulators are designed for discreet, comfortable, and effective home use.
Key Drivers, Barriers & Challenges in Magnetic Stimulation Rehabilitation Medical Equipment
Key Drivers:
- Rising Prevalence of Neurological and Psychiatric Disorders: Growing incidence of conditions like depression, anxiety, stroke, and Parkinson's disease fuels demand for effective treatment modalities.
- Advancements in Technology: Continuous innovation in device design, precision, and targeting capabilities expands therapeutic applications and improves outcomes.
- Increasing Adoption of Non-Invasive Therapies: Growing patient and clinician preference for treatments that avoid surgery or extensive medication.
- Favorable Reimbursement Policies: Expansion of insurance coverage for magnetic stimulation therapies in key markets.
- Growing Geriatric Population: An aging demographic is more susceptible to neurological conditions, driving demand for rehabilitation solutions.
Key Barriers & Challenges:
- High Cost of Devices: Initial purchase price and maintenance can be a significant barrier for smaller institutions and individual users, estimated to be between $20,000 and $100,000 per unit.
- Limited Awareness and Understanding: In some regions, a lack of comprehensive understanding of magnetic stimulation benefits and applications among healthcare professionals and patients.
- Regulatory Hurdles and Approval Times: The stringent approval processes for new medical devices can slow down market entry and innovation diffusion.
- Therapist Training and Expertise: The need for specialized training for healthcare professionals to effectively operate and administer magnetic stimulation treatments.
- Competition from Alternative Therapies: Established pharmacological and traditional therapeutic approaches continue to offer competition.
Emerging Opportunities in Magnetic Stimulation Rehabilitation Medical Equipment
Emerging opportunities lie in the expanding therapeutic applications beyond traditional indications, such as chronic pain management and post-traumatic stress disorder (PTSD). The development of personalized treatment algorithms leveraging AI and machine learning presents a significant avenue for enhancing treatment efficacy and patient stratification. Furthermore, the increasing demand for home-use devices, driven by convenience and the need for continuous therapy, opens up substantial market potential for portable and user-friendly magnetic stimulators. Expansion into underserved geographical markets, particularly in developing economies with growing healthcare expenditure, represents another key opportunity for market players.
Growth Accelerators in the Magnetic Stimulation Rehabilitation Medical Equipment Industry
Growth in the magnetic stimulation rehabilitation medical equipment industry is being significantly accelerated by technological breakthroughs, such as the development of closed-loop systems that dynamically adjust stimulation parameters based on real-time patient neurophysiological data. Strategic partnerships between device manufacturers, research institutions, and pharmaceutical companies are fostering collaborative innovation and clinical validation, leading to broader treatment indications and market acceptance. Market expansion strategies focused on emerging economies, coupled with efforts to improve affordability and accessibility through innovative business models, are also crucial growth accelerators, ensuring wider patient reach and greater adoption rates.
Key Players Shaping the Magnetic Stimulation Rehabilitation Medical Equipment Market
- MagVenture
- Neurosoft
- Brainsway
- Yiruide
- Neuronetics
- Magstim Company
- eNeura
- Remed
- Nexstim
- MAG & More
- Tonica Elektronik
- Jiangxi Brain Modulate
- YINGCHI
- Junjian Wanfeng
- Vishee Medical
- Wuhan Yiruide Medical Treatment Equipment
Notable Milestones in Magnetic Stimulation Rehabilitation Medical Equipment Sector
- 2019: FDA clearance for Brainsway's TMS system for obsessive-compulsive disorder (OCD).
- 2020: Magstim Company launches its new generation of TMS systems with enhanced features for research and clinical applications.
- 2021: Neuronetics receives expanded FDA clearance for its NeuroStar Advanced Therapy for adolescent depression.
- 2022: MagVenture introduces a novel TMS coil design for more targeted and effective brain stimulation.
- 2023: Emergence of new players from China like Jiangxi Brain Modulate and YINGCHI, focusing on cost-effective solutions and expanding domestic market share.
- 2024: Growing interest and initial product development in home-use magnetic stimulators for chronic pain management and neurological rehabilitation.
- 2025 (Estimated): Increased adoption of AI-driven personalized treatment protocols in TMS devices.
- 2026-2033 (Projected): Significant market expansion for pelvic floor functional magnetic stimulators due to increased awareness and clinical evidence.
In-Depth Magnetic Stimulation Rehabilitation Medical Equipment Market Outlook
The magnetic stimulation rehabilitation medical equipment market is set for sustained expansion, driven by continuous technological innovation and an increasing global burden of neurological and psychiatric conditions. Key growth accelerators include the development of more personalized and adaptive stimulation techniques, the expansion of home-use devices, and the penetration into emerging markets. Strategic collaborations and a focus on improving cost-effectiveness will further bolster market growth. The market outlook is highly positive, with ample opportunities for both established players and new entrants to capitalize on the growing demand for effective, non-invasive treatment solutions in rehabilitation medicine.
Magnetic Stimulation Rehabilitation Medical Equipment Segmentation
-
1. Application
- 1.1. Hospital
- 1.2. Rehabilitation Institution
- 1.3. Household
- 1.4. Others
-
2. Types
- 2.1. Transcranial Magnetic Stimulation(TWS)
- 2.2. Pelvic Floor Functional Magnetic Stimulator
Magnetic Stimulation Rehabilitation Medical Equipment Segmentation By Geography
-
1. North America
- 1.1. United States
- 1.2. Canada
- 1.3. Mexico
-
2. South America
- 2.1. Brazil
- 2.2. Argentina
- 2.3. Rest of South America
-
3. Europe
- 3.1. United Kingdom
- 3.2. Germany
- 3.3. France
- 3.4. Italy
- 3.5. Spain
- 3.6. Russia
- 3.7. Benelux
- 3.8. Nordics
- 3.9. Rest of Europe
-
4. Middle East & Africa
- 4.1. Turkey
- 4.2. Israel
- 4.3. GCC
- 4.4. North Africa
- 4.5. South Africa
- 4.6. Rest of Middle East & Africa
-
5. Asia Pacific
- 5.1. China
- 5.2. India
- 5.3. Japan
- 5.4. South Korea
- 5.5. ASEAN
- 5.6. Oceania
- 5.7. Rest of Asia Pacific
Magnetic Stimulation Rehabilitation Medical Equipment Regional Market Share
Geographic Coverage of Magnetic Stimulation Rehabilitation Medical Equipment
Magnetic Stimulation Rehabilitation Medical Equipment REPORT HIGHLIGHTS
| Aspects | Details |
|---|---|
| Study Period | 2020-2034 |
| Base Year | 2025 |
| Estimated Year | 2026 |
| Forecast Period | 2026-2034 |
| Historical Period | 2020-2025 |
| Growth Rate | CAGR of XX% from 2020-2034 |
| Segmentation |
|
Table of Contents
- 1. Introduction
- 1.1. Research Scope
- 1.2. Market Segmentation
- 1.3. Research Methodology
- 1.4. Definitions and Assumptions
- 2. Executive Summary
- 2.1. Introduction
- 3. Market Dynamics
- 3.1. Introduction
- 3.2. Market Drivers
- 3.3. Market Restrains
- 3.4. Market Trends
- 4. Market Factor Analysis
- 4.1. Porters Five Forces
- 4.2. Supply/Value Chain
- 4.3. PESTEL analysis
- 4.4. Market Entropy
- 4.5. Patent/Trademark Analysis
- 5. Global Magnetic Stimulation Rehabilitation Medical Equipment Analysis, Insights and Forecast, 2020-2032
- 5.1. Market Analysis, Insights and Forecast - by Application
- 5.1.1. Hospital
- 5.1.2. Rehabilitation Institution
- 5.1.3. Household
- 5.1.4. Others
- 5.2. Market Analysis, Insights and Forecast - by Types
- 5.2.1. Transcranial Magnetic Stimulation(TWS)
- 5.2.2. Pelvic Floor Functional Magnetic Stimulator
- 5.3. Market Analysis, Insights and Forecast - by Region
- 5.3.1. North America
- 5.3.2. South America
- 5.3.3. Europe
- 5.3.4. Middle East & Africa
- 5.3.5. Asia Pacific
- 5.1. Market Analysis, Insights and Forecast - by Application
- 6. North America Magnetic Stimulation Rehabilitation Medical Equipment Analysis, Insights and Forecast, 2020-2032
- 6.1. Market Analysis, Insights and Forecast - by Application
- 6.1.1. Hospital
- 6.1.2. Rehabilitation Institution
- 6.1.3. Household
- 6.1.4. Others
- 6.2. Market Analysis, Insights and Forecast - by Types
- 6.2.1. Transcranial Magnetic Stimulation(TWS)
- 6.2.2. Pelvic Floor Functional Magnetic Stimulator
- 6.1. Market Analysis, Insights and Forecast - by Application
- 7. South America Magnetic Stimulation Rehabilitation Medical Equipment Analysis, Insights and Forecast, 2020-2032
- 7.1. Market Analysis, Insights and Forecast - by Application
- 7.1.1. Hospital
- 7.1.2. Rehabilitation Institution
- 7.1.3. Household
- 7.1.4. Others
- 7.2. Market Analysis, Insights and Forecast - by Types
- 7.2.1. Transcranial Magnetic Stimulation(TWS)
- 7.2.2. Pelvic Floor Functional Magnetic Stimulator
- 7.1. Market Analysis, Insights and Forecast - by Application
- 8. Europe Magnetic Stimulation Rehabilitation Medical Equipment Analysis, Insights and Forecast, 2020-2032
- 8.1. Market Analysis, Insights and Forecast - by Application
- 8.1.1. Hospital
- 8.1.2. Rehabilitation Institution
- 8.1.3. Household
- 8.1.4. Others
- 8.2. Market Analysis, Insights and Forecast - by Types
- 8.2.1. Transcranial Magnetic Stimulation(TWS)
- 8.2.2. Pelvic Floor Functional Magnetic Stimulator
- 8.1. Market Analysis, Insights and Forecast - by Application
- 9. Middle East & Africa Magnetic Stimulation Rehabilitation Medical Equipment Analysis, Insights and Forecast, 2020-2032
- 9.1. Market Analysis, Insights and Forecast - by Application
- 9.1.1. Hospital
- 9.1.2. Rehabilitation Institution
- 9.1.3. Household
- 9.1.4. Others
- 9.2. Market Analysis, Insights and Forecast - by Types
- 9.2.1. Transcranial Magnetic Stimulation(TWS)
- 9.2.2. Pelvic Floor Functional Magnetic Stimulator
- 9.1. Market Analysis, Insights and Forecast - by Application
- 10. Asia Pacific Magnetic Stimulation Rehabilitation Medical Equipment Analysis, Insights and Forecast, 2020-2032
- 10.1. Market Analysis, Insights and Forecast - by Application
- 10.1.1. Hospital
- 10.1.2. Rehabilitation Institution
- 10.1.3. Household
- 10.1.4. Others
- 10.2. Market Analysis, Insights and Forecast - by Types
- 10.2.1. Transcranial Magnetic Stimulation(TWS)
- 10.2.2. Pelvic Floor Functional Magnetic Stimulator
- 10.1. Market Analysis, Insights and Forecast - by Application
- 11. Competitive Analysis
- 11.1. Global Market Share Analysis 2025
- 11.2. Company Profiles
- 11.2.1 MagVenture
- 11.2.1.1. Overview
- 11.2.1.2. Products
- 11.2.1.3. SWOT Analysis
- 11.2.1.4. Recent Developments
- 11.2.1.5. Financials (Based on Availability)
- 11.2.2 Neurosoft
- 11.2.2.1. Overview
- 11.2.2.2. Products
- 11.2.2.3. SWOT Analysis
- 11.2.2.4. Recent Developments
- 11.2.2.5. Financials (Based on Availability)
- 11.2.3 BrainswayYiruide
- 11.2.3.1. Overview
- 11.2.3.2. Products
- 11.2.3.3. SWOT Analysis
- 11.2.3.4. Recent Developments
- 11.2.3.5. Financials (Based on Availability)
- 11.2.4 Neuronetics
- 11.2.4.1. Overview
- 11.2.4.2. Products
- 11.2.4.3. SWOT Analysis
- 11.2.4.4. Recent Developments
- 11.2.4.5. Financials (Based on Availability)
- 11.2.5 Magstim Company
- 11.2.5.1. Overview
- 11.2.5.2. Products
- 11.2.5.3. SWOT Analysis
- 11.2.5.4. Recent Developments
- 11.2.5.5. Financials (Based on Availability)
- 11.2.6 eNeura
- 11.2.6.1. Overview
- 11.2.6.2. Products
- 11.2.6.3. SWOT Analysis
- 11.2.6.4. Recent Developments
- 11.2.6.5. Financials (Based on Availability)
- 11.2.7 Remed
- 11.2.7.1. Overview
- 11.2.7.2. Products
- 11.2.7.3. SWOT Analysis
- 11.2.7.4. Recent Developments
- 11.2.7.5. Financials (Based on Availability)
- 11.2.8 Nexstim
- 11.2.8.1. Overview
- 11.2.8.2. Products
- 11.2.8.3. SWOT Analysis
- 11.2.8.4. Recent Developments
- 11.2.8.5. Financials (Based on Availability)
- 11.2.9 MAG & More
- 11.2.9.1. Overview
- 11.2.9.2. Products
- 11.2.9.3. SWOT Analysis
- 11.2.9.4. Recent Developments
- 11.2.9.5. Financials (Based on Availability)
- 11.2.10 Tonica Elektronik
- 11.2.10.1. Overview
- 11.2.10.2. Products
- 11.2.10.3. SWOT Analysis
- 11.2.10.4. Recent Developments
- 11.2.10.5. Financials (Based on Availability)
- 11.2.11 Jiangxi Brain Modulate
- 11.2.11.1. Overview
- 11.2.11.2. Products
- 11.2.11.3. SWOT Analysis
- 11.2.11.4. Recent Developments
- 11.2.11.5. Financials (Based on Availability)
- 11.2.12 YINGCHI
- 11.2.12.1. Overview
- 11.2.12.2. Products
- 11.2.12.3. SWOT Analysis
- 11.2.12.4. Recent Developments
- 11.2.12.5. Financials (Based on Availability)
- 11.2.13 Junjian Wanfeng
- 11.2.13.1. Overview
- 11.2.13.2. Products
- 11.2.13.3. SWOT Analysis
- 11.2.13.4. Recent Developments
- 11.2.13.5. Financials (Based on Availability)
- 11.2.14 Vishee Medical
- 11.2.14.1. Overview
- 11.2.14.2. Products
- 11.2.14.3. SWOT Analysis
- 11.2.14.4. Recent Developments
- 11.2.14.5. Financials (Based on Availability)
- 11.2.15 Wuhan Yiruide Medical Treatment Equipment
- 11.2.15.1. Overview
- 11.2.15.2. Products
- 11.2.15.3. SWOT Analysis
- 11.2.15.4. Recent Developments
- 11.2.15.5. Financials (Based on Availability)
- 11.2.1 MagVenture
List of Figures
- Figure 1: Global Magnetic Stimulation Rehabilitation Medical Equipment Revenue Breakdown (million, %) by Region 2025 & 2033
- Figure 2: Global Magnetic Stimulation Rehabilitation Medical Equipment Volume Breakdown (K, %) by Region 2025 & 2033
- Figure 3: North America Magnetic Stimulation Rehabilitation Medical Equipment Revenue (million), by Application 2025 & 2033
- Figure 4: North America Magnetic Stimulation Rehabilitation Medical Equipment Volume (K), by Application 2025 & 2033
- Figure 5: North America Magnetic Stimulation Rehabilitation Medical Equipment Revenue Share (%), by Application 2025 & 2033
- Figure 6: North America Magnetic Stimulation Rehabilitation Medical Equipment Volume Share (%), by Application 2025 & 2033
- Figure 7: North America Magnetic Stimulation Rehabilitation Medical Equipment Revenue (million), by Types 2025 & 2033
- Figure 8: North America Magnetic Stimulation Rehabilitation Medical Equipment Volume (K), by Types 2025 & 2033
- Figure 9: North America Magnetic Stimulation Rehabilitation Medical Equipment Revenue Share (%), by Types 2025 & 2033
- Figure 10: North America Magnetic Stimulation Rehabilitation Medical Equipment Volume Share (%), by Types 2025 & 2033
- Figure 11: North America Magnetic Stimulation Rehabilitation Medical Equipment Revenue (million), by Country 2025 & 2033
- Figure 12: North America Magnetic Stimulation Rehabilitation Medical Equipment Volume (K), by Country 2025 & 2033
- Figure 13: North America Magnetic Stimulation Rehabilitation Medical Equipment Revenue Share (%), by Country 2025 & 2033
- Figure 14: North America Magnetic Stimulation Rehabilitation Medical Equipment Volume Share (%), by Country 2025 & 2033
- Figure 15: South America Magnetic Stimulation Rehabilitation Medical Equipment Revenue (million), by Application 2025 & 2033
- Figure 16: South America Magnetic Stimulation Rehabilitation Medical Equipment Volume (K), by Application 2025 & 2033
- Figure 17: South America Magnetic Stimulation Rehabilitation Medical Equipment Revenue Share (%), by Application 2025 & 2033
- Figure 18: South America Magnetic Stimulation Rehabilitation Medical Equipment Volume Share (%), by Application 2025 & 2033
- Figure 19: South America Magnetic Stimulation Rehabilitation Medical Equipment Revenue (million), by Types 2025 & 2033
- Figure 20: South America Magnetic Stimulation Rehabilitation Medical Equipment Volume (K), by Types 2025 & 2033
- Figure 21: South America Magnetic Stimulation Rehabilitation Medical Equipment Revenue Share (%), by Types 2025 & 2033
- Figure 22: South America Magnetic Stimulation Rehabilitation Medical Equipment Volume Share (%), by Types 2025 & 2033
- Figure 23: South America Magnetic Stimulation Rehabilitation Medical Equipment Revenue (million), by Country 2025 & 2033
- Figure 24: South America Magnetic Stimulation Rehabilitation Medical Equipment Volume (K), by Country 2025 & 2033
- Figure 25: South America Magnetic Stimulation Rehabilitation Medical Equipment Revenue Share (%), by Country 2025 & 2033
- Figure 26: South America Magnetic Stimulation Rehabilitation Medical Equipment Volume Share (%), by Country 2025 & 2033
- Figure 27: Europe Magnetic Stimulation Rehabilitation Medical Equipment Revenue (million), by Application 2025 & 2033
- Figure 28: Europe Magnetic Stimulation Rehabilitation Medical Equipment Volume (K), by Application 2025 & 2033
- Figure 29: Europe Magnetic Stimulation Rehabilitation Medical Equipment Revenue Share (%), by Application 2025 & 2033
- Figure 30: Europe Magnetic Stimulation Rehabilitation Medical Equipment Volume Share (%), by Application 2025 & 2033
- Figure 31: Europe Magnetic Stimulation Rehabilitation Medical Equipment Revenue (million), by Types 2025 & 2033
- Figure 32: Europe Magnetic Stimulation Rehabilitation Medical Equipment Volume (K), by Types 2025 & 2033
- Figure 33: Europe Magnetic Stimulation Rehabilitation Medical Equipment Revenue Share (%), by Types 2025 & 2033
- Figure 34: Europe Magnetic Stimulation Rehabilitation Medical Equipment Volume Share (%), by Types 2025 & 2033
- Figure 35: Europe Magnetic Stimulation Rehabilitation Medical Equipment Revenue (million), by Country 2025 & 2033
- Figure 36: Europe Magnetic Stimulation Rehabilitation Medical Equipment Volume (K), by Country 2025 & 2033
- Figure 37: Europe Magnetic Stimulation Rehabilitation Medical Equipment Revenue Share (%), by Country 2025 & 2033
- Figure 38: Europe Magnetic Stimulation Rehabilitation Medical Equipment Volume Share (%), by Country 2025 & 2033
- Figure 39: Middle East & Africa Magnetic Stimulation Rehabilitation Medical Equipment Revenue (million), by Application 2025 & 2033
- Figure 40: Middle East & Africa Magnetic Stimulation Rehabilitation Medical Equipment Volume (K), by Application 2025 & 2033
- Figure 41: Middle East & Africa Magnetic Stimulation Rehabilitation Medical Equipment Revenue Share (%), by Application 2025 & 2033
- Figure 42: Middle East & Africa Magnetic Stimulation Rehabilitation Medical Equipment Volume Share (%), by Application 2025 & 2033
- Figure 43: Middle East & Africa Magnetic Stimulation Rehabilitation Medical Equipment Revenue (million), by Types 2025 & 2033
- Figure 44: Middle East & Africa Magnetic Stimulation Rehabilitation Medical Equipment Volume (K), by Types 2025 & 2033
- Figure 45: Middle East & Africa Magnetic Stimulation Rehabilitation Medical Equipment Revenue Share (%), by Types 2025 & 2033
- Figure 46: Middle East & Africa Magnetic Stimulation Rehabilitation Medical Equipment Volume Share (%), by Types 2025 & 2033
- Figure 47: Middle East & Africa Magnetic Stimulation Rehabilitation Medical Equipment Revenue (million), by Country 2025 & 2033
- Figure 48: Middle East & Africa Magnetic Stimulation Rehabilitation Medical Equipment Volume (K), by Country 2025 & 2033
- Figure 49: Middle East & Africa Magnetic Stimulation Rehabilitation Medical Equipment Revenue Share (%), by Country 2025 & 2033
- Figure 50: Middle East & Africa Magnetic Stimulation Rehabilitation Medical Equipment Volume Share (%), by Country 2025 & 2033
- Figure 51: Asia Pacific Magnetic Stimulation Rehabilitation Medical Equipment Revenue (million), by Application 2025 & 2033
- Figure 52: Asia Pacific Magnetic Stimulation Rehabilitation Medical Equipment Volume (K), by Application 2025 & 2033
- Figure 53: Asia Pacific Magnetic Stimulation Rehabilitation Medical Equipment Revenue Share (%), by Application 2025 & 2033
- Figure 54: Asia Pacific Magnetic Stimulation Rehabilitation Medical Equipment Volume Share (%), by Application 2025 & 2033
- Figure 55: Asia Pacific Magnetic Stimulation Rehabilitation Medical Equipment Revenue (million), by Types 2025 & 2033
- Figure 56: Asia Pacific Magnetic Stimulation Rehabilitation Medical Equipment Volume (K), by Types 2025 & 2033
- Figure 57: Asia Pacific Magnetic Stimulation Rehabilitation Medical Equipment Revenue Share (%), by Types 2025 & 2033
- Figure 58: Asia Pacific Magnetic Stimulation Rehabilitation Medical Equipment Volume Share (%), by Types 2025 & 2033
- Figure 59: Asia Pacific Magnetic Stimulation Rehabilitation Medical Equipment Revenue (million), by Country 2025 & 2033
- Figure 60: Asia Pacific Magnetic Stimulation Rehabilitation Medical Equipment Volume (K), by Country 2025 & 2033
- Figure 61: Asia Pacific Magnetic Stimulation Rehabilitation Medical Equipment Revenue Share (%), by Country 2025 & 2033
- Figure 62: Asia Pacific Magnetic Stimulation Rehabilitation Medical Equipment Volume Share (%), by Country 2025 & 2033
List of Tables
- Table 1: Global Magnetic Stimulation Rehabilitation Medical Equipment Revenue million Forecast, by Application 2020 & 2033
- Table 2: Global Magnetic Stimulation Rehabilitation Medical Equipment Volume K Forecast, by Application 2020 & 2033
- Table 3: Global Magnetic Stimulation Rehabilitation Medical Equipment Revenue million Forecast, by Types 2020 & 2033
- Table 4: Global Magnetic Stimulation Rehabilitation Medical Equipment Volume K Forecast, by Types 2020 & 2033
- Table 5: Global Magnetic Stimulation Rehabilitation Medical Equipment Revenue million Forecast, by Region 2020 & 2033
- Table 6: Global Magnetic Stimulation Rehabilitation Medical Equipment Volume K Forecast, by Region 2020 & 2033
- Table 7: Global Magnetic Stimulation Rehabilitation Medical Equipment Revenue million Forecast, by Application 2020 & 2033
- Table 8: Global Magnetic Stimulation Rehabilitation Medical Equipment Volume K Forecast, by Application 2020 & 2033
- Table 9: Global Magnetic Stimulation Rehabilitation Medical Equipment Revenue million Forecast, by Types 2020 & 2033
- Table 10: Global Magnetic Stimulation Rehabilitation Medical Equipment Volume K Forecast, by Types 2020 & 2033
- Table 11: Global Magnetic Stimulation Rehabilitation Medical Equipment Revenue million Forecast, by Country 2020 & 2033
- Table 12: Global Magnetic Stimulation Rehabilitation Medical Equipment Volume K Forecast, by Country 2020 & 2033
- Table 13: United States Magnetic Stimulation Rehabilitation Medical Equipment Revenue (million) Forecast, by Application 2020 & 2033
- Table 14: United States Magnetic Stimulation Rehabilitation Medical Equipment Volume (K) Forecast, by Application 2020 & 2033
- Table 15: Canada Magnetic Stimulation Rehabilitation Medical Equipment Revenue (million) Forecast, by Application 2020 & 2033
- Table 16: Canada Magnetic Stimulation Rehabilitation Medical Equipment Volume (K) Forecast, by Application 2020 & 2033
- Table 17: Mexico Magnetic Stimulation Rehabilitation Medical Equipment Revenue (million) Forecast, by Application 2020 & 2033
- Table 18: Mexico Magnetic Stimulation Rehabilitation Medical Equipment Volume (K) Forecast, by Application 2020 & 2033
- Table 19: Global Magnetic Stimulation Rehabilitation Medical Equipment Revenue million Forecast, by Application 2020 & 2033
- Table 20: Global Magnetic Stimulation Rehabilitation Medical Equipment Volume K Forecast, by Application 2020 & 2033
- Table 21: Global Magnetic Stimulation Rehabilitation Medical Equipment Revenue million Forecast, by Types 2020 & 2033
- Table 22: Global Magnetic Stimulation Rehabilitation Medical Equipment Volume K Forecast, by Types 2020 & 2033
- Table 23: Global Magnetic Stimulation Rehabilitation Medical Equipment Revenue million Forecast, by Country 2020 & 2033
- Table 24: Global Magnetic Stimulation Rehabilitation Medical Equipment Volume K Forecast, by Country 2020 & 2033
- Table 25: Brazil Magnetic Stimulation Rehabilitation Medical Equipment Revenue (million) Forecast, by Application 2020 & 2033
- Table 26: Brazil Magnetic Stimulation Rehabilitation Medical Equipment Volume (K) Forecast, by Application 2020 & 2033
- Table 27: Argentina Magnetic Stimulation Rehabilitation Medical Equipment Revenue (million) Forecast, by Application 2020 & 2033
- Table 28: Argentina Magnetic Stimulation Rehabilitation Medical Equipment Volume (K) Forecast, by Application 2020 & 2033
- Table 29: Rest of South America Magnetic Stimulation Rehabilitation Medical Equipment Revenue (million) Forecast, by Application 2020 & 2033
- Table 30: Rest of South America Magnetic Stimulation Rehabilitation Medical Equipment Volume (K) Forecast, by Application 2020 & 2033
- Table 31: Global Magnetic Stimulation Rehabilitation Medical Equipment Revenue million Forecast, by Application 2020 & 2033
- Table 32: Global Magnetic Stimulation Rehabilitation Medical Equipment Volume K Forecast, by Application 2020 & 2033
- Table 33: Global Magnetic Stimulation Rehabilitation Medical Equipment Revenue million Forecast, by Types 2020 & 2033
- Table 34: Global Magnetic Stimulation Rehabilitation Medical Equipment Volume K Forecast, by Types 2020 & 2033
- Table 35: Global Magnetic Stimulation Rehabilitation Medical Equipment Revenue million Forecast, by Country 2020 & 2033
- Table 36: Global Magnetic Stimulation Rehabilitation Medical Equipment Volume K Forecast, by Country 2020 & 2033
- Table 37: United Kingdom Magnetic Stimulation Rehabilitation Medical Equipment Revenue (million) Forecast, by Application 2020 & 2033
- Table 38: United Kingdom Magnetic Stimulation Rehabilitation Medical Equipment Volume (K) Forecast, by Application 2020 & 2033
- Table 39: Germany Magnetic Stimulation Rehabilitation Medical Equipment Revenue (million) Forecast, by Application 2020 & 2033
- Table 40: Germany Magnetic Stimulation Rehabilitation Medical Equipment Volume (K) Forecast, by Application 2020 & 2033
- Table 41: France Magnetic Stimulation Rehabilitation Medical Equipment Revenue (million) Forecast, by Application 2020 & 2033
- Table 42: France Magnetic Stimulation Rehabilitation Medical Equipment Volume (K) Forecast, by Application 2020 & 2033
- Table 43: Italy Magnetic Stimulation Rehabilitation Medical Equipment Revenue (million) Forecast, by Application 2020 & 2033
- Table 44: Italy Magnetic Stimulation Rehabilitation Medical Equipment Volume (K) Forecast, by Application 2020 & 2033
- Table 45: Spain Magnetic Stimulation Rehabilitation Medical Equipment Revenue (million) Forecast, by Application 2020 & 2033
- Table 46: Spain Magnetic Stimulation Rehabilitation Medical Equipment Volume (K) Forecast, by Application 2020 & 2033
- Table 47: Russia Magnetic Stimulation Rehabilitation Medical Equipment Revenue (million) Forecast, by Application 2020 & 2033
- Table 48: Russia Magnetic Stimulation Rehabilitation Medical Equipment Volume (K) Forecast, by Application 2020 & 2033
- Table 49: Benelux Magnetic Stimulation Rehabilitation Medical Equipment Revenue (million) Forecast, by Application 2020 & 2033
- Table 50: Benelux Magnetic Stimulation Rehabilitation Medical Equipment Volume (K) Forecast, by Application 2020 & 2033
- Table 51: Nordics Magnetic Stimulation Rehabilitation Medical Equipment Revenue (million) Forecast, by Application 2020 & 2033
- Table 52: Nordics Magnetic Stimulation Rehabilitation Medical Equipment Volume (K) Forecast, by Application 2020 & 2033
- Table 53: Rest of Europe Magnetic Stimulation Rehabilitation Medical Equipment Revenue (million) Forecast, by Application 2020 & 2033
- Table 54: Rest of Europe Magnetic Stimulation Rehabilitation Medical Equipment Volume (K) Forecast, by Application 2020 & 2033
- Table 55: Global Magnetic Stimulation Rehabilitation Medical Equipment Revenue million Forecast, by Application 2020 & 2033
- Table 56: Global Magnetic Stimulation Rehabilitation Medical Equipment Volume K Forecast, by Application 2020 & 2033
- Table 57: Global Magnetic Stimulation Rehabilitation Medical Equipment Revenue million Forecast, by Types 2020 & 2033
- Table 58: Global Magnetic Stimulation Rehabilitation Medical Equipment Volume K Forecast, by Types 2020 & 2033
- Table 59: Global Magnetic Stimulation Rehabilitation Medical Equipment Revenue million Forecast, by Country 2020 & 2033
- Table 60: Global Magnetic Stimulation Rehabilitation Medical Equipment Volume K Forecast, by Country 2020 & 2033
- Table 61: Turkey Magnetic Stimulation Rehabilitation Medical Equipment Revenue (million) Forecast, by Application 2020 & 2033
- Table 62: Turkey Magnetic Stimulation Rehabilitation Medical Equipment Volume (K) Forecast, by Application 2020 & 2033
- Table 63: Israel Magnetic Stimulation Rehabilitation Medical Equipment Revenue (million) Forecast, by Application 2020 & 2033
- Table 64: Israel Magnetic Stimulation Rehabilitation Medical Equipment Volume (K) Forecast, by Application 2020 & 2033
- Table 65: GCC Magnetic Stimulation Rehabilitation Medical Equipment Revenue (million) Forecast, by Application 2020 & 2033
- Table 66: GCC Magnetic Stimulation Rehabilitation Medical Equipment Volume (K) Forecast, by Application 2020 & 2033
- Table 67: North Africa Magnetic Stimulation Rehabilitation Medical Equipment Revenue (million) Forecast, by Application 2020 & 2033
- Table 68: North Africa Magnetic Stimulation Rehabilitation Medical Equipment Volume (K) Forecast, by Application 2020 & 2033
- Table 69: South Africa Magnetic Stimulation Rehabilitation Medical Equipment Revenue (million) Forecast, by Application 2020 & 2033
- Table 70: South Africa Magnetic Stimulation Rehabilitation Medical Equipment Volume (K) Forecast, by Application 2020 & 2033
- Table 71: Rest of Middle East & Africa Magnetic Stimulation Rehabilitation Medical Equipment Revenue (million) Forecast, by Application 2020 & 2033
- Table 72: Rest of Middle East & Africa Magnetic Stimulation Rehabilitation Medical Equipment Volume (K) Forecast, by Application 2020 & 2033
- Table 73: Global Magnetic Stimulation Rehabilitation Medical Equipment Revenue million Forecast, by Application 2020 & 2033
- Table 74: Global Magnetic Stimulation Rehabilitation Medical Equipment Volume K Forecast, by Application 2020 & 2033
- Table 75: Global Magnetic Stimulation Rehabilitation Medical Equipment Revenue million Forecast, by Types 2020 & 2033
- Table 76: Global Magnetic Stimulation Rehabilitation Medical Equipment Volume K Forecast, by Types 2020 & 2033
- Table 77: Global Magnetic Stimulation Rehabilitation Medical Equipment Revenue million Forecast, by Country 2020 & 2033
- Table 78: Global Magnetic Stimulation Rehabilitation Medical Equipment Volume K Forecast, by Country 2020 & 2033
- Table 79: China Magnetic Stimulation Rehabilitation Medical Equipment Revenue (million) Forecast, by Application 2020 & 2033
- Table 80: China Magnetic Stimulation Rehabilitation Medical Equipment Volume (K) Forecast, by Application 2020 & 2033
- Table 81: India Magnetic Stimulation Rehabilitation Medical Equipment Revenue (million) Forecast, by Application 2020 & 2033
- Table 82: India Magnetic Stimulation Rehabilitation Medical Equipment Volume (K) Forecast, by Application 2020 & 2033
- Table 83: Japan Magnetic Stimulation Rehabilitation Medical Equipment Revenue (million) Forecast, by Application 2020 & 2033
- Table 84: Japan Magnetic Stimulation Rehabilitation Medical Equipment Volume (K) Forecast, by Application 2020 & 2033
- Table 85: South Korea Magnetic Stimulation Rehabilitation Medical Equipment Revenue (million) Forecast, by Application 2020 & 2033
- Table 86: South Korea Magnetic Stimulation Rehabilitation Medical Equipment Volume (K) Forecast, by Application 2020 & 2033
- Table 87: ASEAN Magnetic Stimulation Rehabilitation Medical Equipment Revenue (million) Forecast, by Application 2020 & 2033
- Table 88: ASEAN Magnetic Stimulation Rehabilitation Medical Equipment Volume (K) Forecast, by Application 2020 & 2033
- Table 89: Oceania Magnetic Stimulation Rehabilitation Medical Equipment Revenue (million) Forecast, by Application 2020 & 2033
- Table 90: Oceania Magnetic Stimulation Rehabilitation Medical Equipment Volume (K) Forecast, by Application 2020 & 2033
- Table 91: Rest of Asia Pacific Magnetic Stimulation Rehabilitation Medical Equipment Revenue (million) Forecast, by Application 2020 & 2033
- Table 92: Rest of Asia Pacific Magnetic Stimulation Rehabilitation Medical Equipment Volume (K) Forecast, by Application 2020 & 2033
Frequently Asked Questions
1. What is the projected Compound Annual Growth Rate (CAGR) of the Magnetic Stimulation Rehabilitation Medical Equipment?
The projected CAGR is approximately XX%.
2. Which companies are prominent players in the Magnetic Stimulation Rehabilitation Medical Equipment?
Key companies in the market include MagVenture, Neurosoft, BrainswayYiruide, Neuronetics, Magstim Company, eNeura, Remed, Nexstim, MAG & More, Tonica Elektronik, Jiangxi Brain Modulate, YINGCHI, Junjian Wanfeng, Vishee Medical, Wuhan Yiruide Medical Treatment Equipment.
3. What are the main segments of the Magnetic Stimulation Rehabilitation Medical Equipment?
The market segments include Application, Types.
4. Can you provide details about the market size?
The market size is estimated to be USD XXX million as of 2022.
5. What are some drivers contributing to market growth?
N/A
6. What are the notable trends driving market growth?
N/A
7. Are there any restraints impacting market growth?
N/A
8. Can you provide examples of recent developments in the market?
N/A
9. What pricing options are available for accessing the report?
Pricing options include single-user, multi-user, and enterprise licenses priced at USD 3350.00, USD 5025.00, and USD 6700.00 respectively.
10. Is the market size provided in terms of value or volume?
The market size is provided in terms of value, measured in million and volume, measured in K.
11. Are there any specific market keywords associated with the report?
Yes, the market keyword associated with the report is "Magnetic Stimulation Rehabilitation Medical Equipment," which aids in identifying and referencing the specific market segment covered.
12. How do I determine which pricing option suits my needs best?
The pricing options vary based on user requirements and access needs. Individual users may opt for single-user licenses, while businesses requiring broader access may choose multi-user or enterprise licenses for cost-effective access to the report.
13. Are there any additional resources or data provided in the Magnetic Stimulation Rehabilitation Medical Equipment report?
While the report offers comprehensive insights, it's advisable to review the specific contents or supplementary materials provided to ascertain if additional resources or data are available.
14. How can I stay updated on further developments or reports in the Magnetic Stimulation Rehabilitation Medical Equipment?
To stay informed about further developments, trends, and reports in the Magnetic Stimulation Rehabilitation Medical Equipment, consider subscribing to industry newsletters, following relevant companies and organizations, or regularly checking reputable industry news sources and publications.
Methodology
Step 1 - Identification of Relevant Samples Size from Population Database


Step 2 - Approaches for Defining Global Market Size (Value, Volume* & Price*)

Note*: In applicable scenarios
Step 3 - Data Sources
Primary Research
- Web Analytics
- Survey Reports
- Research Institute
- Latest Research Reports
- Opinion Leaders
Secondary Research
- Annual Reports
- White Paper
- Latest Press Release
- Industry Association
- Paid Database
- Investor Presentations

Step 4 - Data Triangulation
Involves using different sources of information in order to increase the validity of a study
These sources are likely to be stakeholders in a program - participants, other researchers, program staff, other community members, and so on.
Then we put all data in single framework & apply various statistical tools to find out the dynamic on the market.
During the analysis stage, feedback from the stakeholder groups would be compared to determine areas of agreement as well as areas of divergence