

Key Insights
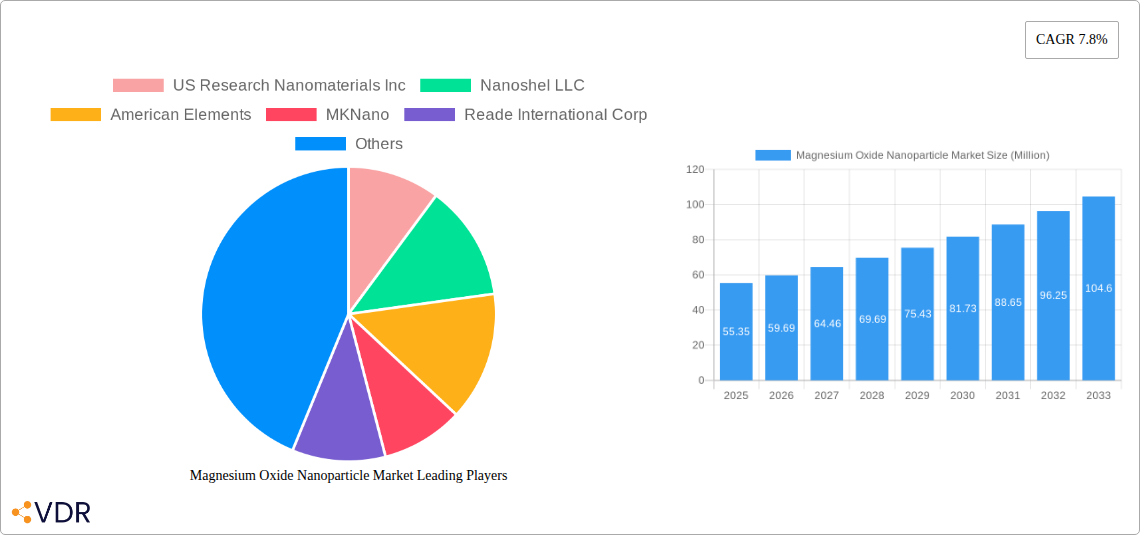
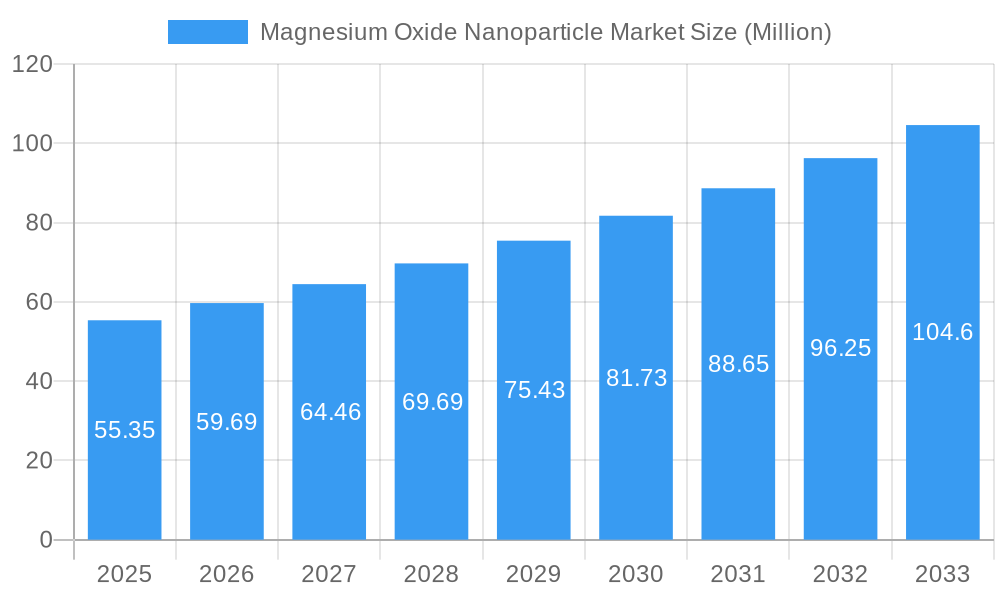
The Magnesium Oxide Nanoparticle (MgO NP) market is experiencing robust growth, projected to reach a value of $55.35 million in 2025, expanding at a Compound Annual Growth Rate (CAGR) of 7.8% from 2025 to 2033. This expansion is driven by the increasing demand across diverse applications, particularly in refractories, construction and ceramics, and electronics. The unique properties of MgO NPs, such as high thermal stability, excellent electrical insulation, and biocompatibility, make them ideal for enhancing material performance in these sectors. Growth in the construction industry, fueled by infrastructure development globally, significantly contributes to market expansion. Similarly, the burgeoning electronics sector, driven by the miniaturization of components and the demand for high-performance materials, is a key driver. Furthermore, advancements in nanotechnology and manufacturing processes are continuously improving the cost-effectiveness and quality of MgO NPs, further accelerating market adoption.
Magnesium Oxide Nanoparticle Market Market Size (In Million)
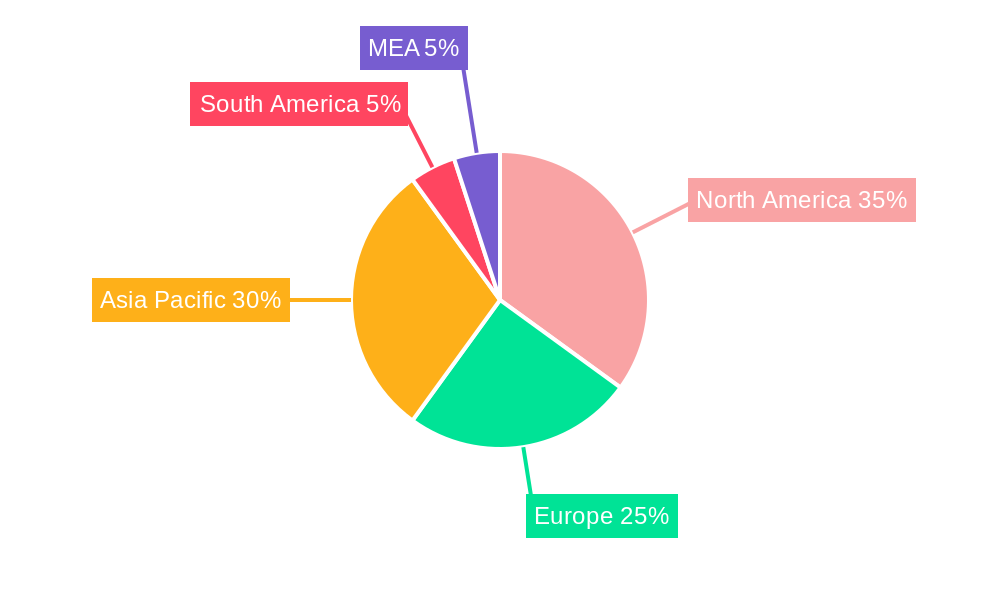
The market segmentation reveals significant opportunities within various application areas. Refractories, leveraging MgO NPs' high melting point and resistance to chemical attack, represent a substantial segment. The construction and ceramics sector benefits from MgO NPs' contribution to improved strength, durability, and thermal insulation in building materials and advanced ceramic components. Electronics applications utilize the material's dielectric properties in advanced capacitors and other electronic components. While North America currently holds a significant market share, the Asia-Pacific region, particularly China and India, is poised for rapid growth due to increasing industrialization and rising investments in infrastructure and technology. Competitive landscape analysis indicates a mix of established players and emerging companies, fostering innovation and driving down costs, ultimately benefiting the wider market. However, potential challenges include concerns regarding the potential toxicity of nanoparticles and the need for stringent safety regulations in manufacturing and handling.
Magnesium Oxide Nanoparticle Market Company Market Share
Magnesium Oxide Nanoparticle Market: A Comprehensive Report (2019-2033)
This comprehensive report provides a detailed analysis of the Magnesium Oxide Nanoparticle market, encompassing market dynamics, growth trends, regional analysis, competitive landscape, and future outlook. The study period covers 2019-2033, with 2025 as the base and estimated year, and 2025-2033 as the forecast period. The report delves into the parent market of nanomaterials and the child market of magnesium oxide nanoparticles, providing a holistic perspective for industry professionals and investors. The market size is projected to reach xx Million units by 2033.
Magnesium Oxide Nanoparticle Market Market Dynamics & Structure
The magnesium oxide nanoparticle market is characterized by moderate concentration, with key players such as US Research Nanomaterials Inc, Nanoshel LLC, American Elements, and others holding significant market share. Technological innovation, particularly in synthesis techniques and functionalization, is a major driver, while regulatory frameworks concerning nanoparticle safety and environmental impact pose both challenges and opportunities. The market witnesses consistent M&A activity, with approximately xx deals recorded in the historical period (2019-2024), primarily driven by consolidation and expansion strategies. Competitive substitutes include other metal oxide nanoparticles and bulk magnesium oxide, though the unique properties of magnesium oxide nanoparticles provide a significant advantage in specific applications. End-user demographics span diverse sectors, each with varying growth potentials.
- Market Concentration: Moderately concentrated, with top 5 players holding approximately xx% market share in 2025.
- Technological Innovation: Focus on improved synthesis methods (e.g., sol-gel, hydrothermal), surface functionalization for enhanced properties.
- Regulatory Landscape: Stringent regulations on nanoparticle safety and environmental impact, varying by region.
- Competitive Substitutes: Bulk magnesium oxide, other metal oxide nanoparticles (e.g., zinc oxide, alumina).
- M&A Activity: Approximately xx M&A deals between 2019-2024, primarily driven by strategic acquisitions and expansion.
- Innovation Barriers: High R&D costs, complexities in scaling-up production, and stringent regulatory compliance.
Magnesium Oxide Nanoparticle Market Growth Trends & Insights
The magnesium oxide nanoparticle market exhibited a CAGR of xx% during the historical period (2019-2024) and is projected to maintain a CAGR of xx% during the forecast period (2025-2033). This growth is fueled by increasing demand across various applications, driven by factors like the growing construction industry, advancements in electronics, and the expanding aerospace sector. Technological disruptions, such as the development of novel synthesis techniques leading to improved nanoparticle quality and cost reduction, are significantly contributing to market expansion. Consumer behavior shifts, particularly a preference for high-performance, eco-friendly materials, further bolster market growth. Market penetration in key segments like refractories and electronics is increasing steadily, indicating strong future potential. The overall market size is expected to reach xx Million units by 2033.
Dominant Regions, Countries, or Segments in Magnesium Oxide Nanoparticle Market
The Asia-Pacific region is currently the dominant market for magnesium oxide nanoparticles, driven by robust economic growth, burgeoning infrastructure development, and a significant manufacturing base. Within this region, China and India are leading consumers. The Refractories segment holds the largest market share, followed by Construction & Ceramics.
- Key Drivers in Asia-Pacific:
- Rapid industrialization and infrastructure development.
- Growing construction sector.
- Expanding electronics and automotive industries.
- Favorable government policies supporting technological advancements.
- Refractories Segment Dominance: High demand due to superior thermal stability and corrosion resistance of magnesium oxide nanoparticles.
- Construction & Ceramics Growth: Increasing adoption in cement and ceramic manufacturing for enhanced strength and durability.
- North America and Europe: Show significant growth potential, driven by increasing adoption in high-tech applications.
Magnesium Oxide Nanoparticle Market Product Landscape
Magnesium oxide nanoparticles are offered in various forms, including powders, dispersions, and coatings, each tailored to specific applications. Key performance metrics include particle size distribution, surface area, purity, and crystallinity. Recent innovations focus on surface functionalization to improve dispersibility and enhance specific properties for targeted applications. Unique selling propositions often center around high purity, consistent quality, and customized particle sizes to meet specific application requirements. Technological advancements are focused on cost-effective and scalable synthesis methods.
Key Drivers, Barriers & Challenges in Magnesium Oxide Nanoparticle Market
Key Drivers: Increasing demand from diverse industries (construction, electronics, aerospace), technological advancements enabling improved synthesis and functionalization, government support for nanotechnology research and development, and growing consumer awareness of sustainable materials.
Challenges: High production costs, stringent safety and environmental regulations, potential health and environmental concerns associated with nanoparticles, and competition from alternative materials. Supply chain disruptions can impact the availability and pricing of raw materials, influencing production costs and profitability. Regulatory hurdles, particularly regarding nanoparticle labeling and safety testing, can pose significant barriers to market entry and growth.
Emerging Opportunities in Magnesium Oxide Nanoparticle Market
Untapped markets in developing economies present significant opportunities for expansion. Innovative applications in biomedical, energy storage, and environmental remediation are emerging. Evolving consumer preferences for sustainable and high-performance materials create strong demand for magnesium oxide nanoparticles.
Growth Accelerators in the Magnesium Oxide Nanoparticle Market Industry
Strategic partnerships between material suppliers and end-users facilitate the development of tailored nanoparticle solutions. Technological breakthroughs in synthesis methods lead to cost-effective production, widening market accessibility. Market expansion strategies, such as geographical diversification and new application development, are crucial for long-term growth.
Key Players Shaping the Magnesium Oxide Nanoparticle Market Market
- US Research Nanomaterials Inc
- Nanoshel LLC
- American Elements
- MKNano
- Reade International Corp
- Reinste Nano Ventures
- Inframat Advanced Materials LLC
- Nanostructured & Amorphous Materials Inc
- MARTIN MARIETTA MAGNESIA SPECIALTIES LLC
- Nanografi Nano Technology
- SkySpring Nanomaterials Inc
Notable Milestones in Magnesium Oxide Nanoparticle Market Sector
- 2020: Introduction of a novel, cost-effective synthesis method by US Research Nanomaterials Inc.
- 2022: Merger between Nanoshel LLC and a smaller competitor, expanding its market reach.
- 2023: Launch of a new high-purity magnesium oxide nanoparticle product by American Elements.
- 2024: Increased regulatory scrutiny regarding the environmental impact of magnesium oxide nanoparticles in Europe.
In-Depth Magnesium Oxide Nanoparticle Market Market Outlook
The magnesium oxide nanoparticle market is poised for substantial growth over the forecast period. Continued technological advancements, strategic collaborations, and expansion into new applications will fuel market expansion. The increasing focus on sustainability and the development of high-performance materials will drive strong demand across various industries. The market presents attractive opportunities for existing players and new entrants, fostering innovation and competition.
Magnesium Oxide Nanoparticle Market Segmentation
-
1. Application
- 1.1. Refractories
- 1.2. Construction & Ceramics
- 1.3. Electronics
- 1.4. Coatings
- 1.5. Aerospace
- 1.6. Oil Products
- 1.7. Others
Magnesium Oxide Nanoparticle Market Segmentation By Geography
-
1. Asia Pacific
- 1.1. China
- 1.2. India
- 1.3. Japan
- 1.4. South Korea
- 1.5. Rest of Asia Pacific
-
2. North America
- 2.1. United States
- 2.2. Canada
- 2.3. Mexico
-
3. Europe
- 3.1. Germany
- 3.2. United Kingdom
- 3.3. Italy
- 3.4. France
- 3.5. Rest of Europe
-
4. South America
- 4.1. Brazil
- 4.2. Argentina
- 4.3. Rest of South America
-
5. Middle East and Africa
- 5.1. Saudi Arabia
- 5.2. South Africa
- 5.3. Rest of Middle East and Africa
Magnesium Oxide Nanoparticle Market Regional Market Share
Geographic Coverage of Magnesium Oxide Nanoparticle Market
Magnesium Oxide Nanoparticle Market REPORT HIGHLIGHTS
| Aspects | Details |
|---|---|
| Study Period | 2020-2034 |
| Base Year | 2025 |
| Estimated Year | 2026 |
| Forecast Period | 2026-2034 |
| Historical Period | 2020-2025 |
| Growth Rate | CAGR of 7.8% from 2020-2034 |
| Segmentation |
|
Table of Contents
- 1. Introduction
- 1.1. Research Scope
- 1.2. Market Segmentation
- 1.3. Research Objective
- 1.4. Definitions and Assumptions
- 2. Executive Summary
- 2.1. Market Snapshot
- 3. Market Dynamics
- 3.1. Market Drivers
- 3.2. Market Restrains
- 3.3. Market Trends
- 3.4. Market Opportunities
- 4. Market Factor Analysis
- 4.1. Porters Five Forces
- 4.1.1. Bargaining Power of Suppliers
- 4.1.2. Bargaining Power of Buyers
- 4.1.3. Threat of New Entrants
- 4.1.4. Threat of Substitutes
- 4.1.5. Competitive Rivalry
- 4.2. PESTEL analysis
- 4.3. BCG Analysis
- 4.3.1. Stars (High Growth, High Market Share)
- 4.3.2. Cash Cows (Low Growth, High Market Share)
- 4.3.3. Question Mark (High Growth, Low Market Share)
- 4.3.4. Dogs (Low Growth, Low Market Share)
- 4.4. Ansoff Matrix Analysis
- 4.5. Supply Chain Analysis
- 4.6. Regulatory Landscape
- 4.7. Current Market Potential and Opportunity Assessment (TAM–SAM–SOM Framework)
- 4.8. VDR Analyst Note
- 4.1. Porters Five Forces
- 5. Market Analysis, Insights and Forecast 2021-2033
- 5.1. Market Analysis, Insights and Forecast - by Application
- 5.1.1. Refractories
- 5.1.2. Construction & Ceramics
- 5.1.3. Electronics
- 5.1.4. Coatings
- 5.1.5. Aerospace
- 5.1.6. Oil Products
- 5.1.7. Others
- 5.2. Market Analysis, Insights and Forecast - by Region
- 5.2.1. Asia Pacific
- 5.2.2. North America
- 5.2.3. Europe
- 5.2.4. South America
- 5.2.5. Middle East and Africa
- 5.1. Market Analysis, Insights and Forecast - by Application
- 6. Global Magnesium Oxide Nanoparticle Market Analysis, Insights and Forecast, 2021-2033
- 6.1. Market Analysis, Insights and Forecast - by Application
- 6.1.1. Refractories
- 6.1.2. Construction & Ceramics
- 6.1.3. Electronics
- 6.1.4. Coatings
- 6.1.5. Aerospace
- 6.1.6. Oil Products
- 6.1.7. Others
- 6.1. Market Analysis, Insights and Forecast - by Application
- 7. Asia Pacific Magnesium Oxide Nanoparticle Market Analysis, Insights and Forecast, 2021-2033
- 7.1. Market Analysis, Insights and Forecast - by Application
- 7.1.1. Refractories
- 7.1.2. Construction & Ceramics
- 7.1.3. Electronics
- 7.1.4. Coatings
- 7.1.5. Aerospace
- 7.1.6. Oil Products
- 7.1.7. Others
- 7.1. Market Analysis, Insights and Forecast - by Application
- 8. North America Magnesium Oxide Nanoparticle Market Analysis, Insights and Forecast, 2021-2033
- 8.1. Market Analysis, Insights and Forecast - by Application
- 8.1.1. Refractories
- 8.1.2. Construction & Ceramics
- 8.1.3. Electronics
- 8.1.4. Coatings
- 8.1.5. Aerospace
- 8.1.6. Oil Products
- 8.1.7. Others
- 8.1. Market Analysis, Insights and Forecast - by Application
- 9. Europe Magnesium Oxide Nanoparticle Market Analysis, Insights and Forecast, 2021-2033
- 9.1. Market Analysis, Insights and Forecast - by Application
- 9.1.1. Refractories
- 9.1.2. Construction & Ceramics
- 9.1.3. Electronics
- 9.1.4. Coatings
- 9.1.5. Aerospace
- 9.1.6. Oil Products
- 9.1.7. Others
- 9.1. Market Analysis, Insights and Forecast - by Application
- 10. South America Magnesium Oxide Nanoparticle Market Analysis, Insights and Forecast, 2021-2033
- 10.1. Market Analysis, Insights and Forecast - by Application
- 10.1.1. Refractories
- 10.1.2. Construction & Ceramics
- 10.1.3. Electronics
- 10.1.4. Coatings
- 10.1.5. Aerospace
- 10.1.6. Oil Products
- 10.1.7. Others
- 10.1. Market Analysis, Insights and Forecast - by Application
- 11. Middle East and Africa Magnesium Oxide Nanoparticle Market Analysis, Insights and Forecast, 2021-2033
- 11.1. Market Analysis, Insights and Forecast - by Application
- 11.1.1. Refractories
- 11.1.2. Construction & Ceramics
- 11.1.3. Electronics
- 11.1.4. Coatings
- 11.1.5. Aerospace
- 11.1.6. Oil Products
- 11.1.7. Others
- 11.1. Market Analysis, Insights and Forecast - by Application
- 12. Competitive Analysis
- 12.1. Company Profiles
- 12.1.1 US Research Nanomaterials Inc
- 12.1.1.1. Company Overview
- 12.1.1.2. Products
- 12.1.1.3. Company Financials
- 12.1.1.4. SWOT Analysis
- 12.1.2 Nanoshel LLC
- 12.1.2.1. Company Overview
- 12.1.2.2. Products
- 12.1.2.3. Company Financials
- 12.1.2.4. SWOT Analysis
- 12.1.3 American Elements
- 12.1.3.1. Company Overview
- 12.1.3.2. Products
- 12.1.3.3. Company Financials
- 12.1.3.4. SWOT Analysis
- 12.1.4 MKNano
- 12.1.4.1. Company Overview
- 12.1.4.2. Products
- 12.1.4.3. Company Financials
- 12.1.4.4. SWOT Analysis
- 12.1.5 Reade International Corp
- 12.1.5.1. Company Overview
- 12.1.5.2. Products
- 12.1.5.3. Company Financials
- 12.1.5.4. SWOT Analysis
- 12.1.6 Reinste Nano Ventures
- 12.1.6.1. Company Overview
- 12.1.6.2. Products
- 12.1.6.3. Company Financials
- 12.1.6.4. SWOT Analysis
- 12.1.7 Inframat Advanced Materials LLC
- 12.1.7.1. Company Overview
- 12.1.7.2. Products
- 12.1.7.3. Company Financials
- 12.1.7.4. SWOT Analysis
- 12.1.8 Nanostructured & Amorphous Materials Inc
- 12.1.8.1. Company Overview
- 12.1.8.2. Products
- 12.1.8.3. Company Financials
- 12.1.8.4. SWOT Analysis
- 12.1.9 MARTIN MARIETTA MAGNESIA SPECIALTIES LLC
- 12.1.9.1. Company Overview
- 12.1.9.2. Products
- 12.1.9.3. Company Financials
- 12.1.9.4. SWOT Analysis
- 12.1.10 Nanografi Nano Technology
- 12.1.10.1. Company Overview
- 12.1.10.2. Products
- 12.1.10.3. Company Financials
- 12.1.10.4. SWOT Analysis
- 12.1.11 SkySpring Nanomaterials Inc
- 12.1.11.1. Company Overview
- 12.1.11.2. Products
- 12.1.11.3. Company Financials
- 12.1.11.4. SWOT Analysis
- 12.1.1 US Research Nanomaterials Inc
- 12.2. Market Entropy
- 12.2.1 Company's Key Areas Served
- 12.2.2 Recent Developments
- 12.3. Company Market Share Analysis 2025
- 12.3.1 Top 5 Companies Market Share Analysis
- 12.3.2 Top 3 Companies Market Share Analysis
- 12.4. List of Potential Customers
- 13. Research Methodology
List of Figures
- Figure 1: Global Magnesium Oxide Nanoparticle Market Revenue Breakdown (Million, %) by Region 2025 & 2033
- Figure 2: Global Magnesium Oxide Nanoparticle Market Volume Breakdown (K Tons, %) by Region 2025 & 2033
- Figure 3: Asia Pacific Magnesium Oxide Nanoparticle Market Revenue (Million), by Application 2025 & 2033
- Figure 4: Asia Pacific Magnesium Oxide Nanoparticle Market Volume (K Tons), by Application 2025 & 2033
- Figure 5: Asia Pacific Magnesium Oxide Nanoparticle Market Revenue Share (%), by Application 2025 & 2033
- Figure 6: Asia Pacific Magnesium Oxide Nanoparticle Market Volume Share (%), by Application 2025 & 2033
- Figure 7: Asia Pacific Magnesium Oxide Nanoparticle Market Revenue (Million), by Country 2025 & 2033
- Figure 8: Asia Pacific Magnesium Oxide Nanoparticle Market Volume (K Tons), by Country 2025 & 2033
- Figure 9: Asia Pacific Magnesium Oxide Nanoparticle Market Revenue Share (%), by Country 2025 & 2033
- Figure 10: Asia Pacific Magnesium Oxide Nanoparticle Market Volume Share (%), by Country 2025 & 2033
- Figure 11: North America Magnesium Oxide Nanoparticle Market Revenue (Million), by Application 2025 & 2033
- Figure 12: North America Magnesium Oxide Nanoparticle Market Volume (K Tons), by Application 2025 & 2033
- Figure 13: North America Magnesium Oxide Nanoparticle Market Revenue Share (%), by Application 2025 & 2033
- Figure 14: North America Magnesium Oxide Nanoparticle Market Volume Share (%), by Application 2025 & 2033
- Figure 15: North America Magnesium Oxide Nanoparticle Market Revenue (Million), by Country 2025 & 2033
- Figure 16: North America Magnesium Oxide Nanoparticle Market Volume (K Tons), by Country 2025 & 2033
- Figure 17: North America Magnesium Oxide Nanoparticle Market Revenue Share (%), by Country 2025 & 2033
- Figure 18: North America Magnesium Oxide Nanoparticle Market Volume Share (%), by Country 2025 & 2033
- Figure 19: Europe Magnesium Oxide Nanoparticle Market Revenue (Million), by Application 2025 & 2033
- Figure 20: Europe Magnesium Oxide Nanoparticle Market Volume (K Tons), by Application 2025 & 2033
- Figure 21: Europe Magnesium Oxide Nanoparticle Market Revenue Share (%), by Application 2025 & 2033
- Figure 22: Europe Magnesium Oxide Nanoparticle Market Volume Share (%), by Application 2025 & 2033
- Figure 23: Europe Magnesium Oxide Nanoparticle Market Revenue (Million), by Country 2025 & 2033
- Figure 24: Europe Magnesium Oxide Nanoparticle Market Volume (K Tons), by Country 2025 & 2033
- Figure 25: Europe Magnesium Oxide Nanoparticle Market Revenue Share (%), by Country 2025 & 2033
- Figure 26: Europe Magnesium Oxide Nanoparticle Market Volume Share (%), by Country 2025 & 2033
- Figure 27: South America Magnesium Oxide Nanoparticle Market Revenue (Million), by Application 2025 & 2033
- Figure 28: South America Magnesium Oxide Nanoparticle Market Volume (K Tons), by Application 2025 & 2033
- Figure 29: South America Magnesium Oxide Nanoparticle Market Revenue Share (%), by Application 2025 & 2033
- Figure 30: South America Magnesium Oxide Nanoparticle Market Volume Share (%), by Application 2025 & 2033
- Figure 31: South America Magnesium Oxide Nanoparticle Market Revenue (Million), by Country 2025 & 2033
- Figure 32: South America Magnesium Oxide Nanoparticle Market Volume (K Tons), by Country 2025 & 2033
- Figure 33: South America Magnesium Oxide Nanoparticle Market Revenue Share (%), by Country 2025 & 2033
- Figure 34: South America Magnesium Oxide Nanoparticle Market Volume Share (%), by Country 2025 & 2033
- Figure 35: Middle East and Africa Magnesium Oxide Nanoparticle Market Revenue (Million), by Application 2025 & 2033
- Figure 36: Middle East and Africa Magnesium Oxide Nanoparticle Market Volume (K Tons), by Application 2025 & 2033
- Figure 37: Middle East and Africa Magnesium Oxide Nanoparticle Market Revenue Share (%), by Application 2025 & 2033
- Figure 38: Middle East and Africa Magnesium Oxide Nanoparticle Market Volume Share (%), by Application 2025 & 2033
- Figure 39: Middle East and Africa Magnesium Oxide Nanoparticle Market Revenue (Million), by Country 2025 & 2033
- Figure 40: Middle East and Africa Magnesium Oxide Nanoparticle Market Volume (K Tons), by Country 2025 & 2033
- Figure 41: Middle East and Africa Magnesium Oxide Nanoparticle Market Revenue Share (%), by Country 2025 & 2033
- Figure 42: Middle East and Africa Magnesium Oxide Nanoparticle Market Volume Share (%), by Country 2025 & 2033
List of Tables
- Table 1: Global Magnesium Oxide Nanoparticle Market Revenue Million Forecast, by Application 2020 & 2033
- Table 2: Global Magnesium Oxide Nanoparticle Market Volume K Tons Forecast, by Application 2020 & 2033
- Table 3: Global Magnesium Oxide Nanoparticle Market Revenue Million Forecast, by Region 2020 & 2033
- Table 4: Global Magnesium Oxide Nanoparticle Market Volume K Tons Forecast, by Region 2020 & 2033
- Table 5: Global Magnesium Oxide Nanoparticle Market Revenue Million Forecast, by Application 2020 & 2033
- Table 6: Global Magnesium Oxide Nanoparticle Market Volume K Tons Forecast, by Application 2020 & 2033
- Table 7: Global Magnesium Oxide Nanoparticle Market Revenue Million Forecast, by Country 2020 & 2033
- Table 8: Global Magnesium Oxide Nanoparticle Market Volume K Tons Forecast, by Country 2020 & 2033
- Table 9: China Magnesium Oxide Nanoparticle Market Revenue (Million) Forecast, by Application 2020 & 2033
- Table 10: China Magnesium Oxide Nanoparticle Market Volume (K Tons) Forecast, by Application 2020 & 2033
- Table 11: India Magnesium Oxide Nanoparticle Market Revenue (Million) Forecast, by Application 2020 & 2033
- Table 12: India Magnesium Oxide Nanoparticle Market Volume (K Tons) Forecast, by Application 2020 & 2033
- Table 13: Japan Magnesium Oxide Nanoparticle Market Revenue (Million) Forecast, by Application 2020 & 2033
- Table 14: Japan Magnesium Oxide Nanoparticle Market Volume (K Tons) Forecast, by Application 2020 & 2033
- Table 15: South Korea Magnesium Oxide Nanoparticle Market Revenue (Million) Forecast, by Application 2020 & 2033
- Table 16: South Korea Magnesium Oxide Nanoparticle Market Volume (K Tons) Forecast, by Application 2020 & 2033
- Table 17: Rest of Asia Pacific Magnesium Oxide Nanoparticle Market Revenue (Million) Forecast, by Application 2020 & 2033
- Table 18: Rest of Asia Pacific Magnesium Oxide Nanoparticle Market Volume (K Tons) Forecast, by Application 2020 & 2033
- Table 19: Global Magnesium Oxide Nanoparticle Market Revenue Million Forecast, by Application 2020 & 2033
- Table 20: Global Magnesium Oxide Nanoparticle Market Volume K Tons Forecast, by Application 2020 & 2033
- Table 21: Global Magnesium Oxide Nanoparticle Market Revenue Million Forecast, by Country 2020 & 2033
- Table 22: Global Magnesium Oxide Nanoparticle Market Volume K Tons Forecast, by Country 2020 & 2033
- Table 23: United States Magnesium Oxide Nanoparticle Market Revenue (Million) Forecast, by Application 2020 & 2033
- Table 24: United States Magnesium Oxide Nanoparticle Market Volume (K Tons) Forecast, by Application 2020 & 2033
- Table 25: Canada Magnesium Oxide Nanoparticle Market Revenue (Million) Forecast, by Application 2020 & 2033
- Table 26: Canada Magnesium Oxide Nanoparticle Market Volume (K Tons) Forecast, by Application 2020 & 2033
- Table 27: Mexico Magnesium Oxide Nanoparticle Market Revenue (Million) Forecast, by Application 2020 & 2033
- Table 28: Mexico Magnesium Oxide Nanoparticle Market Volume (K Tons) Forecast, by Application 2020 & 2033
- Table 29: Global Magnesium Oxide Nanoparticle Market Revenue Million Forecast, by Application 2020 & 2033
- Table 30: Global Magnesium Oxide Nanoparticle Market Volume K Tons Forecast, by Application 2020 & 2033
- Table 31: Global Magnesium Oxide Nanoparticle Market Revenue Million Forecast, by Country 2020 & 2033
- Table 32: Global Magnesium Oxide Nanoparticle Market Volume K Tons Forecast, by Country 2020 & 2033
- Table 33: Germany Magnesium Oxide Nanoparticle Market Revenue (Million) Forecast, by Application 2020 & 2033
- Table 34: Germany Magnesium Oxide Nanoparticle Market Volume (K Tons) Forecast, by Application 2020 & 2033
- Table 35: United Kingdom Magnesium Oxide Nanoparticle Market Revenue (Million) Forecast, by Application 2020 & 2033
- Table 36: United Kingdom Magnesium Oxide Nanoparticle Market Volume (K Tons) Forecast, by Application 2020 & 2033
- Table 37: Italy Magnesium Oxide Nanoparticle Market Revenue (Million) Forecast, by Application 2020 & 2033
- Table 38: Italy Magnesium Oxide Nanoparticle Market Volume (K Tons) Forecast, by Application 2020 & 2033
- Table 39: France Magnesium Oxide Nanoparticle Market Revenue (Million) Forecast, by Application 2020 & 2033
- Table 40: France Magnesium Oxide Nanoparticle Market Volume (K Tons) Forecast, by Application 2020 & 2033
- Table 41: Rest of Europe Magnesium Oxide Nanoparticle Market Revenue (Million) Forecast, by Application 2020 & 2033
- Table 42: Rest of Europe Magnesium Oxide Nanoparticle Market Volume (K Tons) Forecast, by Application 2020 & 2033
- Table 43: Global Magnesium Oxide Nanoparticle Market Revenue Million Forecast, by Application 2020 & 2033
- Table 44: Global Magnesium Oxide Nanoparticle Market Volume K Tons Forecast, by Application 2020 & 2033
- Table 45: Global Magnesium Oxide Nanoparticle Market Revenue Million Forecast, by Country 2020 & 2033
- Table 46: Global Magnesium Oxide Nanoparticle Market Volume K Tons Forecast, by Country 2020 & 2033
- Table 47: Brazil Magnesium Oxide Nanoparticle Market Revenue (Million) Forecast, by Application 2020 & 2033
- Table 48: Brazil Magnesium Oxide Nanoparticle Market Volume (K Tons) Forecast, by Application 2020 & 2033
- Table 49: Argentina Magnesium Oxide Nanoparticle Market Revenue (Million) Forecast, by Application 2020 & 2033
- Table 50: Argentina Magnesium Oxide Nanoparticle Market Volume (K Tons) Forecast, by Application 2020 & 2033
- Table 51: Rest of South America Magnesium Oxide Nanoparticle Market Revenue (Million) Forecast, by Application 2020 & 2033
- Table 52: Rest of South America Magnesium Oxide Nanoparticle Market Volume (K Tons) Forecast, by Application 2020 & 2033
- Table 53: Global Magnesium Oxide Nanoparticle Market Revenue Million Forecast, by Application 2020 & 2033
- Table 54: Global Magnesium Oxide Nanoparticle Market Volume K Tons Forecast, by Application 2020 & 2033
- Table 55: Global Magnesium Oxide Nanoparticle Market Revenue Million Forecast, by Country 2020 & 2033
- Table 56: Global Magnesium Oxide Nanoparticle Market Volume K Tons Forecast, by Country 2020 & 2033
- Table 57: Saudi Arabia Magnesium Oxide Nanoparticle Market Revenue (Million) Forecast, by Application 2020 & 2033
- Table 58: Saudi Arabia Magnesium Oxide Nanoparticle Market Volume (K Tons) Forecast, by Application 2020 & 2033
- Table 59: South Africa Magnesium Oxide Nanoparticle Market Revenue (Million) Forecast, by Application 2020 & 2033
- Table 60: South Africa Magnesium Oxide Nanoparticle Market Volume (K Tons) Forecast, by Application 2020 & 2033
- Table 61: Rest of Middle East and Africa Magnesium Oxide Nanoparticle Market Revenue (Million) Forecast, by Application 2020 & 2033
- Table 62: Rest of Middle East and Africa Magnesium Oxide Nanoparticle Market Volume (K Tons) Forecast, by Application 2020 & 2033
Frequently Asked Questions
1. What is the projected Compound Annual Growth Rate (CAGR) of the Magnesium Oxide Nanoparticle Market?
The projected CAGR is approximately 7.8%.
2. Which companies are prominent players in the Magnesium Oxide Nanoparticle Market?
Key companies in the market include US Research Nanomaterials Inc, Nanoshel LLC, American Elements, MKNano, Reade International Corp, Reinste Nano Ventures, Inframat Advanced Materials LLC, Nanostructured & Amorphous Materials Inc, MARTIN MARIETTA MAGNESIA SPECIALTIES LLC, Nanografi Nano Technology, SkySpring Nanomaterials Inc.
3. What are the main segments of the Magnesium Oxide Nanoparticle Market?
The market segments include Application.
4. Can you provide details about the market size?
The market size is estimated to be USD 55.35 Million as of 2022.
5. What are some drivers contributing to market growth?
; Increasing Demand from Refractories Segment; Rising Demand from Electronics Segment.
6. What are the notable trends driving market growth?
Increasing Demand from Refractories Segment.
7. Are there any restraints impacting market growth?
; High Production Cost Associated with Product; Unfavourable Conditions Arising Due to COVID-19 Outbreak.
8. Can you provide examples of recent developments in the market?
N/A
9. What pricing options are available for accessing the report?
Pricing options include single-user, multi-user, and enterprise licenses priced at USD 4750, USD 5250, and USD 8750 respectively.
10. Is the market size provided in terms of value or volume?
The market size is provided in terms of value, measured in Million and volume, measured in K Tons.
11. Are there any specific market keywords associated with the report?
Yes, the market keyword associated with the report is "Magnesium Oxide Nanoparticle Market," which aids in identifying and referencing the specific market segment covered.
12. How do I determine which pricing option suits my needs best?
The pricing options vary based on user requirements and access needs. Individual users may opt for single-user licenses, while businesses requiring broader access may choose multi-user or enterprise licenses for cost-effective access to the report.
13. Are there any additional resources or data provided in the Magnesium Oxide Nanoparticle Market report?
While the report offers comprehensive insights, it's advisable to review the specific contents or supplementary materials provided to ascertain if additional resources or data are available.
14. How can I stay updated on further developments or reports in the Magnesium Oxide Nanoparticle Market?
To stay informed about further developments, trends, and reports in the Magnesium Oxide Nanoparticle Market, consider subscribing to industry newsletters, following relevant companies and organizations, or regularly checking reputable industry news sources and publications.
Methodology
Step 1 - Identification of Relevant Samples Size from Population Database


Step 2 - Approaches for Defining Global Market Size (Value, Volume* & Price*)

Note*: In applicable scenarios
Step 3 - Data Sources
Primary Research
- Web Analytics
- Survey Reports
- Research Institute
- Latest Research Reports
- Opinion Leaders
Secondary Research
- Annual Reports
- White Paper
- Latest Press Release
- Industry Association
- Paid Database
- Investor Presentations

Step 4 - Data Triangulation
Involves using different sources of information in order to increase the validity of a study
These sources are likely to be stakeholders in a program - participants, other researchers, program staff, other community members, and so on.
Then we put all data in single framework & apply various statistical tools to find out the dynamic on the market.
During the analysis stage, feedback from the stakeholder groups would be compared to determine areas of agreement as well as areas of divergence