
Key Insights
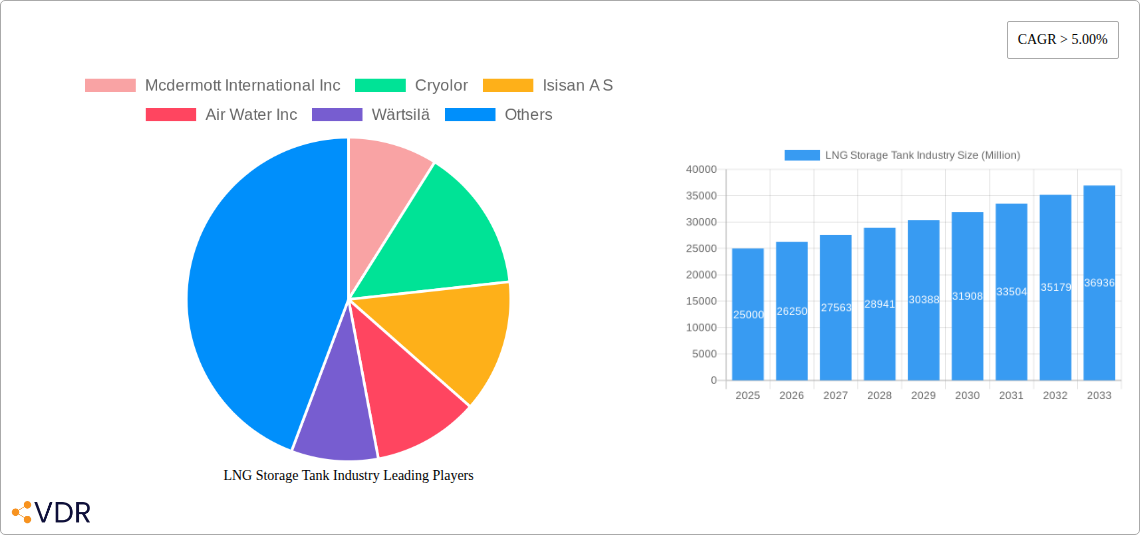
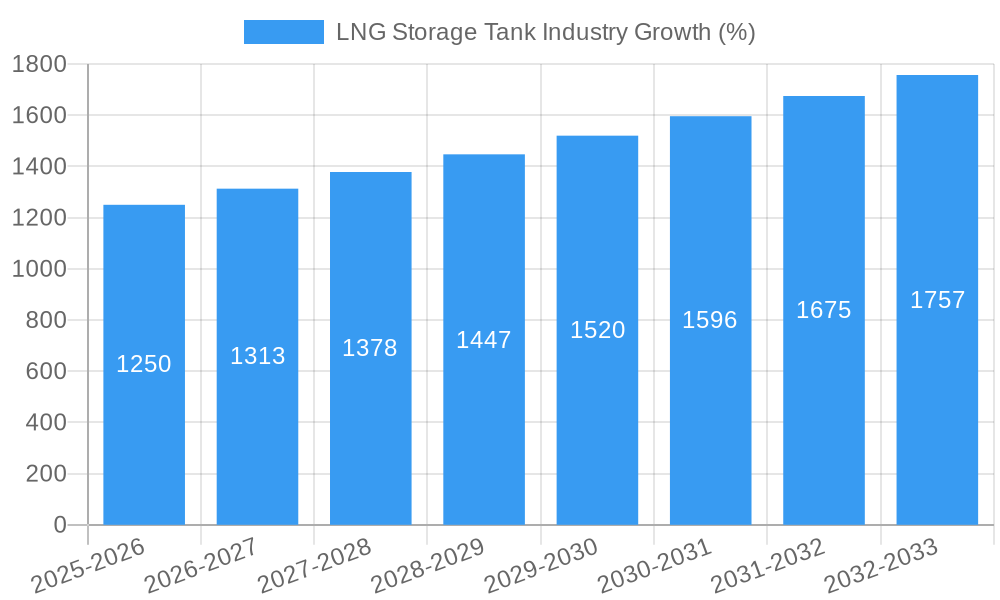
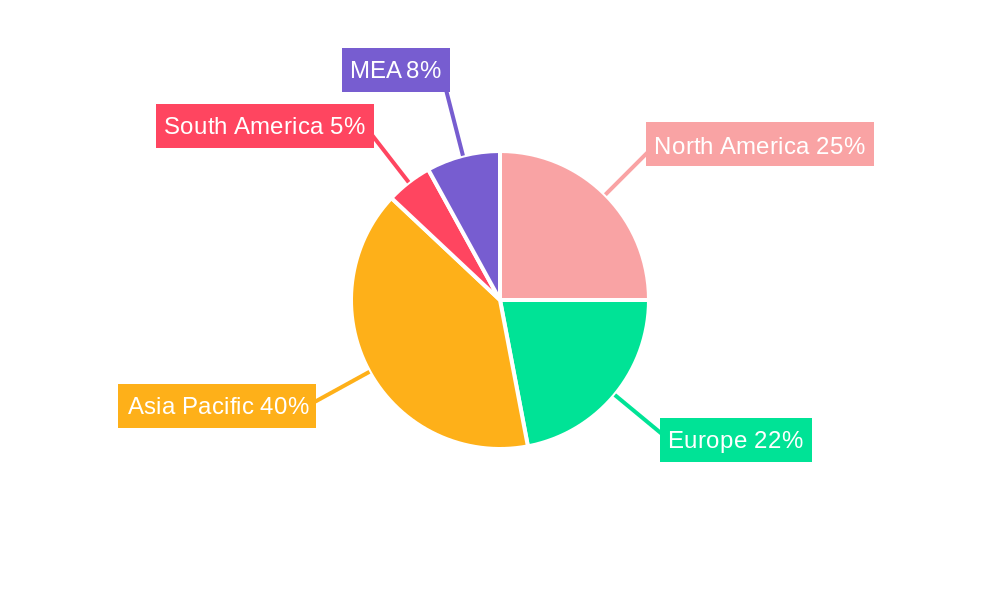
The LNG Storage Tank market is experiencing robust growth, projected to maintain a Compound Annual Growth Rate (CAGR) exceeding 5% from 2025 to 2033. This expansion is fueled by several key factors. The increasing global demand for liquefied natural gas (LNG) as a cleaner-burning fossil fuel is a primary driver. Stringent environmental regulations globally are pushing a transition away from traditional fossil fuels towards LNG, further stimulating market growth. Moreover, advancements in tank technology, including the development of more efficient and cost-effective self-supporting and non-self-supporting designs using materials like steel, 9% Nickel Steel, and aluminum alloys, are contributing to market expansion. The geographical diversification of LNG production and consumption is also playing a significant role. Asia-Pacific, driven by rapidly growing economies like China and India, is anticipated to be a key growth region, followed by North America and Europe. However, the market faces certain constraints including high initial investment costs associated with LNG storage infrastructure and fluctuating LNG prices, which can impact investment decisions.
The market segmentation reveals a dynamic landscape. Self-supporting tanks are likely to hold a larger market share compared to non-self-supporting tanks due to their structural advantages and suitability for various applications. Steel remains the dominant material, though the adoption of 9% Nickel steel and aluminum alloys is expected to increase due to their superior cryogenic properties and corrosion resistance. Key players such as McDermott International Inc., Cryolor, and Chart Industries are driving innovation and capturing market share through strategic partnerships, technological advancements, and geographic expansion. The competitive landscape is characterized by both established players and emerging companies, fostering a dynamic environment of innovation and competition. Future growth will be driven by ongoing technological improvements, expanding LNG infrastructure, and supportive government policies aimed at promoting cleaner energy sources.
LNG Storage Tank Industry Market Report: 2019-2033
This comprehensive report provides an in-depth analysis of the LNG Storage Tank industry, encompassing market dynamics, growth trends, regional insights, product landscape, and key player strategies. The report covers the historical period (2019-2024), base year (2025), and forecast period (2025-2033), offering valuable insights for industry professionals, investors, and strategic decision-makers. The parent market is the broader energy storage sector, while the child market is specifically LNG storage solutions. Market values are presented in Million units.
LNG Storage Tank Industry Market Dynamics & Structure
The LNG Storage Tank market is characterized by moderate concentration, with key players holding significant market share. Technological innovation, driven by the need for enhanced efficiency, safety, and environmental sustainability, is a primary growth driver. Stringent regulatory frameworks concerning safety and emissions significantly impact market dynamics. Competitive product substitutes, such as alternative energy storage solutions, pose a challenge, although LNG's established role in energy transportation mitigates this. End-user demographics are primarily energy companies, industrial facilities, and liquefied gas transportation companies. M&A activity in the sector has been moderate (xx deals in the last five years, representing xx% of market value), driven by consolidation and expansion strategies.
- Market Concentration: Moderately concentrated, with top 5 players holding approximately xx% market share.
- Technological Innovation: Focus on advanced materials (e.g., 9% Nickel Steel, Aluminum Alloys), improved insulation, and automation.
- Regulatory Framework: Stringent safety and environmental regulations influence design and operational aspects.
- Competitive Substitutes: Alternative energy storage solutions represent a growing competitive threat.
- End-User Demographics: Primarily energy companies, industrial users, and LNG transportation firms.
- M&A Trends: Moderate activity driven by consolidation and expansion strategies.
LNG Storage Tank Industry Growth Trends & Insights
The LNG Storage Tank market is projected to exhibit robust growth throughout the forecast period. Driven by increasing global demand for natural gas and the expansion of LNG infrastructure, the market size is expected to reach xx Million units by 2033, registering a CAGR of xx% from 2025 to 2033. This growth reflects rising adoption rates in emerging economies, coupled with technological disruptions that enhance efficiency and reduce costs. Shifting consumer behavior towards cleaner energy sources also fuels demand for efficient LNG storage solutions. Market penetration is expected to increase significantly in developing regions.
Dominant Regions, Countries, or Segments in LNG Storage Tank Industry
The Asia-Pacific region is currently the dominant market for LNG storage tanks, driven by rapidly growing energy demand and significant investments in LNG infrastructure. North America and Europe also hold substantial market share. Among product types, self-supporting tanks are more prevalent, while steel remains the dominant material type due to its cost-effectiveness and availability.
- Key Growth Drivers:
- Rapidly growing energy demand in Asia-Pacific.
- Investments in LNG infrastructure globally.
- Favorable government policies supporting LNG adoption.
- Dominant Segments:
- Region: Asia-Pacific (xx% market share in 2025)
- Product Type: Self-supporting tanks (xx% market share in 2025)
- Material Type: Steel (xx% market share in 2025)
LNG Storage Tank Industry Product Landscape
The LNG storage tank market offers a range of products, including self-supporting and non-self-supporting tanks constructed from various materials, such as steel, 9% nickel steel, and aluminum alloys. Recent innovations focus on improved insulation techniques, advanced materials for enhanced cryogenic performance, and integrated monitoring systems for enhanced safety and operational efficiency. Key selling propositions include enhanced durability, reduced maintenance costs, and improved environmental performance. Technological advancements are focused on optimizing energy efficiency and minimizing environmental impact.
Key Drivers, Barriers & Challenges in LNG Storage Tank Industry
Key Drivers:
- Increasing global demand for natural gas.
- Expansion of LNG infrastructure, particularly in developing economies.
- Growing investments in renewable energy projects requiring LNG storage.
- Stringent environmental regulations promoting efficient storage solutions.
Key Challenges:
- High initial investment costs for large-scale storage facilities.
- Potential supply chain disruptions impacting material availability.
- Regulatory hurdles and permitting processes for new projects.
- Intense competition from existing players and alternative storage solutions. This competition reduces profit margins by approximately xx% annually.
Emerging Opportunities in LNG Storage Tank Industry
Emerging opportunities lie in:
- Expanding into untapped markets in developing economies.
- Development of smaller, modular storage units for decentralized applications.
- Innovative applications in areas like LNG bunkering for maritime transport.
- Adoption of advanced materials and technologies to improve efficiency and sustainability.
Growth Accelerators in the LNG Storage Tank Industry
Long-term growth will be fueled by technological breakthroughs in materials science and cryogenic engineering, enabling the development of more efficient and cost-effective storage solutions. Strategic partnerships between manufacturers, energy companies, and infrastructure developers will play a crucial role. Market expansion into new regions and the development of innovative applications will further accelerate market growth.
Key Players Shaping the LNG Storage Tank Industry Market
- McDermott International Inc
- Cryolor
- Isisan A S
- Air Water Inc
- Wärtsilä
- Linde Plc
- CIMC Enric
- Chart Industries
- IHI Corporation
- Inox India
Notable Milestones in LNG Storage Tank Industry Sector
- April 2022: Linde announces expansion of its La Porte, Texas facility, doubling merchant liquid production capacity by 2024, boosting LNG supply in the U.S. Gulf Coast.
- May 2022: CIMC Enric successfully develops China's first large-scale liquid helium storage tank container, signifying a significant advancement in domestic manufacturing capabilities.
In-Depth LNG Storage Tank Industry Market Outlook
The LNG Storage Tank market is poised for continued growth, driven by global energy demand, expanding LNG infrastructure, and technological advancements. Strategic opportunities lie in capitalizing on emerging markets, developing innovative solutions, and fostering strategic partnerships. The market's future potential is significant, with substantial growth projected across various regions and segments, offering attractive investment prospects and driving further innovation in the sector.
LNG Storage Tank Industry Segmentation
-
1. Product Type
- 1.1. Self-Supporting Tanks
- 1.2. Non-Self Supporting Tanks
-
2. Material Type
- 2.1. Steel
- 2.2. 9% Nickel Steel
- 2.3. Aluminium Alloys
- 2.4. Other
LNG Storage Tank Industry Segmentation By Geography
-
1. North America
- 1.1. US
- 1.2. Canada
- 1.3. Mexico
-
2. Europe
- 2.1. Germany
- 2.2. UK
- 2.3. France
- 2.4. Russia
- 2.5. Spain
- 2.6. Rest of Europe
-
3. Asia Pacific
- 3.1. India
- 3.2. China
- 3.3. Japan
- 3.4. Singapore
- 3.5. Malaysia
- 3.6. South Korea
- 3.7. Australia
- 3.8. Rest of Asia Pacific
-
4. South America
- 4.1. Brazil
- 4.2. Argentina
- 4.3. Rest of South America
- 5. Middle East
-
6. UAE
- 6.1. Saudi Arabia
- 6.2. South Africa
- 6.3. Rest of Middle East
LNG Storage Tank Industry REPORT HIGHLIGHTS
| Aspects | Details |
|---|---|
| Study Period | 2019-2033 |
| Base Year | 2024 |
| Estimated Year | 2025 |
| Forecast Period | 2025-2033 |
| Historical Period | 2019-2024 |
| Growth Rate | CAGR of > 5.00% from 2019-2033 |
| Segmentation |
|
Table of Contents
- 1. Introduction
- 1.1. Research Scope
- 1.2. Market Segmentation
- 1.3. Research Methodology
- 1.4. Definitions and Assumptions
- 2. Executive Summary
- 2.1. Introduction
- 3. Market Dynamics
- 3.1. Introduction
- 3.2. Market Drivers
- 3.2.1. 4.; Increasing Demand From Refining And Industrial Sector4.; Favourable Government Policies
- 3.3. Market Restrains
- 3.3.1. 4.; High Capital Costs For Hydrogen Energy Storage
- 3.4. Market Trends
- 3.4.1. Increasing demand for LNG
- 4. Market Factor Analysis
- 4.1. Porters Five Forces
- 4.2. Supply/Value Chain
- 4.3. PESTEL analysis
- 4.4. Market Entropy
- 4.5. Patent/Trademark Analysis
- 5. Global LNG Storage Tank Industry Analysis, Insights and Forecast, 2019-2031
- 5.1. Market Analysis, Insights and Forecast - by Product Type
- 5.1.1. Self-Supporting Tanks
- 5.1.2. Non-Self Supporting Tanks
- 5.2. Market Analysis, Insights and Forecast - by Material Type
- 5.2.1. Steel
- 5.2.2. 9% Nickel Steel
- 5.2.3. Aluminium Alloys
- 5.2.4. Other
- 5.3. Market Analysis, Insights and Forecast - by Region
- 5.3.1. North America
- 5.3.2. Europe
- 5.3.3. Asia Pacific
- 5.3.4. South America
- 5.3.5. Middle East
- 5.3.6. UAE
- 5.1. Market Analysis, Insights and Forecast - by Product Type
- 6. North America LNG Storage Tank Industry Analysis, Insights and Forecast, 2019-2031
- 6.1. Market Analysis, Insights and Forecast - by Product Type
- 6.1.1. Self-Supporting Tanks
- 6.1.2. Non-Self Supporting Tanks
- 6.2. Market Analysis, Insights and Forecast - by Material Type
- 6.2.1. Steel
- 6.2.2. 9% Nickel Steel
- 6.2.3. Aluminium Alloys
- 6.2.4. Other
- 6.1. Market Analysis, Insights and Forecast - by Product Type
- 7. Europe LNG Storage Tank Industry Analysis, Insights and Forecast, 2019-2031
- 7.1. Market Analysis, Insights and Forecast - by Product Type
- 7.1.1. Self-Supporting Tanks
- 7.1.2. Non-Self Supporting Tanks
- 7.2. Market Analysis, Insights and Forecast - by Material Type
- 7.2.1. Steel
- 7.2.2. 9% Nickel Steel
- 7.2.3. Aluminium Alloys
- 7.2.4. Other
- 7.1. Market Analysis, Insights and Forecast - by Product Type
- 8. Asia Pacific LNG Storage Tank Industry Analysis, Insights and Forecast, 2019-2031
- 8.1. Market Analysis, Insights and Forecast - by Product Type
- 8.1.1. Self-Supporting Tanks
- 8.1.2. Non-Self Supporting Tanks
- 8.2. Market Analysis, Insights and Forecast - by Material Type
- 8.2.1. Steel
- 8.2.2. 9% Nickel Steel
- 8.2.3. Aluminium Alloys
- 8.2.4. Other
- 8.1. Market Analysis, Insights and Forecast - by Product Type
- 9. South America LNG Storage Tank Industry Analysis, Insights and Forecast, 2019-2031
- 9.1. Market Analysis, Insights and Forecast - by Product Type
- 9.1.1. Self-Supporting Tanks
- 9.1.2. Non-Self Supporting Tanks
- 9.2. Market Analysis, Insights and Forecast - by Material Type
- 9.2.1. Steel
- 9.2.2. 9% Nickel Steel
- 9.2.3. Aluminium Alloys
- 9.2.4. Other
- 9.1. Market Analysis, Insights and Forecast - by Product Type
- 10. Middle East LNG Storage Tank Industry Analysis, Insights and Forecast, 2019-2031
- 10.1. Market Analysis, Insights and Forecast - by Product Type
- 10.1.1. Self-Supporting Tanks
- 10.1.2. Non-Self Supporting Tanks
- 10.2. Market Analysis, Insights and Forecast - by Material Type
- 10.2.1. Steel
- 10.2.2. 9% Nickel Steel
- 10.2.3. Aluminium Alloys
- 10.2.4. Other
- 10.1. Market Analysis, Insights and Forecast - by Product Type
- 11. UAE LNG Storage Tank Industry Analysis, Insights and Forecast, 2019-2031
- 11.1. Market Analysis, Insights and Forecast - by Product Type
- 11.1.1. Self-Supporting Tanks
- 11.1.2. Non-Self Supporting Tanks
- 11.2. Market Analysis, Insights and Forecast - by Material Type
- 11.2.1. Steel
- 11.2.2. 9% Nickel Steel
- 11.2.3. Aluminium Alloys
- 11.2.4. Other
- 11.1. Market Analysis, Insights and Forecast - by Product Type
- 12. North America LNG Storage Tank Industry Analysis, Insights and Forecast, 2019-2031
- 12.1. Market Analysis, Insights and Forecast - By Country/Sub-region
- 12.1.1 US
- 12.1.2 Canada
- 12.1.3 Mexico
- 13. Europe LNG Storage Tank Industry Analysis, Insights and Forecast, 2019-2031
- 13.1. Market Analysis, Insights and Forecast - By Country/Sub-region
- 13.1.1 Germany
- 13.1.2 UK
- 13.1.3 France
- 13.1.4 Russia
- 13.1.5 Spain
- 13.1.6 Rest of Europe
- 14. Asia Pacific LNG Storage Tank Industry Analysis, Insights and Forecast, 2019-2031
- 14.1. Market Analysis, Insights and Forecast - By Country/Sub-region
- 14.1.1 India
- 14.1.2 China
- 14.1.3 Japan
- 14.1.4 Singapore
- 14.1.5 Malaysia
- 14.1.6 South Korea
- 14.1.7 Australia
- 14.1.8 Rest of Asia Pacific
- 15. South America LNG Storage Tank Industry Analysis, Insights and Forecast, 2019-2031
- 15.1. Market Analysis, Insights and Forecast - By Country/Sub-region
- 15.1.1 Brazil
- 15.1.2 Argentina
- 15.1.3 Rest of South America
- 16. MEA LNG Storage Tank Industry Analysis, Insights and Forecast, 2019-2031
- 16.1. Market Analysis, Insights and Forecast - By Country/Sub-region
- 16.1.1 United Arab Emirates
- 16.1.2 Saudi Arabia
- 16.1.3 South Africa
- 16.1.4 Rest of Middle East and Africa
- 17. Competitive Analysis
- 17.1. Global Market Share Analysis 2024
- 17.2. Company Profiles
- 17.2.1 Mcdermott International Inc
- 17.2.1.1. Overview
- 17.2.1.2. Products
- 17.2.1.3. SWOT Analysis
- 17.2.1.4. Recent Developments
- 17.2.1.5. Financials (Based on Availability)
- 17.2.2 Cryolor
- 17.2.2.1. Overview
- 17.2.2.2. Products
- 17.2.2.3. SWOT Analysis
- 17.2.2.4. Recent Developments
- 17.2.2.5. Financials (Based on Availability)
- 17.2.3 Isisan A S
- 17.2.3.1. Overview
- 17.2.3.2. Products
- 17.2.3.3. SWOT Analysis
- 17.2.3.4. Recent Developments
- 17.2.3.5. Financials (Based on Availability)
- 17.2.4 Air Water Inc
- 17.2.4.1. Overview
- 17.2.4.2. Products
- 17.2.4.3. SWOT Analysis
- 17.2.4.4. Recent Developments
- 17.2.4.5. Financials (Based on Availability)
- 17.2.5 Wärtsilä
- 17.2.5.1. Overview
- 17.2.5.2. Products
- 17.2.5.3. SWOT Analysis
- 17.2.5.4. Recent Developments
- 17.2.5.5. Financials (Based on Availability)
- 17.2.6 Linde Plc
- 17.2.6.1. Overview
- 17.2.6.2. Products
- 17.2.6.3. SWOT Analysis
- 17.2.6.4. Recent Developments
- 17.2.6.5. Financials (Based on Availability)
- 17.2.7 Cimc Enric
- 17.2.7.1. Overview
- 17.2.7.2. Products
- 17.2.7.3. SWOT Analysis
- 17.2.7.4. Recent Developments
- 17.2.7.5. Financials (Based on Availability)
- 17.2.8 Chart Industries
- 17.2.8.1. Overview
- 17.2.8.2. Products
- 17.2.8.3. SWOT Analysis
- 17.2.8.4. Recent Developments
- 17.2.8.5. Financials (Based on Availability)
- 17.2.9 IHI Corporation
- 17.2.9.1. Overview
- 17.2.9.2. Products
- 17.2.9.3. SWOT Analysis
- 17.2.9.4. Recent Developments
- 17.2.9.5. Financials (Based on Availability)
- 17.2.10 Inox India
- 17.2.10.1. Overview
- 17.2.10.2. Products
- 17.2.10.3. SWOT Analysis
- 17.2.10.4. Recent Developments
- 17.2.10.5. Financials (Based on Availability)
- 17.2.1 Mcdermott International Inc
List of Figures
- Figure 1: Global LNG Storage Tank Industry Revenue Breakdown (Million, %) by Region 2024 & 2032
- Figure 2: Global LNG Storage Tank Industry Volume Breakdown (Litre, %) by Region 2024 & 2032
- Figure 3: North America LNG Storage Tank Industry Revenue (Million), by Country 2024 & 2032
- Figure 4: North America LNG Storage Tank Industry Volume (Litre), by Country 2024 & 2032
- Figure 5: North America LNG Storage Tank Industry Revenue Share (%), by Country 2024 & 2032
- Figure 6: North America LNG Storage Tank Industry Volume Share (%), by Country 2024 & 2032
- Figure 7: Europe LNG Storage Tank Industry Revenue (Million), by Country 2024 & 2032
- Figure 8: Europe LNG Storage Tank Industry Volume (Litre), by Country 2024 & 2032
- Figure 9: Europe LNG Storage Tank Industry Revenue Share (%), by Country 2024 & 2032
- Figure 10: Europe LNG Storage Tank Industry Volume Share (%), by Country 2024 & 2032
- Figure 11: Asia Pacific LNG Storage Tank Industry Revenue (Million), by Country 2024 & 2032
- Figure 12: Asia Pacific LNG Storage Tank Industry Volume (Litre), by Country 2024 & 2032
- Figure 13: Asia Pacific LNG Storage Tank Industry Revenue Share (%), by Country 2024 & 2032
- Figure 14: Asia Pacific LNG Storage Tank Industry Volume Share (%), by Country 2024 & 2032
- Figure 15: South America LNG Storage Tank Industry Revenue (Million), by Country 2024 & 2032
- Figure 16: South America LNG Storage Tank Industry Volume (Litre), by Country 2024 & 2032
- Figure 17: South America LNG Storage Tank Industry Revenue Share (%), by Country 2024 & 2032
- Figure 18: South America LNG Storage Tank Industry Volume Share (%), by Country 2024 & 2032
- Figure 19: MEA LNG Storage Tank Industry Revenue (Million), by Country 2024 & 2032
- Figure 20: MEA LNG Storage Tank Industry Volume (Litre), by Country 2024 & 2032
- Figure 21: MEA LNG Storage Tank Industry Revenue Share (%), by Country 2024 & 2032
- Figure 22: MEA LNG Storage Tank Industry Volume Share (%), by Country 2024 & 2032
- Figure 23: North America LNG Storage Tank Industry Revenue (Million), by Product Type 2024 & 2032
- Figure 24: North America LNG Storage Tank Industry Volume (Litre), by Product Type 2024 & 2032
- Figure 25: North America LNG Storage Tank Industry Revenue Share (%), by Product Type 2024 & 2032
- Figure 26: North America LNG Storage Tank Industry Volume Share (%), by Product Type 2024 & 2032
- Figure 27: North America LNG Storage Tank Industry Revenue (Million), by Material Type 2024 & 2032
- Figure 28: North America LNG Storage Tank Industry Volume (Litre), by Material Type 2024 & 2032
- Figure 29: North America LNG Storage Tank Industry Revenue Share (%), by Material Type 2024 & 2032
- Figure 30: North America LNG Storage Tank Industry Volume Share (%), by Material Type 2024 & 2032
- Figure 31: North America LNG Storage Tank Industry Revenue (Million), by Country 2024 & 2032
- Figure 32: North America LNG Storage Tank Industry Volume (Litre), by Country 2024 & 2032
- Figure 33: North America LNG Storage Tank Industry Revenue Share (%), by Country 2024 & 2032
- Figure 34: North America LNG Storage Tank Industry Volume Share (%), by Country 2024 & 2032
- Figure 35: Europe LNG Storage Tank Industry Revenue (Million), by Product Type 2024 & 2032
- Figure 36: Europe LNG Storage Tank Industry Volume (Litre), by Product Type 2024 & 2032
- Figure 37: Europe LNG Storage Tank Industry Revenue Share (%), by Product Type 2024 & 2032
- Figure 38: Europe LNG Storage Tank Industry Volume Share (%), by Product Type 2024 & 2032
- Figure 39: Europe LNG Storage Tank Industry Revenue (Million), by Material Type 2024 & 2032
- Figure 40: Europe LNG Storage Tank Industry Volume (Litre), by Material Type 2024 & 2032
- Figure 41: Europe LNG Storage Tank Industry Revenue Share (%), by Material Type 2024 & 2032
- Figure 42: Europe LNG Storage Tank Industry Volume Share (%), by Material Type 2024 & 2032
- Figure 43: Europe LNG Storage Tank Industry Revenue (Million), by Country 2024 & 2032
- Figure 44: Europe LNG Storage Tank Industry Volume (Litre), by Country 2024 & 2032
- Figure 45: Europe LNG Storage Tank Industry Revenue Share (%), by Country 2024 & 2032
- Figure 46: Europe LNG Storage Tank Industry Volume Share (%), by Country 2024 & 2032
- Figure 47: Asia Pacific LNG Storage Tank Industry Revenue (Million), by Product Type 2024 & 2032
- Figure 48: Asia Pacific LNG Storage Tank Industry Volume (Litre), by Product Type 2024 & 2032
- Figure 49: Asia Pacific LNG Storage Tank Industry Revenue Share (%), by Product Type 2024 & 2032
- Figure 50: Asia Pacific LNG Storage Tank Industry Volume Share (%), by Product Type 2024 & 2032
- Figure 51: Asia Pacific LNG Storage Tank Industry Revenue (Million), by Material Type 2024 & 2032
- Figure 52: Asia Pacific LNG Storage Tank Industry Volume (Litre), by Material Type 2024 & 2032
- Figure 53: Asia Pacific LNG Storage Tank Industry Revenue Share (%), by Material Type 2024 & 2032
- Figure 54: Asia Pacific LNG Storage Tank Industry Volume Share (%), by Material Type 2024 & 2032
- Figure 55: Asia Pacific LNG Storage Tank Industry Revenue (Million), by Country 2024 & 2032
- Figure 56: Asia Pacific LNG Storage Tank Industry Volume (Litre), by Country 2024 & 2032
- Figure 57: Asia Pacific LNG Storage Tank Industry Revenue Share (%), by Country 2024 & 2032
- Figure 58: Asia Pacific LNG Storage Tank Industry Volume Share (%), by Country 2024 & 2032
- Figure 59: South America LNG Storage Tank Industry Revenue (Million), by Product Type 2024 & 2032
- Figure 60: South America LNG Storage Tank Industry Volume (Litre), by Product Type 2024 & 2032
- Figure 61: South America LNG Storage Tank Industry Revenue Share (%), by Product Type 2024 & 2032
- Figure 62: South America LNG Storage Tank Industry Volume Share (%), by Product Type 2024 & 2032
- Figure 63: South America LNG Storage Tank Industry Revenue (Million), by Material Type 2024 & 2032
- Figure 64: South America LNG Storage Tank Industry Volume (Litre), by Material Type 2024 & 2032
- Figure 65: South America LNG Storage Tank Industry Revenue Share (%), by Material Type 2024 & 2032
- Figure 66: South America LNG Storage Tank Industry Volume Share (%), by Material Type 2024 & 2032
- Figure 67: South America LNG Storage Tank Industry Revenue (Million), by Country 2024 & 2032
- Figure 68: South America LNG Storage Tank Industry Volume (Litre), by Country 2024 & 2032
- Figure 69: South America LNG Storage Tank Industry Revenue Share (%), by Country 2024 & 2032
- Figure 70: South America LNG Storage Tank Industry Volume Share (%), by Country 2024 & 2032
- Figure 71: Middle East LNG Storage Tank Industry Revenue (Million), by Product Type 2024 & 2032
- Figure 72: Middle East LNG Storage Tank Industry Volume (Litre), by Product Type 2024 & 2032
- Figure 73: Middle East LNG Storage Tank Industry Revenue Share (%), by Product Type 2024 & 2032
- Figure 74: Middle East LNG Storage Tank Industry Volume Share (%), by Product Type 2024 & 2032
- Figure 75: Middle East LNG Storage Tank Industry Revenue (Million), by Material Type 2024 & 2032
- Figure 76: Middle East LNG Storage Tank Industry Volume (Litre), by Material Type 2024 & 2032
- Figure 77: Middle East LNG Storage Tank Industry Revenue Share (%), by Material Type 2024 & 2032
- Figure 78: Middle East LNG Storage Tank Industry Volume Share (%), by Material Type 2024 & 2032
- Figure 79: Middle East LNG Storage Tank Industry Revenue (Million), by Country 2024 & 2032
- Figure 80: Middle East LNG Storage Tank Industry Volume (Litre), by Country 2024 & 2032
- Figure 81: Middle East LNG Storage Tank Industry Revenue Share (%), by Country 2024 & 2032
- Figure 82: Middle East LNG Storage Tank Industry Volume Share (%), by Country 2024 & 2032
- Figure 83: UAE LNG Storage Tank Industry Revenue (Million), by Product Type 2024 & 2032
- Figure 84: UAE LNG Storage Tank Industry Volume (Litre), by Product Type 2024 & 2032
- Figure 85: UAE LNG Storage Tank Industry Revenue Share (%), by Product Type 2024 & 2032
- Figure 86: UAE LNG Storage Tank Industry Volume Share (%), by Product Type 2024 & 2032
- Figure 87: UAE LNG Storage Tank Industry Revenue (Million), by Material Type 2024 & 2032
- Figure 88: UAE LNG Storage Tank Industry Volume (Litre), by Material Type 2024 & 2032
- Figure 89: UAE LNG Storage Tank Industry Revenue Share (%), by Material Type 2024 & 2032
- Figure 90: UAE LNG Storage Tank Industry Volume Share (%), by Material Type 2024 & 2032
- Figure 91: UAE LNG Storage Tank Industry Revenue (Million), by Country 2024 & 2032
- Figure 92: UAE LNG Storage Tank Industry Volume (Litre), by Country 2024 & 2032
- Figure 93: UAE LNG Storage Tank Industry Revenue Share (%), by Country 2024 & 2032
- Figure 94: UAE LNG Storage Tank Industry Volume Share (%), by Country 2024 & 2032
List of Tables
- Table 1: Global LNG Storage Tank Industry Revenue Million Forecast, by Region 2019 & 2032
- Table 2: Global LNG Storage Tank Industry Volume Litre Forecast, by Region 2019 & 2032
- Table 3: Global LNG Storage Tank Industry Revenue Million Forecast, by Product Type 2019 & 2032
- Table 4: Global LNG Storage Tank Industry Volume Litre Forecast, by Product Type 2019 & 2032
- Table 5: Global LNG Storage Tank Industry Revenue Million Forecast, by Material Type 2019 & 2032
- Table 6: Global LNG Storage Tank Industry Volume Litre Forecast, by Material Type 2019 & 2032
- Table 7: Global LNG Storage Tank Industry Revenue Million Forecast, by Region 2019 & 2032
- Table 8: Global LNG Storage Tank Industry Volume Litre Forecast, by Region 2019 & 2032
- Table 9: Global LNG Storage Tank Industry Revenue Million Forecast, by Country 2019 & 2032
- Table 10: Global LNG Storage Tank Industry Volume Litre Forecast, by Country 2019 & 2032
- Table 11: US LNG Storage Tank Industry Revenue (Million) Forecast, by Application 2019 & 2032
- Table 12: US LNG Storage Tank Industry Volume (Litre) Forecast, by Application 2019 & 2032
- Table 13: Canada LNG Storage Tank Industry Revenue (Million) Forecast, by Application 2019 & 2032
- Table 14: Canada LNG Storage Tank Industry Volume (Litre) Forecast, by Application 2019 & 2032
- Table 15: Mexico LNG Storage Tank Industry Revenue (Million) Forecast, by Application 2019 & 2032
- Table 16: Mexico LNG Storage Tank Industry Volume (Litre) Forecast, by Application 2019 & 2032
- Table 17: Global LNG Storage Tank Industry Revenue Million Forecast, by Country 2019 & 2032
- Table 18: Global LNG Storage Tank Industry Volume Litre Forecast, by Country 2019 & 2032
- Table 19: Germany LNG Storage Tank Industry Revenue (Million) Forecast, by Application 2019 & 2032
- Table 20: Germany LNG Storage Tank Industry Volume (Litre) Forecast, by Application 2019 & 2032
- Table 21: UK LNG Storage Tank Industry Revenue (Million) Forecast, by Application 2019 & 2032
- Table 22: UK LNG Storage Tank Industry Volume (Litre) Forecast, by Application 2019 & 2032
- Table 23: France LNG Storage Tank Industry Revenue (Million) Forecast, by Application 2019 & 2032
- Table 24: France LNG Storage Tank Industry Volume (Litre) Forecast, by Application 2019 & 2032
- Table 25: Russia LNG Storage Tank Industry Revenue (Million) Forecast, by Application 2019 & 2032
- Table 26: Russia LNG Storage Tank Industry Volume (Litre) Forecast, by Application 2019 & 2032
- Table 27: Spain LNG Storage Tank Industry Revenue (Million) Forecast, by Application 2019 & 2032
- Table 28: Spain LNG Storage Tank Industry Volume (Litre) Forecast, by Application 2019 & 2032
- Table 29: Rest of Europe LNG Storage Tank Industry Revenue (Million) Forecast, by Application 2019 & 2032
- Table 30: Rest of Europe LNG Storage Tank Industry Volume (Litre) Forecast, by Application 2019 & 2032
- Table 31: Global LNG Storage Tank Industry Revenue Million Forecast, by Country 2019 & 2032
- Table 32: Global LNG Storage Tank Industry Volume Litre Forecast, by Country 2019 & 2032
- Table 33: India LNG Storage Tank Industry Revenue (Million) Forecast, by Application 2019 & 2032
- Table 34: India LNG Storage Tank Industry Volume (Litre) Forecast, by Application 2019 & 2032
- Table 35: China LNG Storage Tank Industry Revenue (Million) Forecast, by Application 2019 & 2032
- Table 36: China LNG Storage Tank Industry Volume (Litre) Forecast, by Application 2019 & 2032
- Table 37: Japan LNG Storage Tank Industry Revenue (Million) Forecast, by Application 2019 & 2032
- Table 38: Japan LNG Storage Tank Industry Volume (Litre) Forecast, by Application 2019 & 2032
- Table 39: Singapore LNG Storage Tank Industry Revenue (Million) Forecast, by Application 2019 & 2032
- Table 40: Singapore LNG Storage Tank Industry Volume (Litre) Forecast, by Application 2019 & 2032
- Table 41: Malaysia LNG Storage Tank Industry Revenue (Million) Forecast, by Application 2019 & 2032
- Table 42: Malaysia LNG Storage Tank Industry Volume (Litre) Forecast, by Application 2019 & 2032
- Table 43: South Korea LNG Storage Tank Industry Revenue (Million) Forecast, by Application 2019 & 2032
- Table 44: South Korea LNG Storage Tank Industry Volume (Litre) Forecast, by Application 2019 & 2032
- Table 45: Australia LNG Storage Tank Industry Revenue (Million) Forecast, by Application 2019 & 2032
- Table 46: Australia LNG Storage Tank Industry Volume (Litre) Forecast, by Application 2019 & 2032
- Table 47: Rest of Asia Pacific LNG Storage Tank Industry Revenue (Million) Forecast, by Application 2019 & 2032
- Table 48: Rest of Asia Pacific LNG Storage Tank Industry Volume (Litre) Forecast, by Application 2019 & 2032
- Table 49: Global LNG Storage Tank Industry Revenue Million Forecast, by Country 2019 & 2032
- Table 50: Global LNG Storage Tank Industry Volume Litre Forecast, by Country 2019 & 2032
- Table 51: Brazil LNG Storage Tank Industry Revenue (Million) Forecast, by Application 2019 & 2032
- Table 52: Brazil LNG Storage Tank Industry Volume (Litre) Forecast, by Application 2019 & 2032
- Table 53: Argentina LNG Storage Tank Industry Revenue (Million) Forecast, by Application 2019 & 2032
- Table 54: Argentina LNG Storage Tank Industry Volume (Litre) Forecast, by Application 2019 & 2032
- Table 55: Rest of South America LNG Storage Tank Industry Revenue (Million) Forecast, by Application 2019 & 2032
- Table 56: Rest of South America LNG Storage Tank Industry Volume (Litre) Forecast, by Application 2019 & 2032
- Table 57: Global LNG Storage Tank Industry Revenue Million Forecast, by Country 2019 & 2032
- Table 58: Global LNG Storage Tank Industry Volume Litre Forecast, by Country 2019 & 2032
- Table 59: United Arab Emirates LNG Storage Tank Industry Revenue (Million) Forecast, by Application 2019 & 2032
- Table 60: United Arab Emirates LNG Storage Tank Industry Volume (Litre) Forecast, by Application 2019 & 2032
- Table 61: Saudi Arabia LNG Storage Tank Industry Revenue (Million) Forecast, by Application 2019 & 2032
- Table 62: Saudi Arabia LNG Storage Tank Industry Volume (Litre) Forecast, by Application 2019 & 2032
- Table 63: South Africa LNG Storage Tank Industry Revenue (Million) Forecast, by Application 2019 & 2032
- Table 64: South Africa LNG Storage Tank Industry Volume (Litre) Forecast, by Application 2019 & 2032
- Table 65: Rest of Middle East and Africa LNG Storage Tank Industry Revenue (Million) Forecast, by Application 2019 & 2032
- Table 66: Rest of Middle East and Africa LNG Storage Tank Industry Volume (Litre) Forecast, by Application 2019 & 2032
- Table 67: Global LNG Storage Tank Industry Revenue Million Forecast, by Product Type 2019 & 2032
- Table 68: Global LNG Storage Tank Industry Volume Litre Forecast, by Product Type 2019 & 2032
- Table 69: Global LNG Storage Tank Industry Revenue Million Forecast, by Material Type 2019 & 2032
- Table 70: Global LNG Storage Tank Industry Volume Litre Forecast, by Material Type 2019 & 2032
- Table 71: Global LNG Storage Tank Industry Revenue Million Forecast, by Country 2019 & 2032
- Table 72: Global LNG Storage Tank Industry Volume Litre Forecast, by Country 2019 & 2032
- Table 73: US LNG Storage Tank Industry Revenue (Million) Forecast, by Application 2019 & 2032
- Table 74: US LNG Storage Tank Industry Volume (Litre) Forecast, by Application 2019 & 2032
- Table 75: Canada LNG Storage Tank Industry Revenue (Million) Forecast, by Application 2019 & 2032
- Table 76: Canada LNG Storage Tank Industry Volume (Litre) Forecast, by Application 2019 & 2032
- Table 77: Mexico LNG Storage Tank Industry Revenue (Million) Forecast, by Application 2019 & 2032
- Table 78: Mexico LNG Storage Tank Industry Volume (Litre) Forecast, by Application 2019 & 2032
- Table 79: Global LNG Storage Tank Industry Revenue Million Forecast, by Product Type 2019 & 2032
- Table 80: Global LNG Storage Tank Industry Volume Litre Forecast, by Product Type 2019 & 2032
- Table 81: Global LNG Storage Tank Industry Revenue Million Forecast, by Material Type 2019 & 2032
- Table 82: Global LNG Storage Tank Industry Volume Litre Forecast, by Material Type 2019 & 2032
- Table 83: Global LNG Storage Tank Industry Revenue Million Forecast, by Country 2019 & 2032
- Table 84: Global LNG Storage Tank Industry Volume Litre Forecast, by Country 2019 & 2032
- Table 85: Germany LNG Storage Tank Industry Revenue (Million) Forecast, by Application 2019 & 2032
- Table 86: Germany LNG Storage Tank Industry Volume (Litre) Forecast, by Application 2019 & 2032
- Table 87: UK LNG Storage Tank Industry Revenue (Million) Forecast, by Application 2019 & 2032
- Table 88: UK LNG Storage Tank Industry Volume (Litre) Forecast, by Application 2019 & 2032
- Table 89: France LNG Storage Tank Industry Revenue (Million) Forecast, by Application 2019 & 2032
- Table 90: France LNG Storage Tank Industry Volume (Litre) Forecast, by Application 2019 & 2032
- Table 91: Russia LNG Storage Tank Industry Revenue (Million) Forecast, by Application 2019 & 2032
- Table 92: Russia LNG Storage Tank Industry Volume (Litre) Forecast, by Application 2019 & 2032
- Table 93: Spain LNG Storage Tank Industry Revenue (Million) Forecast, by Application 2019 & 2032
- Table 94: Spain LNG Storage Tank Industry Volume (Litre) Forecast, by Application 2019 & 2032
- Table 95: Rest of Europe LNG Storage Tank Industry Revenue (Million) Forecast, by Application 2019 & 2032
- Table 96: Rest of Europe LNG Storage Tank Industry Volume (Litre) Forecast, by Application 2019 & 2032
- Table 97: Global LNG Storage Tank Industry Revenue Million Forecast, by Product Type 2019 & 2032
- Table 98: Global LNG Storage Tank Industry Volume Litre Forecast, by Product Type 2019 & 2032
- Table 99: Global LNG Storage Tank Industry Revenue Million Forecast, by Material Type 2019 & 2032
- Table 100: Global LNG Storage Tank Industry Volume Litre Forecast, by Material Type 2019 & 2032
- Table 101: Global LNG Storage Tank Industry Revenue Million Forecast, by Country 2019 & 2032
- Table 102: Global LNG Storage Tank Industry Volume Litre Forecast, by Country 2019 & 2032
- Table 103: India LNG Storage Tank Industry Revenue (Million) Forecast, by Application 2019 & 2032
- Table 104: India LNG Storage Tank Industry Volume (Litre) Forecast, by Application 2019 & 2032
- Table 105: China LNG Storage Tank Industry Revenue (Million) Forecast, by Application 2019 & 2032
- Table 106: China LNG Storage Tank Industry Volume (Litre) Forecast, by Application 2019 & 2032
- Table 107: Japan LNG Storage Tank Industry Revenue (Million) Forecast, by Application 2019 & 2032
- Table 108: Japan LNG Storage Tank Industry Volume (Litre) Forecast, by Application 2019 & 2032
- Table 109: Singapore LNG Storage Tank Industry Revenue (Million) Forecast, by Application 2019 & 2032
- Table 110: Singapore LNG Storage Tank Industry Volume (Litre) Forecast, by Application 2019 & 2032
- Table 111: Malaysia LNG Storage Tank Industry Revenue (Million) Forecast, by Application 2019 & 2032
- Table 112: Malaysia LNG Storage Tank Industry Volume (Litre) Forecast, by Application 2019 & 2032
- Table 113: South Korea LNG Storage Tank Industry Revenue (Million) Forecast, by Application 2019 & 2032
- Table 114: South Korea LNG Storage Tank Industry Volume (Litre) Forecast, by Application 2019 & 2032
- Table 115: Australia LNG Storage Tank Industry Revenue (Million) Forecast, by Application 2019 & 2032
- Table 116: Australia LNG Storage Tank Industry Volume (Litre) Forecast, by Application 2019 & 2032
- Table 117: Rest of Asia Pacific LNG Storage Tank Industry Revenue (Million) Forecast, by Application 2019 & 2032
- Table 118: Rest of Asia Pacific LNG Storage Tank Industry Volume (Litre) Forecast, by Application 2019 & 2032
- Table 119: Global LNG Storage Tank Industry Revenue Million Forecast, by Product Type 2019 & 2032
- Table 120: Global LNG Storage Tank Industry Volume Litre Forecast, by Product Type 2019 & 2032
- Table 121: Global LNG Storage Tank Industry Revenue Million Forecast, by Material Type 2019 & 2032
- Table 122: Global LNG Storage Tank Industry Volume Litre Forecast, by Material Type 2019 & 2032
- Table 123: Global LNG Storage Tank Industry Revenue Million Forecast, by Country 2019 & 2032
- Table 124: Global LNG Storage Tank Industry Volume Litre Forecast, by Country 2019 & 2032
- Table 125: Brazil LNG Storage Tank Industry Revenue (Million) Forecast, by Application 2019 & 2032
- Table 126: Brazil LNG Storage Tank Industry Volume (Litre) Forecast, by Application 2019 & 2032
- Table 127: Argentina LNG Storage Tank Industry Revenue (Million) Forecast, by Application 2019 & 2032
- Table 128: Argentina LNG Storage Tank Industry Volume (Litre) Forecast, by Application 2019 & 2032
- Table 129: Rest of South America LNG Storage Tank Industry Revenue (Million) Forecast, by Application 2019 & 2032
- Table 130: Rest of South America LNG Storage Tank Industry Volume (Litre) Forecast, by Application 2019 & 2032
- Table 131: Global LNG Storage Tank Industry Revenue Million Forecast, by Product Type 2019 & 2032
- Table 132: Global LNG Storage Tank Industry Volume Litre Forecast, by Product Type 2019 & 2032
- Table 133: Global LNG Storage Tank Industry Revenue Million Forecast, by Material Type 2019 & 2032
- Table 134: Global LNG Storage Tank Industry Volume Litre Forecast, by Material Type 2019 & 2032
- Table 135: Global LNG Storage Tank Industry Revenue Million Forecast, by Country 2019 & 2032
- Table 136: Global LNG Storage Tank Industry Volume Litre Forecast, by Country 2019 & 2032
- Table 137: Global LNG Storage Tank Industry Revenue Million Forecast, by Product Type 2019 & 2032
- Table 138: Global LNG Storage Tank Industry Volume Litre Forecast, by Product Type 2019 & 2032
- Table 139: Global LNG Storage Tank Industry Revenue Million Forecast, by Material Type 2019 & 2032
- Table 140: Global LNG Storage Tank Industry Volume Litre Forecast, by Material Type 2019 & 2032
- Table 141: Global LNG Storage Tank Industry Revenue Million Forecast, by Country 2019 & 2032
- Table 142: Global LNG Storage Tank Industry Volume Litre Forecast, by Country 2019 & 2032
- Table 143: Saudi Arabia LNG Storage Tank Industry Revenue (Million) Forecast, by Application 2019 & 2032
- Table 144: Saudi Arabia LNG Storage Tank Industry Volume (Litre) Forecast, by Application 2019 & 2032
- Table 145: South Africa LNG Storage Tank Industry Revenue (Million) Forecast, by Application 2019 & 2032
- Table 146: South Africa LNG Storage Tank Industry Volume (Litre) Forecast, by Application 2019 & 2032
- Table 147: Rest of Middle East LNG Storage Tank Industry Revenue (Million) Forecast, by Application 2019 & 2032
- Table 148: Rest of Middle East LNG Storage Tank Industry Volume (Litre) Forecast, by Application 2019 & 2032
Frequently Asked Questions
1. What is the projected Compound Annual Growth Rate (CAGR) of the LNG Storage Tank Industry?
The projected CAGR is approximately > 5.00%.
2. Which companies are prominent players in the LNG Storage Tank Industry?
Key companies in the market include Mcdermott International Inc, Cryolor, Isisan A S, Air Water Inc, Wärtsilä, Linde Plc, Cimc Enric, Chart Industries, IHI Corporation, Inox India.
3. What are the main segments of the LNG Storage Tank Industry?
The market segments include Product Type, Material Type.
4. Can you provide details about the market size?
The market size is estimated to be USD XX Million as of 2022.
5. What are some drivers contributing to market growth?
4.; Increasing Demand From Refining And Industrial Sector4.; Favourable Government Policies.
6. What are the notable trends driving market growth?
Increasing demand for LNG.
7. Are there any restraints impacting market growth?
4.; High Capital Costs For Hydrogen Energy Storage.
8. Can you provide examples of recent developments in the market?
On 13 April 2022, Linde announced that it is expanding its La Porte, Texas, facility, effectively doubling the facility's merchant liquid production capacity. The increased capacity will help Linde to meet growing demand from the petrochemicals, clean energy, manufacturing, food and aerospace sectors in the U.S. Gulf Coast and is estimated to start by 2024. The expansion will also supply Linde's existing Gulf Coast pipeline system, which includes nitrogen and oxygen pipelines extending from the Houston ship channel south to Freeport, Texas.
9. What pricing options are available for accessing the report?
Pricing options include single-user, multi-user, and enterprise licenses priced at USD 4750, USD 5250, and USD 8750 respectively.
10. Is the market size provided in terms of value or volume?
The market size is provided in terms of value, measured in Million and volume, measured in Litre.
11. Are there any specific market keywords associated with the report?
Yes, the market keyword associated with the report is "LNG Storage Tank Industry," which aids in identifying and referencing the specific market segment covered.
12. How do I determine which pricing option suits my needs best?
The pricing options vary based on user requirements and access needs. Individual users may opt for single-user licenses, while businesses requiring broader access may choose multi-user or enterprise licenses for cost-effective access to the report.
13. Are there any additional resources or data provided in the LNG Storage Tank Industry report?
While the report offers comprehensive insights, it's advisable to review the specific contents or supplementary materials provided to ascertain if additional resources or data are available.
14. How can I stay updated on further developments or reports in the LNG Storage Tank Industry?
To stay informed about further developments, trends, and reports in the LNG Storage Tank Industry, consider subscribing to industry newsletters, following relevant companies and organizations, or regularly checking reputable industry news sources and publications.
Methodology
Step 1 - Identification of Relevant Samples Size from Population Database


Step 2 - Approaches for Defining Global Market Size (Value, Volume* & Price*)

Note*: In applicable scenarios
Step 3 - Data Sources
Primary Research
- Web Analytics
- Survey Reports
- Research Institute
- Latest Research Reports
- Opinion Leaders
Secondary Research
- Annual Reports
- White Paper
- Latest Press Release
- Industry Association
- Paid Database
- Investor Presentations

Step 4 - Data Triangulation
Involves using different sources of information in order to increase the validity of a study
These sources are likely to be stakeholders in a program - participants, other researchers, program staff, other community members, and so on.
Then we put all data in single framework & apply various statistical tools to find out the dynamic on the market.
During the analysis stage, feedback from the stakeholder groups would be compared to determine areas of agreement as well as areas of divergence


