


Key Insights
The global market for lithium batteries in long-term energy storage is experiencing robust growth, driven by the increasing demand for renewable energy integration and grid stabilization. The market, estimated at $50 billion in 2025, is projected to maintain a healthy Compound Annual Growth Rate (CAGR) of 15% from 2025 to 2033, reaching an estimated $150 billion by 2033. This expansion is fueled by several key factors, including government incentives promoting renewable energy adoption, advancements in battery technology leading to increased energy density and lifespan, and declining battery costs. Significant investments in large-scale energy storage projects, coupled with growing concerns about climate change and energy security, are further bolstering market demand. Key players like CATL, BYD, and LG Energy Solution are strategically positioning themselves to capitalize on this burgeoning market through capacity expansions and technological innovations.
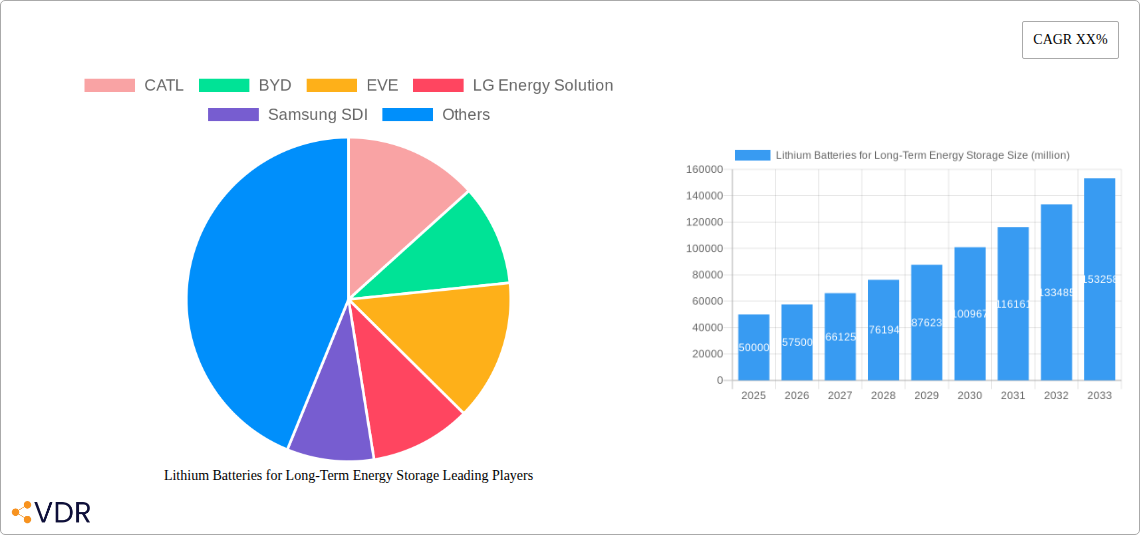
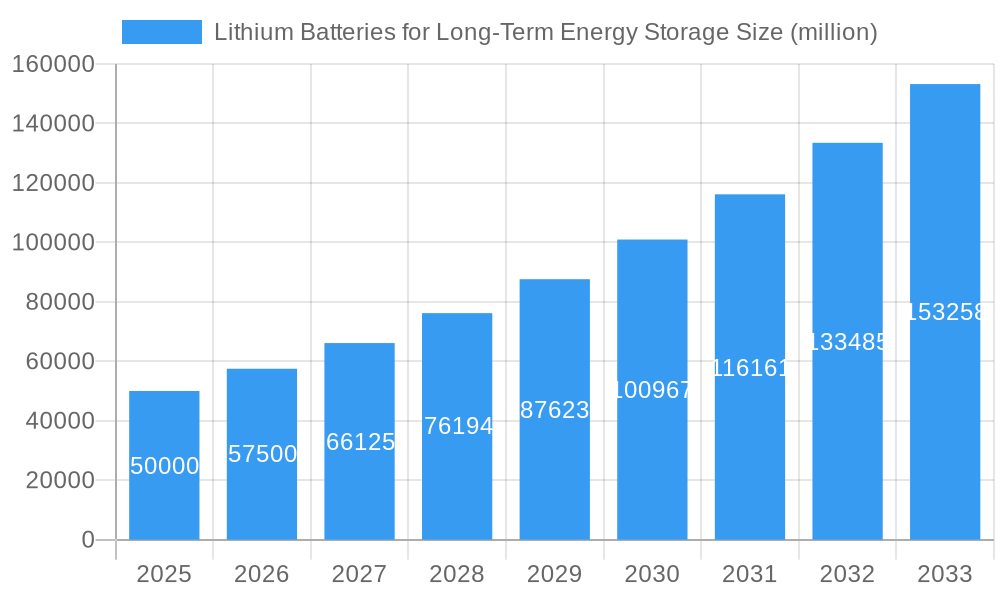
Lithium Batteries for Long-Term Energy Storage Market Size (In Billion)

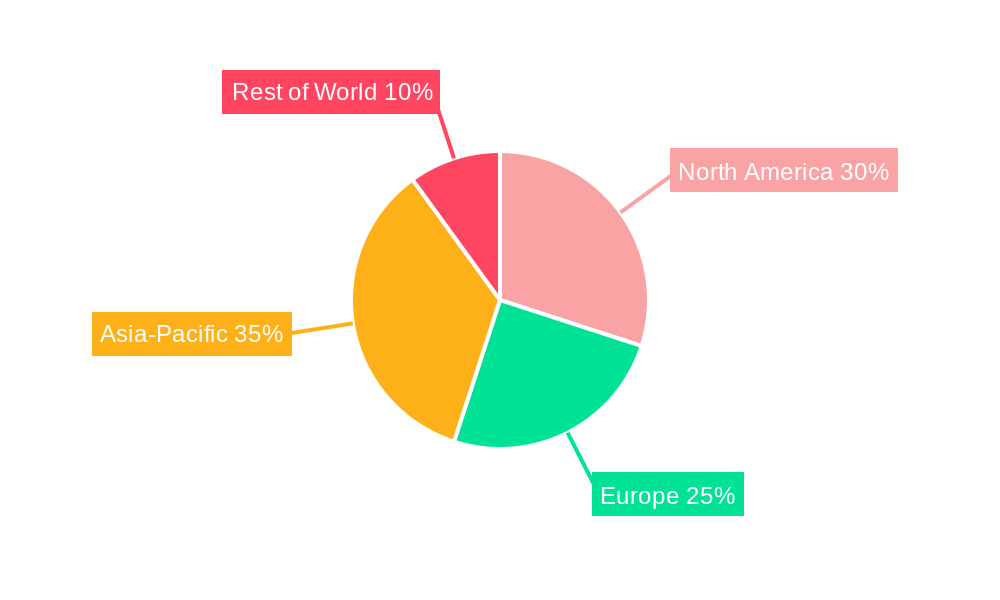
However, challenges remain. The supply chain vulnerabilities associated with lithium and other critical raw materials pose a significant risk to market growth. Moreover, concerns around battery safety, lifecycle management, and environmental impacts necessitate further research and development in sustainable battery technologies and recycling processes. Regional variations in market penetration are also expected, with North America and Europe leading the adoption, followed by Asia-Pacific, driven by government policies and robust renewable energy infrastructure development. The competition among established players and emerging companies is intensifying, leading to innovations in battery chemistries, designs, and management systems, pushing the boundaries of energy storage capabilities.
Lithium Batteries for Long-Term Energy Storage Company Market Share
Lithium Batteries for Long-Term Energy Storage Market Report: 2019-2033
This comprehensive report provides a detailed analysis of the lithium batteries for long-term energy storage market, covering market dynamics, growth trends, regional insights, product landscape, key players, and future outlook. The study period spans from 2019 to 2033, with 2025 serving as the base and estimated year. This report is crucial for industry professionals, investors, and stakeholders seeking a deep understanding of this rapidly evolving sector. The market is segmented by battery chemistry, application (grid-scale storage, microgrids, etc.), and geography, providing granular insights for strategic decision-making. The parent market is Energy Storage Systems and child market is Lithium-ion Batteries for Long-Term Energy Storage.
Lithium Batteries for Long-Term Energy Storage Market Dynamics & Structure
This section analyzes the market's competitive landscape, technological advancements, regulatory environment, and industry trends. The global market for lithium-ion batteries for long-term energy storage is experiencing significant growth, driven by increasing renewable energy adoption and the need for grid stabilization. Market concentration is moderate, with several key players holding significant shares, but the market also hosts a number of smaller, specialized companies.
- Market Concentration: The top five players (CATL, BYD, EVE, LG Energy Solution, Samsung SDI) hold an estimated 60% market share in 2025 (xx million units), with CATL leading the pack. The market exhibits both horizontal and vertical integration.
- Technological Innovation: Advancements in battery chemistry (e.g., lithium iron phosphate, solid-state batteries), energy density improvements, and thermal management systems are key drivers. Innovation barriers include high R&D costs and the need for robust safety standards.
- Regulatory Frameworks: Government policies promoting renewable energy integration and grid modernization are significantly influencing market growth. Subsidies, tax incentives, and grid interconnection regulations vary across regions.
- Competitive Product Substitutes: Other energy storage technologies like pumped hydro, compressed air energy storage, and flow batteries are present, but lithium-ion batteries currently dominate due to their scalability, efficiency, and versatility.
- End-User Demographics: The primary end-users are utilities, independent power producers (IPPs), and large industrial consumers. Growing interest from residential and commercial sectors is also observed.
- M&A Trends: Consolidation within the industry is evident, with xx major M&A deals valued at approximately xx million USD recorded between 2019 and 2024.
Lithium Batteries for Long-Term Energy Storage Growth Trends & Insights
The global lithium-ion battery market for long-term energy storage is projected to experience substantial growth over the forecast period (2025-2033). Market size is estimated at xx million units in 2025, with a projected compound annual growth rate (CAGR) of xx% during the forecast period, reaching xx million units by 2033. This growth is fueled by various factors, including the increasing penetration of renewable energy sources, the imperative for enhanced grid reliability and resilience, and the declining cost of lithium-ion batteries. Technological advancements such as improved battery chemistries, higher energy density, and enhanced safety features are further accelerating adoption. Shifting consumer preferences towards sustainable energy solutions and stringent environmental regulations are also contributing to the market’s expansion.
Dominant Regions, Countries, or Segments in Lithium Batteries for Long-Term Energy Storage
China currently dominates the global market for lithium-ion batteries for long-term energy storage, holding the largest market share in 2025. This dominance stems from several factors:
- Supportive Government Policies: China has implemented various policies to promote renewable energy integration and electric vehicle adoption, fostering a robust demand for energy storage solutions.
- Established Supply Chain: China boasts a well-established and integrated supply chain for lithium-ion battery materials, manufacturing, and deployment.
- Technological Advancements: Chinese battery manufacturers are at the forefront of technological innovation in the sector, regularly introducing advanced battery chemistries and improving production efficiency.
- Cost Competitiveness: Chinese manufacturers offer highly competitive pricing, enhancing their market position.
Other regions, including North America and Europe, are also experiencing significant growth, although at a slower pace than China. Factors such as increasing investments in renewable energy projects and supportive government regulations are driving growth in these regions.
Lithium Batteries for Long-Term Energy Storage Product Landscape
The product landscape is characterized by a wide range of lithium-ion battery technologies, including lithium iron phosphate (LFP), nickel manganese cobalt (NMC), and nickel cobalt aluminum (NCA) chemistries. Each chemistry offers a unique balance of energy density, lifespan, cost, and safety features. Recent innovations focus on enhancing energy density, improving cycle life, and developing safer battery management systems. Specific applications range from large-scale grid storage systems to smaller-scale microgrids and residential energy storage.
Key Drivers, Barriers & Challenges in Lithium Batteries for Long-Term Energy Storage
Key Drivers: The primary drivers include the increasing penetration of renewable energy sources (solar and wind), the need for grid stabilization and improved reliability, and supportive government policies promoting energy storage deployment. Decreasing battery costs also contribute significantly to market expansion.
Key Challenges: Challenges include the high upfront capital cost of energy storage systems, the need for robust infrastructure to support large-scale deployments, supply chain vulnerabilities affecting raw material availability, and potential safety concerns associated with lithium-ion batteries. Furthermore, technological limitations in battery energy density and lifespan remain.
Emerging Opportunities in Lithium Batteries for Long-Term Energy Storage
Emerging opportunities include the growing demand for energy storage in developing countries, expanding applications in microgrids and off-grid systems, and the development of innovative battery chemistries like solid-state batteries. Furthermore, the integration of advanced battery management systems and artificial intelligence for optimized energy storage performance presents significant potential.
Growth Accelerators in the Lithium Batteries for Long-Term Energy Storage Industry
Technological breakthroughs in battery chemistry, improved manufacturing processes leading to lower costs, strategic partnerships between battery manufacturers, energy companies, and grid operators, and continued government support will significantly accelerate the growth of the lithium-ion battery market for long-term energy storage. Expansion into new geographical markets and innovative applications will further contribute to market expansion.
Key Players Shaping the Lithium Batteries for Long-Term Energy Storage Market
- CATL
- BYD
- EVE
- LG Energy Solution
- Samsung SDI
- REPT
- Great Power
- Hithium
- Ganfeng
- CALB
- Envision AESC
- Poweramp
- Saft
- Kokam
Notable Milestones in Lithium Batteries for Long-Term Energy Storage Sector
- 2020: Several major battery manufacturers announced significant investments in expanding their production capacity.
- 2021: Introduction of new battery chemistries with enhanced energy density and lifespan.
- 2022: Significant progress in solid-state battery technology.
- 2023: Several large-scale grid storage projects commissioned worldwide.
- 2024: Increased focus on sustainable battery manufacturing and recycling.
In-Depth Lithium Batteries for Long-Term Energy Storage Market Outlook
The future of the lithium-ion battery market for long-term energy storage is bright, with significant growth potential driven by several factors. Continued technological advancements, increasing demand for renewable energy integration, and government support will propel market expansion. Strategic partnerships and investments in research and development will further accelerate growth, shaping a future where energy storage plays a pivotal role in a sustainable energy ecosystem.
Lithium Batteries for Long-Term Energy Storage Segmentation
-
1. Application
- 1.1. Power Grid
- 1.2. C&I
- 1.3. Residential
-
2. Types
- 2.1. NCx
- 2.2. LFP
Lithium Batteries for Long-Term Energy Storage Segmentation By Geography
-
1. North America
- 1.1. United States
- 1.2. Canada
- 1.3. Mexico
-
2. South America
- 2.1. Brazil
- 2.2. Argentina
- 2.3. Rest of South America
-
3. Europe
- 3.1. United Kingdom
- 3.2. Germany
- 3.3. France
- 3.4. Italy
- 3.5. Spain
- 3.6. Russia
- 3.7. Benelux
- 3.8. Nordics
- 3.9. Rest of Europe
-
4. Middle East & Africa
- 4.1. Turkey
- 4.2. Israel
- 4.3. GCC
- 4.4. North Africa
- 4.5. South Africa
- 4.6. Rest of Middle East & Africa
-
5. Asia Pacific
- 5.1. China
- 5.2. India
- 5.3. Japan
- 5.4. South Korea
- 5.5. ASEAN
- 5.6. Oceania
- 5.7. Rest of Asia Pacific
Lithium Batteries for Long-Term Energy Storage Regional Market Share
Geographic Coverage of Lithium Batteries for Long-Term Energy Storage
Lithium Batteries for Long-Term Energy Storage REPORT HIGHLIGHTS
| Aspects | Details |
|---|---|
| Study Period | 2020-2034 |
| Base Year | 2025 |
| Estimated Year | 2026 |
| Forecast Period | 2026-2034 |
| Historical Period | 2020-2025 |
| Growth Rate | CAGR of XX% from 2020-2034 |
| Segmentation |
|
Table of Contents
- 1. Introduction
- 1.1. Research Scope
- 1.2. Market Segmentation
- 1.3. Research Methodology
- 1.4. Definitions and Assumptions
- 2. Executive Summary
- 2.1. Introduction
- 3. Market Dynamics
- 3.1. Introduction
- 3.2. Market Drivers
- 3.3. Market Restrains
- 3.4. Market Trends
- 4. Market Factor Analysis
- 4.1. Porters Five Forces
- 4.2. Supply/Value Chain
- 4.3. PESTEL analysis
- 4.4. Market Entropy
- 4.5. Patent/Trademark Analysis
- 5. Global Lithium Batteries for Long-Term Energy Storage Analysis, Insights and Forecast, 2020-2032
- 5.1. Market Analysis, Insights and Forecast - by Application
- 5.1.1. Power Grid
- 5.1.2. C&I
- 5.1.3. Residential
- 5.2. Market Analysis, Insights and Forecast - by Types
- 5.2.1. NCx
- 5.2.2. LFP
- 5.3. Market Analysis, Insights and Forecast - by Region
- 5.3.1. North America
- 5.3.2. South America
- 5.3.3. Europe
- 5.3.4. Middle East & Africa
- 5.3.5. Asia Pacific
- 5.1. Market Analysis, Insights and Forecast - by Application
- 6. North America Lithium Batteries for Long-Term Energy Storage Analysis, Insights and Forecast, 2020-2032
- 6.1. Market Analysis, Insights and Forecast - by Application
- 6.1.1. Power Grid
- 6.1.2. C&I
- 6.1.3. Residential
- 6.2. Market Analysis, Insights and Forecast - by Types
- 6.2.1. NCx
- 6.2.2. LFP
- 6.1. Market Analysis, Insights and Forecast - by Application
- 7. South America Lithium Batteries for Long-Term Energy Storage Analysis, Insights and Forecast, 2020-2032
- 7.1. Market Analysis, Insights and Forecast - by Application
- 7.1.1. Power Grid
- 7.1.2. C&I
- 7.1.3. Residential
- 7.2. Market Analysis, Insights and Forecast - by Types
- 7.2.1. NCx
- 7.2.2. LFP
- 7.1. Market Analysis, Insights and Forecast - by Application
- 8. Europe Lithium Batteries for Long-Term Energy Storage Analysis, Insights and Forecast, 2020-2032
- 8.1. Market Analysis, Insights and Forecast - by Application
- 8.1.1. Power Grid
- 8.1.2. C&I
- 8.1.3. Residential
- 8.2. Market Analysis, Insights and Forecast - by Types
- 8.2.1. NCx
- 8.2.2. LFP
- 8.1. Market Analysis, Insights and Forecast - by Application
- 9. Middle East & Africa Lithium Batteries for Long-Term Energy Storage Analysis, Insights and Forecast, 2020-2032
- 9.1. Market Analysis, Insights and Forecast - by Application
- 9.1.1. Power Grid
- 9.1.2. C&I
- 9.1.3. Residential
- 9.2. Market Analysis, Insights and Forecast - by Types
- 9.2.1. NCx
- 9.2.2. LFP
- 9.1. Market Analysis, Insights and Forecast - by Application
- 10. Asia Pacific Lithium Batteries for Long-Term Energy Storage Analysis, Insights and Forecast, 2020-2032
- 10.1. Market Analysis, Insights and Forecast - by Application
- 10.1.1. Power Grid
- 10.1.2. C&I
- 10.1.3. Residential
- 10.2. Market Analysis, Insights and Forecast - by Types
- 10.2.1. NCx
- 10.2.2. LFP
- 10.1. Market Analysis, Insights and Forecast - by Application
- 11. Competitive Analysis
- 11.1. Global Market Share Analysis 2025
- 11.2. Company Profiles
- 11.2.1 CATL
- 11.2.1.1. Overview
- 11.2.1.2. Products
- 11.2.1.3. SWOT Analysis
- 11.2.1.4. Recent Developments
- 11.2.1.5. Financials (Based on Availability)
- 11.2.2 BYD
- 11.2.2.1. Overview
- 11.2.2.2. Products
- 11.2.2.3. SWOT Analysis
- 11.2.2.4. Recent Developments
- 11.2.2.5. Financials (Based on Availability)
- 11.2.3 EVE
- 11.2.3.1. Overview
- 11.2.3.2. Products
- 11.2.3.3. SWOT Analysis
- 11.2.3.4. Recent Developments
- 11.2.3.5. Financials (Based on Availability)
- 11.2.4 LG Energy Solution
- 11.2.4.1. Overview
- 11.2.4.2. Products
- 11.2.4.3. SWOT Analysis
- 11.2.4.4. Recent Developments
- 11.2.4.5. Financials (Based on Availability)
- 11.2.5 Samsung SDI
- 11.2.5.1. Overview
- 11.2.5.2. Products
- 11.2.5.3. SWOT Analysis
- 11.2.5.4. Recent Developments
- 11.2.5.5. Financials (Based on Availability)
- 11.2.6 REPT
- 11.2.6.1. Overview
- 11.2.6.2. Products
- 11.2.6.3. SWOT Analysis
- 11.2.6.4. Recent Developments
- 11.2.6.5. Financials (Based on Availability)
- 11.2.7 Great Power
- 11.2.7.1. Overview
- 11.2.7.2. Products
- 11.2.7.3. SWOT Analysis
- 11.2.7.4. Recent Developments
- 11.2.7.5. Financials (Based on Availability)
- 11.2.8 Hithium
- 11.2.8.1. Overview
- 11.2.8.2. Products
- 11.2.8.3. SWOT Analysis
- 11.2.8.4. Recent Developments
- 11.2.8.5. Financials (Based on Availability)
- 11.2.9 Ganfeng
- 11.2.9.1. Overview
- 11.2.9.2. Products
- 11.2.9.3. SWOT Analysis
- 11.2.9.4. Recent Developments
- 11.2.9.5. Financials (Based on Availability)
- 11.2.10 CALB
- 11.2.10.1. Overview
- 11.2.10.2. Products
- 11.2.10.3. SWOT Analysis
- 11.2.10.4. Recent Developments
- 11.2.10.5. Financials (Based on Availability)
- 11.2.11 Envision AESC
- 11.2.11.1. Overview
- 11.2.11.2. Products
- 11.2.11.3. SWOT Analysis
- 11.2.11.4. Recent Developments
- 11.2.11.5. Financials (Based on Availability)
- 11.2.12 Poweramp
- 11.2.12.1. Overview
- 11.2.12.2. Products
- 11.2.12.3. SWOT Analysis
- 11.2.12.4. Recent Developments
- 11.2.12.5. Financials (Based on Availability)
- 11.2.13 Saft
- 11.2.13.1. Overview
- 11.2.13.2. Products
- 11.2.13.3. SWOT Analysis
- 11.2.13.4. Recent Developments
- 11.2.13.5. Financials (Based on Availability)
- 11.2.14 Kokam
- 11.2.14.1. Overview
- 11.2.14.2. Products
- 11.2.14.3. SWOT Analysis
- 11.2.14.4. Recent Developments
- 11.2.14.5. Financials (Based on Availability)
- 11.2.1 CATL
List of Figures
- Figure 1: Global Lithium Batteries for Long-Term Energy Storage Revenue Breakdown (million, %) by Region 2025 & 2033
- Figure 2: Global Lithium Batteries for Long-Term Energy Storage Volume Breakdown (K, %) by Region 2025 & 2033
- Figure 3: North America Lithium Batteries for Long-Term Energy Storage Revenue (million), by Application 2025 & 2033
- Figure 4: North America Lithium Batteries for Long-Term Energy Storage Volume (K), by Application 2025 & 2033
- Figure 5: North America Lithium Batteries for Long-Term Energy Storage Revenue Share (%), by Application 2025 & 2033
- Figure 6: North America Lithium Batteries for Long-Term Energy Storage Volume Share (%), by Application 2025 & 2033
- Figure 7: North America Lithium Batteries for Long-Term Energy Storage Revenue (million), by Types 2025 & 2033
- Figure 8: North America Lithium Batteries for Long-Term Energy Storage Volume (K), by Types 2025 & 2033
- Figure 9: North America Lithium Batteries for Long-Term Energy Storage Revenue Share (%), by Types 2025 & 2033
- Figure 10: North America Lithium Batteries for Long-Term Energy Storage Volume Share (%), by Types 2025 & 2033
- Figure 11: North America Lithium Batteries for Long-Term Energy Storage Revenue (million), by Country 2025 & 2033
- Figure 12: North America Lithium Batteries for Long-Term Energy Storage Volume (K), by Country 2025 & 2033
- Figure 13: North America Lithium Batteries for Long-Term Energy Storage Revenue Share (%), by Country 2025 & 2033
- Figure 14: North America Lithium Batteries for Long-Term Energy Storage Volume Share (%), by Country 2025 & 2033
- Figure 15: South America Lithium Batteries for Long-Term Energy Storage Revenue (million), by Application 2025 & 2033
- Figure 16: South America Lithium Batteries for Long-Term Energy Storage Volume (K), by Application 2025 & 2033
- Figure 17: South America Lithium Batteries for Long-Term Energy Storage Revenue Share (%), by Application 2025 & 2033
- Figure 18: South America Lithium Batteries for Long-Term Energy Storage Volume Share (%), by Application 2025 & 2033
- Figure 19: South America Lithium Batteries for Long-Term Energy Storage Revenue (million), by Types 2025 & 2033
- Figure 20: South America Lithium Batteries for Long-Term Energy Storage Volume (K), by Types 2025 & 2033
- Figure 21: South America Lithium Batteries for Long-Term Energy Storage Revenue Share (%), by Types 2025 & 2033
- Figure 22: South America Lithium Batteries for Long-Term Energy Storage Volume Share (%), by Types 2025 & 2033
- Figure 23: South America Lithium Batteries for Long-Term Energy Storage Revenue (million), by Country 2025 & 2033
- Figure 24: South America Lithium Batteries for Long-Term Energy Storage Volume (K), by Country 2025 & 2033
- Figure 25: South America Lithium Batteries for Long-Term Energy Storage Revenue Share (%), by Country 2025 & 2033
- Figure 26: South America Lithium Batteries for Long-Term Energy Storage Volume Share (%), by Country 2025 & 2033
- Figure 27: Europe Lithium Batteries for Long-Term Energy Storage Revenue (million), by Application 2025 & 2033
- Figure 28: Europe Lithium Batteries for Long-Term Energy Storage Volume (K), by Application 2025 & 2033
- Figure 29: Europe Lithium Batteries for Long-Term Energy Storage Revenue Share (%), by Application 2025 & 2033
- Figure 30: Europe Lithium Batteries for Long-Term Energy Storage Volume Share (%), by Application 2025 & 2033
- Figure 31: Europe Lithium Batteries for Long-Term Energy Storage Revenue (million), by Types 2025 & 2033
- Figure 32: Europe Lithium Batteries for Long-Term Energy Storage Volume (K), by Types 2025 & 2033
- Figure 33: Europe Lithium Batteries for Long-Term Energy Storage Revenue Share (%), by Types 2025 & 2033
- Figure 34: Europe Lithium Batteries for Long-Term Energy Storage Volume Share (%), by Types 2025 & 2033
- Figure 35: Europe Lithium Batteries for Long-Term Energy Storage Revenue (million), by Country 2025 & 2033
- Figure 36: Europe Lithium Batteries for Long-Term Energy Storage Volume (K), by Country 2025 & 2033
- Figure 37: Europe Lithium Batteries for Long-Term Energy Storage Revenue Share (%), by Country 2025 & 2033
- Figure 38: Europe Lithium Batteries for Long-Term Energy Storage Volume Share (%), by Country 2025 & 2033
- Figure 39: Middle East & Africa Lithium Batteries for Long-Term Energy Storage Revenue (million), by Application 2025 & 2033
- Figure 40: Middle East & Africa Lithium Batteries for Long-Term Energy Storage Volume (K), by Application 2025 & 2033
- Figure 41: Middle East & Africa Lithium Batteries for Long-Term Energy Storage Revenue Share (%), by Application 2025 & 2033
- Figure 42: Middle East & Africa Lithium Batteries for Long-Term Energy Storage Volume Share (%), by Application 2025 & 2033
- Figure 43: Middle East & Africa Lithium Batteries for Long-Term Energy Storage Revenue (million), by Types 2025 & 2033
- Figure 44: Middle East & Africa Lithium Batteries for Long-Term Energy Storage Volume (K), by Types 2025 & 2033
- Figure 45: Middle East & Africa Lithium Batteries for Long-Term Energy Storage Revenue Share (%), by Types 2025 & 2033
- Figure 46: Middle East & Africa Lithium Batteries for Long-Term Energy Storage Volume Share (%), by Types 2025 & 2033
- Figure 47: Middle East & Africa Lithium Batteries for Long-Term Energy Storage Revenue (million), by Country 2025 & 2033
- Figure 48: Middle East & Africa Lithium Batteries for Long-Term Energy Storage Volume (K), by Country 2025 & 2033
- Figure 49: Middle East & Africa Lithium Batteries for Long-Term Energy Storage Revenue Share (%), by Country 2025 & 2033
- Figure 50: Middle East & Africa Lithium Batteries for Long-Term Energy Storage Volume Share (%), by Country 2025 & 2033
- Figure 51: Asia Pacific Lithium Batteries for Long-Term Energy Storage Revenue (million), by Application 2025 & 2033
- Figure 52: Asia Pacific Lithium Batteries for Long-Term Energy Storage Volume (K), by Application 2025 & 2033
- Figure 53: Asia Pacific Lithium Batteries for Long-Term Energy Storage Revenue Share (%), by Application 2025 & 2033
- Figure 54: Asia Pacific Lithium Batteries for Long-Term Energy Storage Volume Share (%), by Application 2025 & 2033
- Figure 55: Asia Pacific Lithium Batteries for Long-Term Energy Storage Revenue (million), by Types 2025 & 2033
- Figure 56: Asia Pacific Lithium Batteries for Long-Term Energy Storage Volume (K), by Types 2025 & 2033
- Figure 57: Asia Pacific Lithium Batteries for Long-Term Energy Storage Revenue Share (%), by Types 2025 & 2033
- Figure 58: Asia Pacific Lithium Batteries for Long-Term Energy Storage Volume Share (%), by Types 2025 & 2033
- Figure 59: Asia Pacific Lithium Batteries for Long-Term Energy Storage Revenue (million), by Country 2025 & 2033
- Figure 60: Asia Pacific Lithium Batteries for Long-Term Energy Storage Volume (K), by Country 2025 & 2033
- Figure 61: Asia Pacific Lithium Batteries for Long-Term Energy Storage Revenue Share (%), by Country 2025 & 2033
- Figure 62: Asia Pacific Lithium Batteries for Long-Term Energy Storage Volume Share (%), by Country 2025 & 2033
List of Tables
- Table 1: Global Lithium Batteries for Long-Term Energy Storage Revenue million Forecast, by Application 2020 & 2033
- Table 2: Global Lithium Batteries for Long-Term Energy Storage Volume K Forecast, by Application 2020 & 2033
- Table 3: Global Lithium Batteries for Long-Term Energy Storage Revenue million Forecast, by Types 2020 & 2033
- Table 4: Global Lithium Batteries for Long-Term Energy Storage Volume K Forecast, by Types 2020 & 2033
- Table 5: Global Lithium Batteries for Long-Term Energy Storage Revenue million Forecast, by Region 2020 & 2033
- Table 6: Global Lithium Batteries for Long-Term Energy Storage Volume K Forecast, by Region 2020 & 2033
- Table 7: Global Lithium Batteries for Long-Term Energy Storage Revenue million Forecast, by Application 2020 & 2033
- Table 8: Global Lithium Batteries for Long-Term Energy Storage Volume K Forecast, by Application 2020 & 2033
- Table 9: Global Lithium Batteries for Long-Term Energy Storage Revenue million Forecast, by Types 2020 & 2033
- Table 10: Global Lithium Batteries for Long-Term Energy Storage Volume K Forecast, by Types 2020 & 2033
- Table 11: Global Lithium Batteries for Long-Term Energy Storage Revenue million Forecast, by Country 2020 & 2033
- Table 12: Global Lithium Batteries for Long-Term Energy Storage Volume K Forecast, by Country 2020 & 2033
- Table 13: United States Lithium Batteries for Long-Term Energy Storage Revenue (million) Forecast, by Application 2020 & 2033
- Table 14: United States Lithium Batteries for Long-Term Energy Storage Volume (K) Forecast, by Application 2020 & 2033
- Table 15: Canada Lithium Batteries for Long-Term Energy Storage Revenue (million) Forecast, by Application 2020 & 2033
- Table 16: Canada Lithium Batteries for Long-Term Energy Storage Volume (K) Forecast, by Application 2020 & 2033
- Table 17: Mexico Lithium Batteries for Long-Term Energy Storage Revenue (million) Forecast, by Application 2020 & 2033
- Table 18: Mexico Lithium Batteries for Long-Term Energy Storage Volume (K) Forecast, by Application 2020 & 2033
- Table 19: Global Lithium Batteries for Long-Term Energy Storage Revenue million Forecast, by Application 2020 & 2033
- Table 20: Global Lithium Batteries for Long-Term Energy Storage Volume K Forecast, by Application 2020 & 2033
- Table 21: Global Lithium Batteries for Long-Term Energy Storage Revenue million Forecast, by Types 2020 & 2033
- Table 22: Global Lithium Batteries for Long-Term Energy Storage Volume K Forecast, by Types 2020 & 2033
- Table 23: Global Lithium Batteries for Long-Term Energy Storage Revenue million Forecast, by Country 2020 & 2033
- Table 24: Global Lithium Batteries for Long-Term Energy Storage Volume K Forecast, by Country 2020 & 2033
- Table 25: Brazil Lithium Batteries for Long-Term Energy Storage Revenue (million) Forecast, by Application 2020 & 2033
- Table 26: Brazil Lithium Batteries for Long-Term Energy Storage Volume (K) Forecast, by Application 2020 & 2033
- Table 27: Argentina Lithium Batteries for Long-Term Energy Storage Revenue (million) Forecast, by Application 2020 & 2033
- Table 28: Argentina Lithium Batteries for Long-Term Energy Storage Volume (K) Forecast, by Application 2020 & 2033
- Table 29: Rest of South America Lithium Batteries for Long-Term Energy Storage Revenue (million) Forecast, by Application 2020 & 2033
- Table 30: Rest of South America Lithium Batteries for Long-Term Energy Storage Volume (K) Forecast, by Application 2020 & 2033
- Table 31: Global Lithium Batteries for Long-Term Energy Storage Revenue million Forecast, by Application 2020 & 2033
- Table 32: Global Lithium Batteries for Long-Term Energy Storage Volume K Forecast, by Application 2020 & 2033
- Table 33: Global Lithium Batteries for Long-Term Energy Storage Revenue million Forecast, by Types 2020 & 2033
- Table 34: Global Lithium Batteries for Long-Term Energy Storage Volume K Forecast, by Types 2020 & 2033
- Table 35: Global Lithium Batteries for Long-Term Energy Storage Revenue million Forecast, by Country 2020 & 2033
- Table 36: Global Lithium Batteries for Long-Term Energy Storage Volume K Forecast, by Country 2020 & 2033
- Table 37: United Kingdom Lithium Batteries for Long-Term Energy Storage Revenue (million) Forecast, by Application 2020 & 2033
- Table 38: United Kingdom Lithium Batteries for Long-Term Energy Storage Volume (K) Forecast, by Application 2020 & 2033
- Table 39: Germany Lithium Batteries for Long-Term Energy Storage Revenue (million) Forecast, by Application 2020 & 2033
- Table 40: Germany Lithium Batteries for Long-Term Energy Storage Volume (K) Forecast, by Application 2020 & 2033
- Table 41: France Lithium Batteries for Long-Term Energy Storage Revenue (million) Forecast, by Application 2020 & 2033
- Table 42: France Lithium Batteries for Long-Term Energy Storage Volume (K) Forecast, by Application 2020 & 2033
- Table 43: Italy Lithium Batteries for Long-Term Energy Storage Revenue (million) Forecast, by Application 2020 & 2033
- Table 44: Italy Lithium Batteries for Long-Term Energy Storage Volume (K) Forecast, by Application 2020 & 2033
- Table 45: Spain Lithium Batteries for Long-Term Energy Storage Revenue (million) Forecast, by Application 2020 & 2033
- Table 46: Spain Lithium Batteries for Long-Term Energy Storage Volume (K) Forecast, by Application 2020 & 2033
- Table 47: Russia Lithium Batteries for Long-Term Energy Storage Revenue (million) Forecast, by Application 2020 & 2033
- Table 48: Russia Lithium Batteries for Long-Term Energy Storage Volume (K) Forecast, by Application 2020 & 2033
- Table 49: Benelux Lithium Batteries for Long-Term Energy Storage Revenue (million) Forecast, by Application 2020 & 2033
- Table 50: Benelux Lithium Batteries for Long-Term Energy Storage Volume (K) Forecast, by Application 2020 & 2033
- Table 51: Nordics Lithium Batteries for Long-Term Energy Storage Revenue (million) Forecast, by Application 2020 & 2033
- Table 52: Nordics Lithium Batteries for Long-Term Energy Storage Volume (K) Forecast, by Application 2020 & 2033
- Table 53: Rest of Europe Lithium Batteries for Long-Term Energy Storage Revenue (million) Forecast, by Application 2020 & 2033
- Table 54: Rest of Europe Lithium Batteries for Long-Term Energy Storage Volume (K) Forecast, by Application 2020 & 2033
- Table 55: Global Lithium Batteries for Long-Term Energy Storage Revenue million Forecast, by Application 2020 & 2033
- Table 56: Global Lithium Batteries for Long-Term Energy Storage Volume K Forecast, by Application 2020 & 2033
- Table 57: Global Lithium Batteries for Long-Term Energy Storage Revenue million Forecast, by Types 2020 & 2033
- Table 58: Global Lithium Batteries for Long-Term Energy Storage Volume K Forecast, by Types 2020 & 2033
- Table 59: Global Lithium Batteries for Long-Term Energy Storage Revenue million Forecast, by Country 2020 & 2033
- Table 60: Global Lithium Batteries for Long-Term Energy Storage Volume K Forecast, by Country 2020 & 2033
- Table 61: Turkey Lithium Batteries for Long-Term Energy Storage Revenue (million) Forecast, by Application 2020 & 2033
- Table 62: Turkey Lithium Batteries for Long-Term Energy Storage Volume (K) Forecast, by Application 2020 & 2033
- Table 63: Israel Lithium Batteries for Long-Term Energy Storage Revenue (million) Forecast, by Application 2020 & 2033
- Table 64: Israel Lithium Batteries for Long-Term Energy Storage Volume (K) Forecast, by Application 2020 & 2033
- Table 65: GCC Lithium Batteries for Long-Term Energy Storage Revenue (million) Forecast, by Application 2020 & 2033
- Table 66: GCC Lithium Batteries for Long-Term Energy Storage Volume (K) Forecast, by Application 2020 & 2033
- Table 67: North Africa Lithium Batteries for Long-Term Energy Storage Revenue (million) Forecast, by Application 2020 & 2033
- Table 68: North Africa Lithium Batteries for Long-Term Energy Storage Volume (K) Forecast, by Application 2020 & 2033
- Table 69: South Africa Lithium Batteries for Long-Term Energy Storage Revenue (million) Forecast, by Application 2020 & 2033
- Table 70: South Africa Lithium Batteries for Long-Term Energy Storage Volume (K) Forecast, by Application 2020 & 2033
- Table 71: Rest of Middle East & Africa Lithium Batteries for Long-Term Energy Storage Revenue (million) Forecast, by Application 2020 & 2033
- Table 72: Rest of Middle East & Africa Lithium Batteries for Long-Term Energy Storage Volume (K) Forecast, by Application 2020 & 2033
- Table 73: Global Lithium Batteries for Long-Term Energy Storage Revenue million Forecast, by Application 2020 & 2033
- Table 74: Global Lithium Batteries for Long-Term Energy Storage Volume K Forecast, by Application 2020 & 2033
- Table 75: Global Lithium Batteries for Long-Term Energy Storage Revenue million Forecast, by Types 2020 & 2033
- Table 76: Global Lithium Batteries for Long-Term Energy Storage Volume K Forecast, by Types 2020 & 2033
- Table 77: Global Lithium Batteries for Long-Term Energy Storage Revenue million Forecast, by Country 2020 & 2033
- Table 78: Global Lithium Batteries for Long-Term Energy Storage Volume K Forecast, by Country 2020 & 2033
- Table 79: China Lithium Batteries for Long-Term Energy Storage Revenue (million) Forecast, by Application 2020 & 2033
- Table 80: China Lithium Batteries for Long-Term Energy Storage Volume (K) Forecast, by Application 2020 & 2033
- Table 81: India Lithium Batteries for Long-Term Energy Storage Revenue (million) Forecast, by Application 2020 & 2033
- Table 82: India Lithium Batteries for Long-Term Energy Storage Volume (K) Forecast, by Application 2020 & 2033
- Table 83: Japan Lithium Batteries for Long-Term Energy Storage Revenue (million) Forecast, by Application 2020 & 2033
- Table 84: Japan Lithium Batteries for Long-Term Energy Storage Volume (K) Forecast, by Application 2020 & 2033
- Table 85: South Korea Lithium Batteries for Long-Term Energy Storage Revenue (million) Forecast, by Application 2020 & 2033
- Table 86: South Korea Lithium Batteries for Long-Term Energy Storage Volume (K) Forecast, by Application 2020 & 2033
- Table 87: ASEAN Lithium Batteries for Long-Term Energy Storage Revenue (million) Forecast, by Application 2020 & 2033
- Table 88: ASEAN Lithium Batteries for Long-Term Energy Storage Volume (K) Forecast, by Application 2020 & 2033
- Table 89: Oceania Lithium Batteries for Long-Term Energy Storage Revenue (million) Forecast, by Application 2020 & 2033
- Table 90: Oceania Lithium Batteries for Long-Term Energy Storage Volume (K) Forecast, by Application 2020 & 2033
- Table 91: Rest of Asia Pacific Lithium Batteries for Long-Term Energy Storage Revenue (million) Forecast, by Application 2020 & 2033
- Table 92: Rest of Asia Pacific Lithium Batteries for Long-Term Energy Storage Volume (K) Forecast, by Application 2020 & 2033
Frequently Asked Questions
1. What is the projected Compound Annual Growth Rate (CAGR) of the Lithium Batteries for Long-Term Energy Storage?
The projected CAGR is approximately XX%.
2. Which companies are prominent players in the Lithium Batteries for Long-Term Energy Storage?
Key companies in the market include CATL, BYD, EVE, LG Energy Solution, Samsung SDI, REPT, Great Power, Hithium, Ganfeng, CALB, Envision AESC, Poweramp, Saft, Kokam.
3. What are the main segments of the Lithium Batteries for Long-Term Energy Storage?
The market segments include Application, Types.
4. Can you provide details about the market size?
The market size is estimated to be USD XXX million as of 2022.
5. What are some drivers contributing to market growth?
N/A
6. What are the notable trends driving market growth?
N/A
7. Are there any restraints impacting market growth?
N/A
8. Can you provide examples of recent developments in the market?
N/A
9. What pricing options are available for accessing the report?
Pricing options include single-user, multi-user, and enterprise licenses priced at USD 3350.00, USD 5025.00, and USD 6700.00 respectively.
10. Is the market size provided in terms of value or volume?
The market size is provided in terms of value, measured in million and volume, measured in K.
11. Are there any specific market keywords associated with the report?
Yes, the market keyword associated with the report is "Lithium Batteries for Long-Term Energy Storage," which aids in identifying and referencing the specific market segment covered.
12. How do I determine which pricing option suits my needs best?
The pricing options vary based on user requirements and access needs. Individual users may opt for single-user licenses, while businesses requiring broader access may choose multi-user or enterprise licenses for cost-effective access to the report.
13. Are there any additional resources or data provided in the Lithium Batteries for Long-Term Energy Storage report?
While the report offers comprehensive insights, it's advisable to review the specific contents or supplementary materials provided to ascertain if additional resources or data are available.
14. How can I stay updated on further developments or reports in the Lithium Batteries for Long-Term Energy Storage?
To stay informed about further developments, trends, and reports in the Lithium Batteries for Long-Term Energy Storage, consider subscribing to industry newsletters, following relevant companies and organizations, or regularly checking reputable industry news sources and publications.
Methodology
Step 1 - Identification of Relevant Samples Size from Population Database


Step 2 - Approaches for Defining Global Market Size (Value, Volume* & Price*)

Note*: In applicable scenarios
Step 3 - Data Sources
Primary Research
- Web Analytics
- Survey Reports
- Research Institute
- Latest Research Reports
- Opinion Leaders
Secondary Research
- Annual Reports
- White Paper
- Latest Press Release
- Industry Association
- Paid Database
- Investor Presentations

Step 4 - Data Triangulation
Involves using different sources of information in order to increase the validity of a study
These sources are likely to be stakeholders in a program - participants, other researchers, program staff, other community members, and so on.
Then we put all data in single framework & apply various statistical tools to find out the dynamic on the market.
During the analysis stage, feedback from the stakeholder groups would be compared to determine areas of agreement as well as areas of divergence