

Key Insights
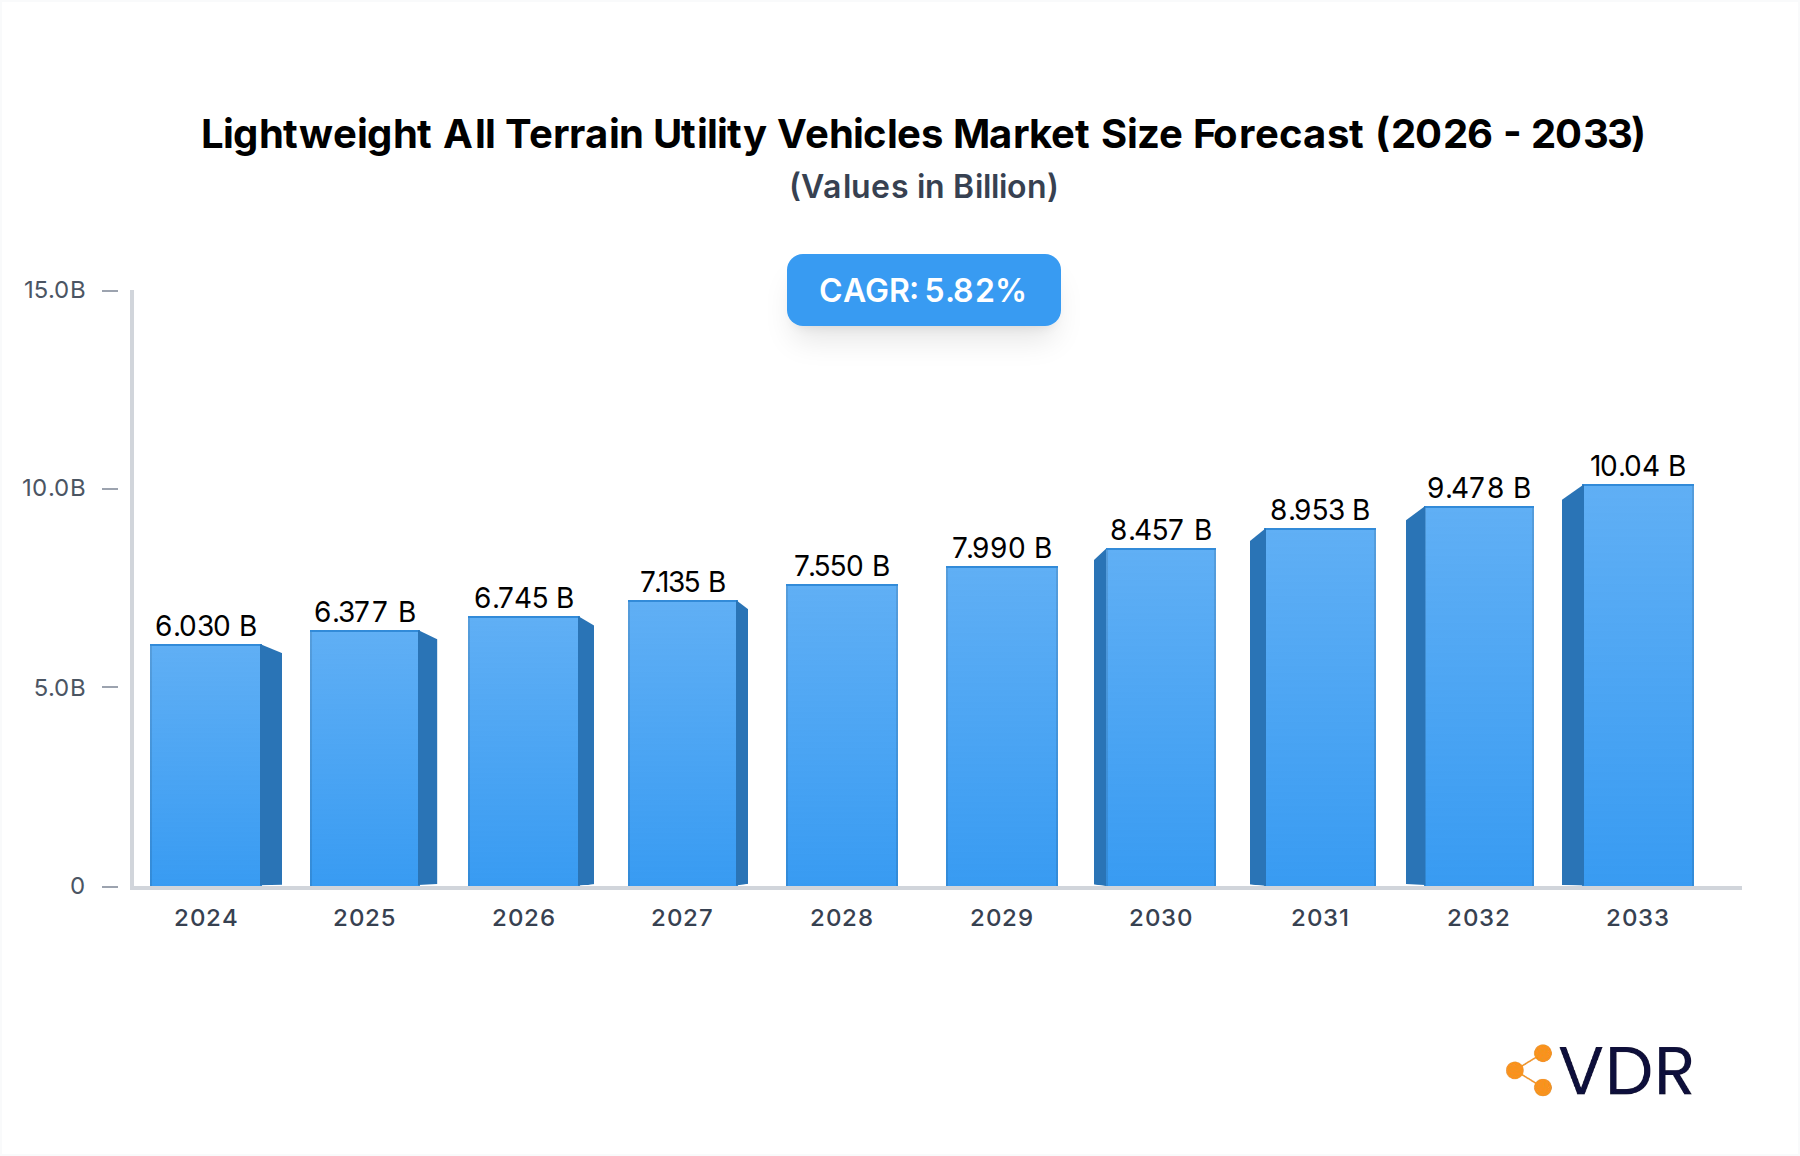
The global Lightweight All-Terrain Utility Vehicle (ATV) market is experiencing robust expansion, projected to reach an estimated USD 6.03 billion in 2024. This growth is underpinned by a compelling Compound Annual Growth Rate (CAGR) of 5.7% from 2019 to 2033, indicating sustained demand and a healthy trajectory for the sector. Key drivers fueling this expansion include increasing recreational activities, the growing adoption of ATVs in diverse industrial applications such as agriculture and forestry, and advancements in vehicle technology leading to more efficient and versatile models. The demand for lightweight, fuel-efficient, and eco-friendly ATVs is particularly on the rise, aligning with global sustainability trends and consumer preferences. Furthermore, the military and defense sector is increasingly integrating ATVs for reconnaissance and tactical operations, contributing significantly to market penetration.

Lightweight All Terrain Utility Vehicles Market Size (In Billion)
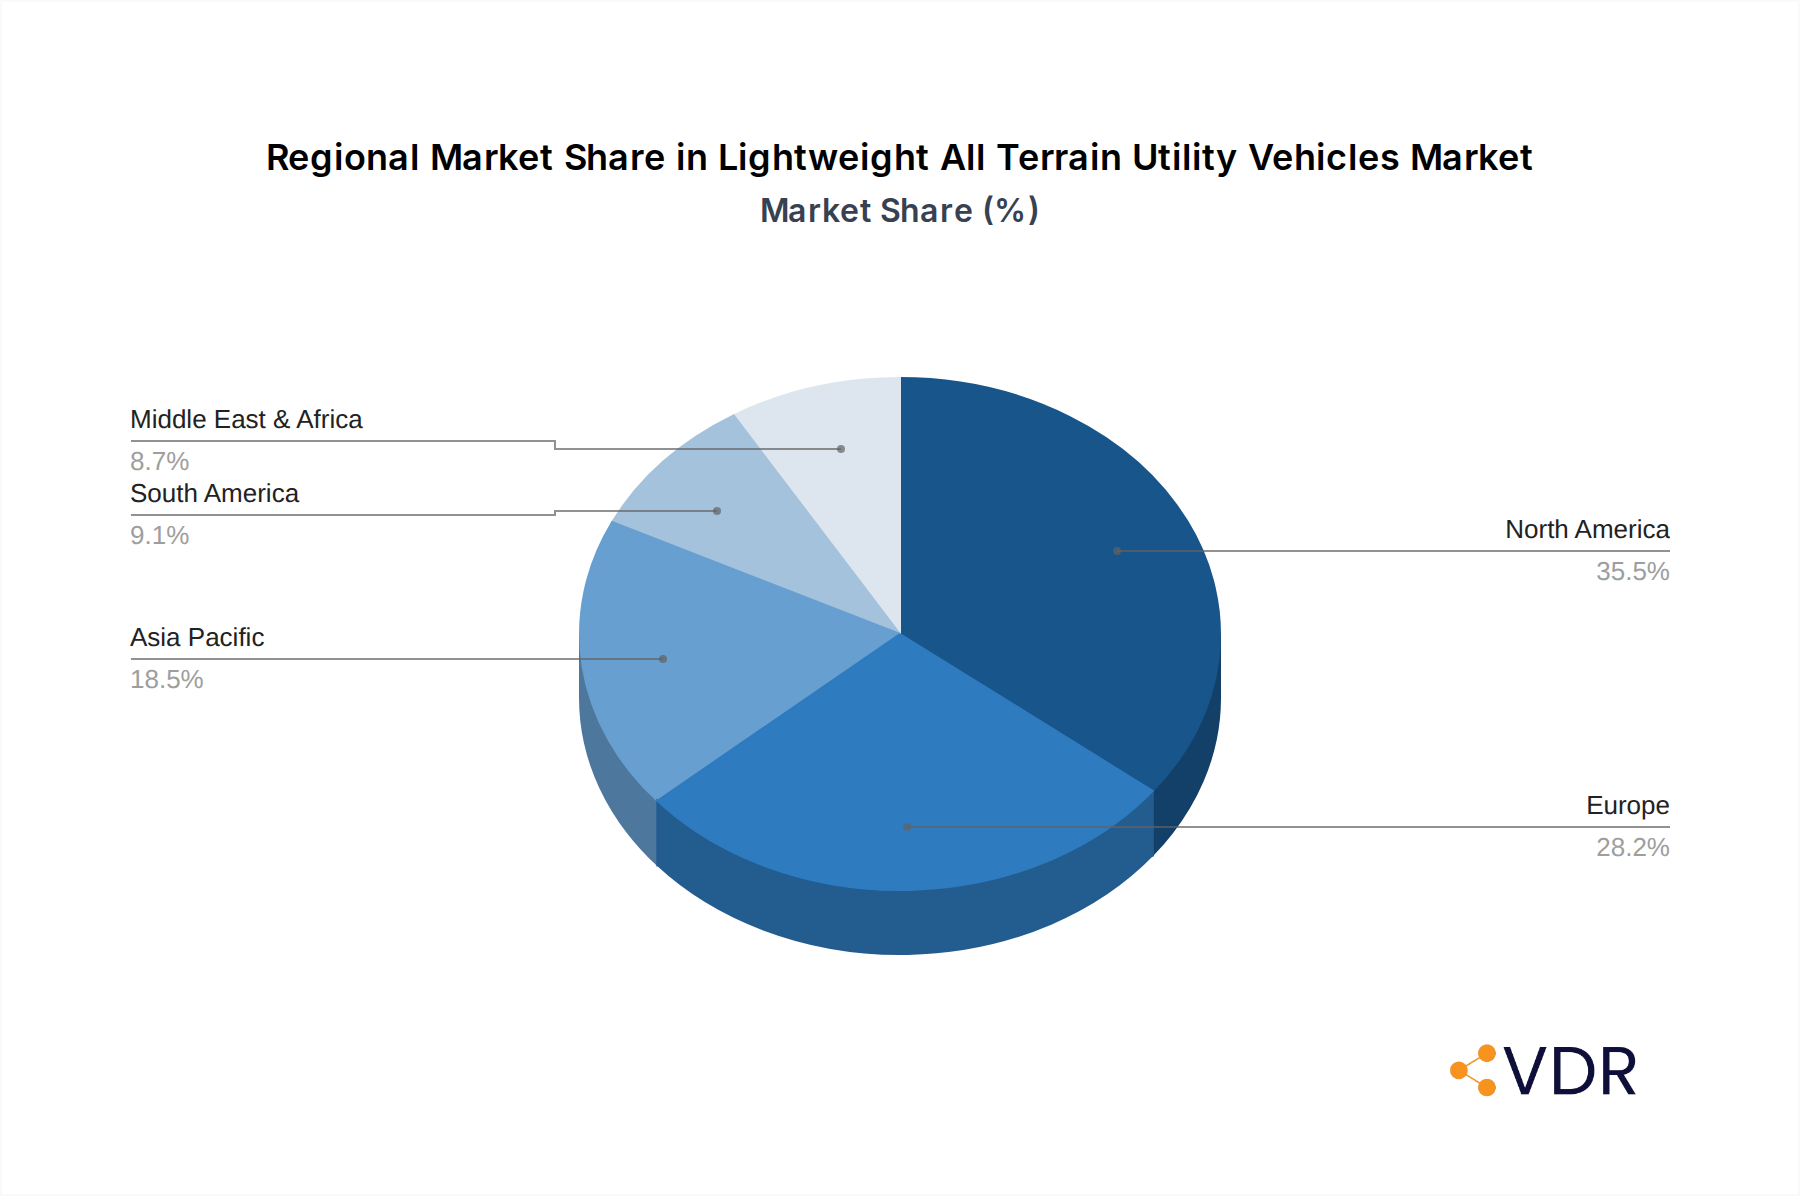
Segmentation analysis reveals that while Sports ATVs remain popular for recreational pursuits, the Utility All-Terrain Vehicle segment is poised for substantial growth, driven by their multi-functional capabilities in challenging terrains across agriculture, forestry, and construction. The "Others" application segment, likely encompassing industrial and emergency services, also presents untapped potential. Geographically, North America and Europe currently dominate the market due to a strong recreational culture and established industrial sectors. However, the Asia Pacific region, particularly China and India, is anticipated to witness the fastest growth, propelled by increasing disposable incomes, a burgeoning middle class embracing outdoor lifestyles, and government initiatives promoting rural development that necessitate utility vehicles. Major players like Polaris Industries, Yamaha, and Arctic Cat are actively investing in product innovation and market expansion to capitalize on these evolving dynamics.
Lightweight All Terrain Utility Vehicles Company Market Share
Lightweight All Terrain Utility Vehicles Market Dynamics & Structure
The global Lightweight All Terrain Utility Vehicle (ATUV) market is characterized by a moderately concentrated landscape, with major players like Polaris Industries, Can-Am, Arctic Cat, and Yamaha dominating market share, estimated at approximately 65% collectively. Technological innovation remains a primary driver, fueled by advancements in engine efficiency, material science (e.g., lightweight composites), and enhanced suspension systems, which are critical for improved performance across diverse terrains. Regulatory frameworks, particularly concerning emissions standards and safety certifications in North America and Europe, significantly shape product development and market entry strategies. Competitive product substitutes, including UTVs (Utility Task Vehicles) with larger capacities and specialized off-road motorcycles, present a constant challenge, necessitating continuous innovation in ATUVs’ agility and versatility. End-user demographics are expanding beyond traditional recreational users to include a growing segment of agricultural, forestry, and military/defense applications, demanding more robust and task-specific ATUV configurations. Mergers & Acquisitions (M&A) activity, though moderate, has seen strategic consolidations, with an estimated 3-5 significant deals annually within the broader powersports sector, aimed at expanding product portfolios and market reach.
- Market Concentration: Moderately concentrated with top players holding substantial market share.
- Technological Innovation: Driven by engine efficiency, lightweight materials, and advanced suspension.
- Regulatory Impact: Emissions and safety standards in key markets dictate product design.
- Competitive Landscape: UTVs and off-road motorcycles are key substitutes.
- End-User Expansion: Increasing demand from industrial and defense sectors.
- M&A Trends: Strategic consolidations for portfolio expansion and market penetration.
Lightweight All Terrain Utility Vehicles Growth Trends & Insights
The global Lightweight All Terrain Utility Vehicle (ATUV) market is projected for robust growth, driven by an increasing consumer appetite for off-road recreation and the expanding utility applications across various industries. The market size, valued at an estimated $8.5 billion in the base year 2025, is anticipated to witness a Compound Annual Growth Rate (CAGR) of approximately 6.8% during the forecast period of 2025–2033. This upward trajectory is underpinned by several key trends. Firstly, enhanced disposable incomes and a growing interest in outdoor adventure activities, particularly in emerging economies, are fueling demand for ATUVs for recreational purposes. The "Sports All-Terrain Vehicle" segment, known for its agility and performance, is expected to see sustained growth. Secondly, the inherent versatility of ATUVs, especially the "Utility All-Terrain Vehicle" type, is making them indispensable tools in sectors like agriculture, forestry, and even in light logistics for remote areas. Their ability to navigate challenging terrains efficiently, coupled with growing payload capacities, is driving adoption in these industrial applications. Technological disruptions are also playing a pivotal role. The integration of electric powertrains, while still in its nascent stages for ATUVs, presents a significant long-term growth avenue, driven by environmental regulations and consumer preference for sustainable mobility. Furthermore, advancements in safety features, such as Electronic Stability Control (ESC) and improved braking systems, are addressing consumer concerns and broadening the appeal of ATUVs to a wider demographic, including families and novice riders, contributing to the growth of the "Youth All-Terrain Vehicle" segment. Consumer behavior is shifting towards a greater emphasis on performance, durability, and customizability, compelling manufacturers to offer a diverse range of models and accessories. The market penetration of ATUVs is gradually increasing globally, supported by expanding distribution networks and a growing awareness of their capabilities. The historical data from 2019–2024 indicates a consistent growth pattern, interrupted only briefly by global supply chain disruptions, which are now largely being mitigated. The overall market trajectory suggests a sustained and accelerated expansion in the coming decade, driven by both recreational enthusiasm and practical utility demands.
Dominant Regions, Countries, or Segments in Lightweight All Terrain Utility Vehicles
The North American region consistently emerges as the dominant force in the global Lightweight All Terrain Utility Vehicle (ATUV) market, driven by a confluence of factors that foster both recreational and utilitarian adoption. Within North America, the United States stands out as the single largest country market, contributing an estimated 45% of the total regional revenue. This dominance is attributable to a deeply entrenched culture of outdoor recreation, a vast network of off-road trails and wilderness areas, and a strong consumer base with high disposable incomes. Furthermore, the substantial agricultural and forestry sectors in the US necessitate the use of robust and agile utility vehicles, directly fueling the demand for "Utility All-Terrain Vehicle" models. The regulatory environment in the US, while present, has historically been more accommodating to powersports vehicles compared to some European counterparts, further bolstering market growth.
The "Sports All-Terrain Vehicle" segment within the application category of "Sports & Entertainment" is a primary growth engine in this region, representing a significant market share of approximately 50% of all ATUV sales in North America. This segment is propelled by a burgeoning interest in adventure tourism and off-road racing, coupled with continuous innovation in performance features by leading manufacturers.
However, the "Agriculture" application segment is rapidly gaining traction, exhibiting a higher CAGR than the sports segment during the forecast period. Farmers and land managers are increasingly recognizing the cost-effectiveness and operational efficiency offered by ATUVs over traditional farm machinery for tasks like surveying land, hauling feed, and light plowing in varied terrains. This growing utility demand is also influencing product development, with manufacturers focusing on enhanced towing capacities and specialized attachments.
From a type perspective, "Utility All-Terrain Vehicle" constitutes a substantial portion of the market, closely followed by "Sports All-Terrain Vehicle." The "Youth All-Terrain Vehicle" segment, while smaller in overall market share, is experiencing significant growth due to increased parental investment in outdoor activities for children and enhanced safety features designed for younger riders.
The robust infrastructure for outdoor recreational activities, coupled with supportive government policies promoting land use for recreation and the vital role of ATUVs in agricultural productivity, solidify North America's leading position. The region’s market penetration is already high, but continuous innovation and expanding utility applications are expected to sustain its growth momentum.
Lightweight All Terrain Utility Vehicles Product Landscape
The product landscape for Lightweight All Terrain Utility Vehicles is characterized by a relentless pursuit of enhanced performance, durability, and user experience. Innovations span from more powerful and fuel-efficient engine technologies to advanced suspension systems that optimize ride comfort and handling across diverse terrains. Manufacturers are increasingly integrating smart technologies, including GPS navigation, integrated storage solutions, and customizable digital displays, to cater to the evolving needs of both recreational and professional users. Unique selling propositions often lie in the specific capabilities offered, such as superior ground clearance, agile maneuverability for tight trails, or robust hauling and towing capacities for utility tasks. Technological advancements are also focusing on lightweight material composites to improve power-to-weight ratios and overall efficiency, making these vehicles more accessible and versatile.
Key Drivers, Barriers & Challenges in Lightweight All Terrain Utility Vehicles
Key Drivers:
The Lightweight All Terrain Utility Vehicle market is propelled by a strong surge in demand for outdoor recreational activities, fueled by increasing disposable incomes and a growing desire for adventure. Technological advancements in engine efficiency, material science for lighter and stronger frames, and improved suspension systems are enhancing performance and user experience. The expanding utility applications in agriculture, forestry, and military/defense sectors, due to their agility and cost-effectiveness in challenging terrains, represent a significant growth catalyst.
Key Barriers & Challenges:
Supply chain disruptions, particularly concerning semiconductors and raw materials, can impact production volumes and lead times, posing a significant challenge. Stringent regulatory frameworks concerning emissions, noise pollution, and safety standards in various regions can increase development costs and limit product offerings. High initial purchase costs can be a barrier for some consumer segments, while competition from established powersports segments and specialized vehicles also presents a restraint. Environmental concerns and the push for sustainable solutions necessitate investment in cleaner technologies, which can be a capital-intensive challenge.
Emerging Opportunities in Lightweight All Terrain Utility Vehicles
Emerging opportunities lie in the development and adoption of electric Lightweight All Terrain Utility Vehicles, driven by growing environmental consciousness and demand for sustainable solutions. The expansion of ATUVs into new geographical markets, particularly in developing economies with increasing outdoor recreational interest and agricultural modernization, presents a significant untapped potential. Furthermore, the growing demand for specialized ATUVs for niche applications, such as search and rescue operations, remote infrastructure maintenance, and compact cargo delivery in urban environments, offers avenues for innovation and market diversification.
Growth Accelerators in the Lightweight All Terrain Utility Vehicles Industry
Long-term growth in the Lightweight All Terrain Utility Vehicle industry is being accelerated by continuous technological breakthroughs, including advancements in battery technology for electric variants and the integration of AI for enhanced navigation and safety features. Strategic partnerships between manufacturers and technology providers are fostering the development of innovative powertrains and intelligent systems. Market expansion strategies, such as increased penetration into emerging economies and the development of entry-level, more affordable models, are also crucial growth accelerators. Furthermore, the growing trend of adventure tourism and the increasing use of ATUVs in commercial applications are creating sustained demand.
Key Players Shaping the Lightweight All Terrain Utility Vehicles Market
Arctic Cat Can-Am Polaris Industries Yamaha Cectek CF Moto HiSun Motors Honda Motor John Deere Kawasaki Motors KYMCO Linhai Suzuki Motor Taiwan Golden Bee (TGB)
Notable Milestones in Lightweight All Terrain Utility Vehicles Sector
- 2019: Introduction of advanced electric-assist powertrains in select models, enhancing efficiency and reducing emissions.
- 2020: Increased adoption of lightweight composite materials in vehicle construction, improving performance and fuel economy.
- 2021: Significant growth in online sales channels and virtual showrooms, expanding market reach and accessibility.
- 2022: Enhanced safety features, including improved braking systems and rollover protection, becoming standard on more models.
- 2023: Growing partnerships for developing integrated GPS and telemetry systems for fleet management and recreational tracking.
- 2024: Initial prototypes of fully electric ATUVs with extended range capabilities showcased at industry events.
In-Depth Lightweight All Terrain Utility Vehicles Market Outlook
The future outlook for the Lightweight All Terrain Utility Vehicle market is exceptionally promising, driven by a potent combination of sustained recreational demand and expanding industrial utility. Growth accelerators such as the ongoing electrification trend, promising significant advancements in battery technology to overcome range anxiety, will revolutionize the sector. Strategic partnerships for developing cutting-edge AI-powered safety and navigation systems will enhance user experience and broaden appeal. Furthermore, aggressive market expansion into underserved regions and the introduction of highly specialized ATUVs for diverse commercial and public service applications, like environmental monitoring and emergency response, will unlock new revenue streams. The industry is poised for a period of dynamic innovation and significant market growth.
Lightweight All Terrain Utility Vehicles Segmentation
-
1. Application
- 1.1. Military and Defense
- 1.2. Sports
- 1.3. Entertainment
- 1.4. Agriculture
- 1.5. Forestry
- 1.6. Others
-
2. Types
- 2.1. Sports All-Terrain Vehicle
- 2.2. Utility All-Terrain Vehicle
- 2.3. Youth All-Terrain Vehicle
Lightweight All Terrain Utility Vehicles Segmentation By Geography
-
1. North America
- 1.1. United States
- 1.2. Canada
- 1.3. Mexico
-
2. South America
- 2.1. Brazil
- 2.2. Argentina
- 2.3. Rest of South America
-
3. Europe
- 3.1. United Kingdom
- 3.2. Germany
- 3.3. France
- 3.4. Italy
- 3.5. Spain
- 3.6. Russia
- 3.7. Benelux
- 3.8. Nordics
- 3.9. Rest of Europe
-
4. Middle East & Africa
- 4.1. Turkey
- 4.2. Israel
- 4.3. GCC
- 4.4. North Africa
- 4.5. South Africa
- 4.6. Rest of Middle East & Africa
-
5. Asia Pacific
- 5.1. China
- 5.2. India
- 5.3. Japan
- 5.4. South Korea
- 5.5. ASEAN
- 5.6. Oceania
- 5.7. Rest of Asia Pacific
Lightweight All Terrain Utility Vehicles Regional Market Share
Geographic Coverage of Lightweight All Terrain Utility Vehicles
Lightweight All Terrain Utility Vehicles REPORT HIGHLIGHTS
| Aspects | Details |
|---|---|
| Study Period | 2020-2034 |
| Base Year | 2025 |
| Estimated Year | 2026 |
| Forecast Period | 2026-2034 |
| Historical Period | 2020-2025 |
| Growth Rate | CAGR of 5.7% from 2020-2034 |
| Segmentation |
|
Table of Contents
- 1. Introduction
- 1.1. Research Scope
- 1.2. Market Segmentation
- 1.3. Research Methodology
- 1.4. Definitions and Assumptions
- 2. Executive Summary
- 2.1. Introduction
- 3. Market Dynamics
- 3.1. Introduction
- 3.2. Market Drivers
- 3.3. Market Restrains
- 3.4. Market Trends
- 4. Market Factor Analysis
- 4.1. Porters Five Forces
- 4.2. Supply/Value Chain
- 4.3. PESTEL analysis
- 4.4. Market Entropy
- 4.5. Patent/Trademark Analysis
- 5. Global Lightweight All Terrain Utility Vehicles Analysis, Insights and Forecast, 2020-2032
- 5.1. Market Analysis, Insights and Forecast - by Application
- 5.1.1. Military and Defense
- 5.1.2. Sports
- 5.1.3. Entertainment
- 5.1.4. Agriculture
- 5.1.5. Forestry
- 5.1.6. Others
- 5.2. Market Analysis, Insights and Forecast - by Types
- 5.2.1. Sports All-Terrain Vehicle
- 5.2.2. Utility All-Terrain Vehicle
- 5.2.3. Youth All-Terrain Vehicle
- 5.3. Market Analysis, Insights and Forecast - by Region
- 5.3.1. North America
- 5.3.2. South America
- 5.3.3. Europe
- 5.3.4. Middle East & Africa
- 5.3.5. Asia Pacific
- 5.1. Market Analysis, Insights and Forecast - by Application
- 6. North America Lightweight All Terrain Utility Vehicles Analysis, Insights and Forecast, 2020-2032
- 6.1. Market Analysis, Insights and Forecast - by Application
- 6.1.1. Military and Defense
- 6.1.2. Sports
- 6.1.3. Entertainment
- 6.1.4. Agriculture
- 6.1.5. Forestry
- 6.1.6. Others
- 6.2. Market Analysis, Insights and Forecast - by Types
- 6.2.1. Sports All-Terrain Vehicle
- 6.2.2. Utility All-Terrain Vehicle
- 6.2.3. Youth All-Terrain Vehicle
- 6.1. Market Analysis, Insights and Forecast - by Application
- 7. South America Lightweight All Terrain Utility Vehicles Analysis, Insights and Forecast, 2020-2032
- 7.1. Market Analysis, Insights and Forecast - by Application
- 7.1.1. Military and Defense
- 7.1.2. Sports
- 7.1.3. Entertainment
- 7.1.4. Agriculture
- 7.1.5. Forestry
- 7.1.6. Others
- 7.2. Market Analysis, Insights and Forecast - by Types
- 7.2.1. Sports All-Terrain Vehicle
- 7.2.2. Utility All-Terrain Vehicle
- 7.2.3. Youth All-Terrain Vehicle
- 7.1. Market Analysis, Insights and Forecast - by Application
- 8. Europe Lightweight All Terrain Utility Vehicles Analysis, Insights and Forecast, 2020-2032
- 8.1. Market Analysis, Insights and Forecast - by Application
- 8.1.1. Military and Defense
- 8.1.2. Sports
- 8.1.3. Entertainment
- 8.1.4. Agriculture
- 8.1.5. Forestry
- 8.1.6. Others
- 8.2. Market Analysis, Insights and Forecast - by Types
- 8.2.1. Sports All-Terrain Vehicle
- 8.2.2. Utility All-Terrain Vehicle
- 8.2.3. Youth All-Terrain Vehicle
- 8.1. Market Analysis, Insights and Forecast - by Application
- 9. Middle East & Africa Lightweight All Terrain Utility Vehicles Analysis, Insights and Forecast, 2020-2032
- 9.1. Market Analysis, Insights and Forecast - by Application
- 9.1.1. Military and Defense
- 9.1.2. Sports
- 9.1.3. Entertainment
- 9.1.4. Agriculture
- 9.1.5. Forestry
- 9.1.6. Others
- 9.2. Market Analysis, Insights and Forecast - by Types
- 9.2.1. Sports All-Terrain Vehicle
- 9.2.2. Utility All-Terrain Vehicle
- 9.2.3. Youth All-Terrain Vehicle
- 9.1. Market Analysis, Insights and Forecast - by Application
- 10. Asia Pacific Lightweight All Terrain Utility Vehicles Analysis, Insights and Forecast, 2020-2032
- 10.1. Market Analysis, Insights and Forecast - by Application
- 10.1.1. Military and Defense
- 10.1.2. Sports
- 10.1.3. Entertainment
- 10.1.4. Agriculture
- 10.1.5. Forestry
- 10.1.6. Others
- 10.2. Market Analysis, Insights and Forecast - by Types
- 10.2.1. Sports All-Terrain Vehicle
- 10.2.2. Utility All-Terrain Vehicle
- 10.2.3. Youth All-Terrain Vehicle
- 10.1. Market Analysis, Insights and Forecast - by Application
- 11. Competitive Analysis
- 11.1. Global Market Share Analysis 2025
- 11.2. Company Profiles
- 11.2.1 Arctic Cat
- 11.2.1.1. Overview
- 11.2.1.2. Products
- 11.2.1.3. SWOT Analysis
- 11.2.1.4. Recent Developments
- 11.2.1.5. Financials (Based on Availability)
- 11.2.2 Can-Am
- 11.2.2.1. Overview
- 11.2.2.2. Products
- 11.2.2.3. SWOT Analysis
- 11.2.2.4. Recent Developments
- 11.2.2.5. Financials (Based on Availability)
- 11.2.3 Polaris Industries
- 11.2.3.1. Overview
- 11.2.3.2. Products
- 11.2.3.3. SWOT Analysis
- 11.2.3.4. Recent Developments
- 11.2.3.5. Financials (Based on Availability)
- 11.2.4 Yamaha
- 11.2.4.1. Overview
- 11.2.4.2. Products
- 11.2.4.3. SWOT Analysis
- 11.2.4.4. Recent Developments
- 11.2.4.5. Financials (Based on Availability)
- 11.2.5 Cectek
- 11.2.5.1. Overview
- 11.2.5.2. Products
- 11.2.5.3. SWOT Analysis
- 11.2.5.4. Recent Developments
- 11.2.5.5. Financials (Based on Availability)
- 11.2.6 CF Moto
- 11.2.6.1. Overview
- 11.2.6.2. Products
- 11.2.6.3. SWOT Analysis
- 11.2.6.4. Recent Developments
- 11.2.6.5. Financials (Based on Availability)
- 11.2.7 HiSun Motors
- 11.2.7.1. Overview
- 11.2.7.2. Products
- 11.2.7.3. SWOT Analysis
- 11.2.7.4. Recent Developments
- 11.2.7.5. Financials (Based on Availability)
- 11.2.8 Honda Motor
- 11.2.8.1. Overview
- 11.2.8.2. Products
- 11.2.8.3. SWOT Analysis
- 11.2.8.4. Recent Developments
- 11.2.8.5. Financials (Based on Availability)
- 11.2.9 John Deere
- 11.2.9.1. Overview
- 11.2.9.2. Products
- 11.2.9.3. SWOT Analysis
- 11.2.9.4. Recent Developments
- 11.2.9.5. Financials (Based on Availability)
- 11.2.10 Kawasaki Motors
- 11.2.10.1. Overview
- 11.2.10.2. Products
- 11.2.10.3. SWOT Analysis
- 11.2.10.4. Recent Developments
- 11.2.10.5. Financials (Based on Availability)
- 11.2.11 KYMCO
- 11.2.11.1. Overview
- 11.2.11.2. Products
- 11.2.11.3. SWOT Analysis
- 11.2.11.4. Recent Developments
- 11.2.11.5. Financials (Based on Availability)
- 11.2.12 Linhai
- 11.2.12.1. Overview
- 11.2.12.2. Products
- 11.2.12.3. SWOT Analysis
- 11.2.12.4. Recent Developments
- 11.2.12.5. Financials (Based on Availability)
- 11.2.13 Suzuki Motor
- 11.2.13.1. Overview
- 11.2.13.2. Products
- 11.2.13.3. SWOT Analysis
- 11.2.13.4. Recent Developments
- 11.2.13.5. Financials (Based on Availability)
- 11.2.14 Taiwan Golden Bee (TGB)
- 11.2.14.1. Overview
- 11.2.14.2. Products
- 11.2.14.3. SWOT Analysis
- 11.2.14.4. Recent Developments
- 11.2.14.5. Financials (Based on Availability)
- 11.2.1 Arctic Cat
List of Figures
- Figure 1: Global Lightweight All Terrain Utility Vehicles Revenue Breakdown (billion, %) by Region 2025 & 2033
- Figure 2: North America Lightweight All Terrain Utility Vehicles Revenue (billion), by Application 2025 & 2033
- Figure 3: North America Lightweight All Terrain Utility Vehicles Revenue Share (%), by Application 2025 & 2033
- Figure 4: North America Lightweight All Terrain Utility Vehicles Revenue (billion), by Types 2025 & 2033
- Figure 5: North America Lightweight All Terrain Utility Vehicles Revenue Share (%), by Types 2025 & 2033
- Figure 6: North America Lightweight All Terrain Utility Vehicles Revenue (billion), by Country 2025 & 2033
- Figure 7: North America Lightweight All Terrain Utility Vehicles Revenue Share (%), by Country 2025 & 2033
- Figure 8: South America Lightweight All Terrain Utility Vehicles Revenue (billion), by Application 2025 & 2033
- Figure 9: South America Lightweight All Terrain Utility Vehicles Revenue Share (%), by Application 2025 & 2033
- Figure 10: South America Lightweight All Terrain Utility Vehicles Revenue (billion), by Types 2025 & 2033
- Figure 11: South America Lightweight All Terrain Utility Vehicles Revenue Share (%), by Types 2025 & 2033
- Figure 12: South America Lightweight All Terrain Utility Vehicles Revenue (billion), by Country 2025 & 2033
- Figure 13: South America Lightweight All Terrain Utility Vehicles Revenue Share (%), by Country 2025 & 2033
- Figure 14: Europe Lightweight All Terrain Utility Vehicles Revenue (billion), by Application 2025 & 2033
- Figure 15: Europe Lightweight All Terrain Utility Vehicles Revenue Share (%), by Application 2025 & 2033
- Figure 16: Europe Lightweight All Terrain Utility Vehicles Revenue (billion), by Types 2025 & 2033
- Figure 17: Europe Lightweight All Terrain Utility Vehicles Revenue Share (%), by Types 2025 & 2033
- Figure 18: Europe Lightweight All Terrain Utility Vehicles Revenue (billion), by Country 2025 & 2033
- Figure 19: Europe Lightweight All Terrain Utility Vehicles Revenue Share (%), by Country 2025 & 2033
- Figure 20: Middle East & Africa Lightweight All Terrain Utility Vehicles Revenue (billion), by Application 2025 & 2033
- Figure 21: Middle East & Africa Lightweight All Terrain Utility Vehicles Revenue Share (%), by Application 2025 & 2033
- Figure 22: Middle East & Africa Lightweight All Terrain Utility Vehicles Revenue (billion), by Types 2025 & 2033
- Figure 23: Middle East & Africa Lightweight All Terrain Utility Vehicles Revenue Share (%), by Types 2025 & 2033
- Figure 24: Middle East & Africa Lightweight All Terrain Utility Vehicles Revenue (billion), by Country 2025 & 2033
- Figure 25: Middle East & Africa Lightweight All Terrain Utility Vehicles Revenue Share (%), by Country 2025 & 2033
- Figure 26: Asia Pacific Lightweight All Terrain Utility Vehicles Revenue (billion), by Application 2025 & 2033
- Figure 27: Asia Pacific Lightweight All Terrain Utility Vehicles Revenue Share (%), by Application 2025 & 2033
- Figure 28: Asia Pacific Lightweight All Terrain Utility Vehicles Revenue (billion), by Types 2025 & 2033
- Figure 29: Asia Pacific Lightweight All Terrain Utility Vehicles Revenue Share (%), by Types 2025 & 2033
- Figure 30: Asia Pacific Lightweight All Terrain Utility Vehicles Revenue (billion), by Country 2025 & 2033
- Figure 31: Asia Pacific Lightweight All Terrain Utility Vehicles Revenue Share (%), by Country 2025 & 2033
List of Tables
- Table 1: Global Lightweight All Terrain Utility Vehicles Revenue billion Forecast, by Application 2020 & 2033
- Table 2: Global Lightweight All Terrain Utility Vehicles Revenue billion Forecast, by Types 2020 & 2033
- Table 3: Global Lightweight All Terrain Utility Vehicles Revenue billion Forecast, by Region 2020 & 2033
- Table 4: Global Lightweight All Terrain Utility Vehicles Revenue billion Forecast, by Application 2020 & 2033
- Table 5: Global Lightweight All Terrain Utility Vehicles Revenue billion Forecast, by Types 2020 & 2033
- Table 6: Global Lightweight All Terrain Utility Vehicles Revenue billion Forecast, by Country 2020 & 2033
- Table 7: United States Lightweight All Terrain Utility Vehicles Revenue (billion) Forecast, by Application 2020 & 2033
- Table 8: Canada Lightweight All Terrain Utility Vehicles Revenue (billion) Forecast, by Application 2020 & 2033
- Table 9: Mexico Lightweight All Terrain Utility Vehicles Revenue (billion) Forecast, by Application 2020 & 2033
- Table 10: Global Lightweight All Terrain Utility Vehicles Revenue billion Forecast, by Application 2020 & 2033
- Table 11: Global Lightweight All Terrain Utility Vehicles Revenue billion Forecast, by Types 2020 & 2033
- Table 12: Global Lightweight All Terrain Utility Vehicles Revenue billion Forecast, by Country 2020 & 2033
- Table 13: Brazil Lightweight All Terrain Utility Vehicles Revenue (billion) Forecast, by Application 2020 & 2033
- Table 14: Argentina Lightweight All Terrain Utility Vehicles Revenue (billion) Forecast, by Application 2020 & 2033
- Table 15: Rest of South America Lightweight All Terrain Utility Vehicles Revenue (billion) Forecast, by Application 2020 & 2033
- Table 16: Global Lightweight All Terrain Utility Vehicles Revenue billion Forecast, by Application 2020 & 2033
- Table 17: Global Lightweight All Terrain Utility Vehicles Revenue billion Forecast, by Types 2020 & 2033
- Table 18: Global Lightweight All Terrain Utility Vehicles Revenue billion Forecast, by Country 2020 & 2033
- Table 19: United Kingdom Lightweight All Terrain Utility Vehicles Revenue (billion) Forecast, by Application 2020 & 2033
- Table 20: Germany Lightweight All Terrain Utility Vehicles Revenue (billion) Forecast, by Application 2020 & 2033
- Table 21: France Lightweight All Terrain Utility Vehicles Revenue (billion) Forecast, by Application 2020 & 2033
- Table 22: Italy Lightweight All Terrain Utility Vehicles Revenue (billion) Forecast, by Application 2020 & 2033
- Table 23: Spain Lightweight All Terrain Utility Vehicles Revenue (billion) Forecast, by Application 2020 & 2033
- Table 24: Russia Lightweight All Terrain Utility Vehicles Revenue (billion) Forecast, by Application 2020 & 2033
- Table 25: Benelux Lightweight All Terrain Utility Vehicles Revenue (billion) Forecast, by Application 2020 & 2033
- Table 26: Nordics Lightweight All Terrain Utility Vehicles Revenue (billion) Forecast, by Application 2020 & 2033
- Table 27: Rest of Europe Lightweight All Terrain Utility Vehicles Revenue (billion) Forecast, by Application 2020 & 2033
- Table 28: Global Lightweight All Terrain Utility Vehicles Revenue billion Forecast, by Application 2020 & 2033
- Table 29: Global Lightweight All Terrain Utility Vehicles Revenue billion Forecast, by Types 2020 & 2033
- Table 30: Global Lightweight All Terrain Utility Vehicles Revenue billion Forecast, by Country 2020 & 2033
- Table 31: Turkey Lightweight All Terrain Utility Vehicles Revenue (billion) Forecast, by Application 2020 & 2033
- Table 32: Israel Lightweight All Terrain Utility Vehicles Revenue (billion) Forecast, by Application 2020 & 2033
- Table 33: GCC Lightweight All Terrain Utility Vehicles Revenue (billion) Forecast, by Application 2020 & 2033
- Table 34: North Africa Lightweight All Terrain Utility Vehicles Revenue (billion) Forecast, by Application 2020 & 2033
- Table 35: South Africa Lightweight All Terrain Utility Vehicles Revenue (billion) Forecast, by Application 2020 & 2033
- Table 36: Rest of Middle East & Africa Lightweight All Terrain Utility Vehicles Revenue (billion) Forecast, by Application 2020 & 2033
- Table 37: Global Lightweight All Terrain Utility Vehicles Revenue billion Forecast, by Application 2020 & 2033
- Table 38: Global Lightweight All Terrain Utility Vehicles Revenue billion Forecast, by Types 2020 & 2033
- Table 39: Global Lightweight All Terrain Utility Vehicles Revenue billion Forecast, by Country 2020 & 2033
- Table 40: China Lightweight All Terrain Utility Vehicles Revenue (billion) Forecast, by Application 2020 & 2033
- Table 41: India Lightweight All Terrain Utility Vehicles Revenue (billion) Forecast, by Application 2020 & 2033
- Table 42: Japan Lightweight All Terrain Utility Vehicles Revenue (billion) Forecast, by Application 2020 & 2033
- Table 43: South Korea Lightweight All Terrain Utility Vehicles Revenue (billion) Forecast, by Application 2020 & 2033
- Table 44: ASEAN Lightweight All Terrain Utility Vehicles Revenue (billion) Forecast, by Application 2020 & 2033
- Table 45: Oceania Lightweight All Terrain Utility Vehicles Revenue (billion) Forecast, by Application 2020 & 2033
- Table 46: Rest of Asia Pacific Lightweight All Terrain Utility Vehicles Revenue (billion) Forecast, by Application 2020 & 2033
Frequently Asked Questions
1. What is the projected Compound Annual Growth Rate (CAGR) of the Lightweight All Terrain Utility Vehicles?
The projected CAGR is approximately 5.7%.
2. Which companies are prominent players in the Lightweight All Terrain Utility Vehicles?
Key companies in the market include Arctic Cat, Can-Am, Polaris Industries, Yamaha, Cectek, CF Moto, HiSun Motors, Honda Motor, John Deere, Kawasaki Motors, KYMCO, Linhai, Suzuki Motor, Taiwan Golden Bee (TGB).
3. What are the main segments of the Lightweight All Terrain Utility Vehicles?
The market segments include Application, Types.
4. Can you provide details about the market size?
The market size is estimated to be USD 6.03 billion as of 2022.
5. What are some drivers contributing to market growth?
N/A
6. What are the notable trends driving market growth?
N/A
7. Are there any restraints impacting market growth?
N/A
8. Can you provide examples of recent developments in the market?
N/A
9. What pricing options are available for accessing the report?
Pricing options include single-user, multi-user, and enterprise licenses priced at USD 2900.00, USD 4350.00, and USD 5800.00 respectively.
10. Is the market size provided in terms of value or volume?
The market size is provided in terms of value, measured in billion.
11. Are there any specific market keywords associated with the report?
Yes, the market keyword associated with the report is "Lightweight All Terrain Utility Vehicles," which aids in identifying and referencing the specific market segment covered.
12. How do I determine which pricing option suits my needs best?
The pricing options vary based on user requirements and access needs. Individual users may opt for single-user licenses, while businesses requiring broader access may choose multi-user or enterprise licenses for cost-effective access to the report.
13. Are there any additional resources or data provided in the Lightweight All Terrain Utility Vehicles report?
While the report offers comprehensive insights, it's advisable to review the specific contents or supplementary materials provided to ascertain if additional resources or data are available.
14. How can I stay updated on further developments or reports in the Lightweight All Terrain Utility Vehicles?
To stay informed about further developments, trends, and reports in the Lightweight All Terrain Utility Vehicles, consider subscribing to industry newsletters, following relevant companies and organizations, or regularly checking reputable industry news sources and publications.
Methodology
Step 1 - Identification of Relevant Samples Size from Population Database


Step 2 - Approaches for Defining Global Market Size (Value, Volume* & Price*)

Note*: In applicable scenarios
Step 3 - Data Sources
Primary Research
- Web Analytics
- Survey Reports
- Research Institute
- Latest Research Reports
- Opinion Leaders
Secondary Research
- Annual Reports
- White Paper
- Latest Press Release
- Industry Association
- Paid Database
- Investor Presentations

Step 4 - Data Triangulation
Involves using different sources of information in order to increase the validity of a study
These sources are likely to be stakeholders in a program - participants, other researchers, program staff, other community members, and so on.
Then we put all data in single framework & apply various statistical tools to find out the dynamic on the market.
During the analysis stage, feedback from the stakeholder groups would be compared to determine areas of agreement as well as areas of divergence