
Key Insights
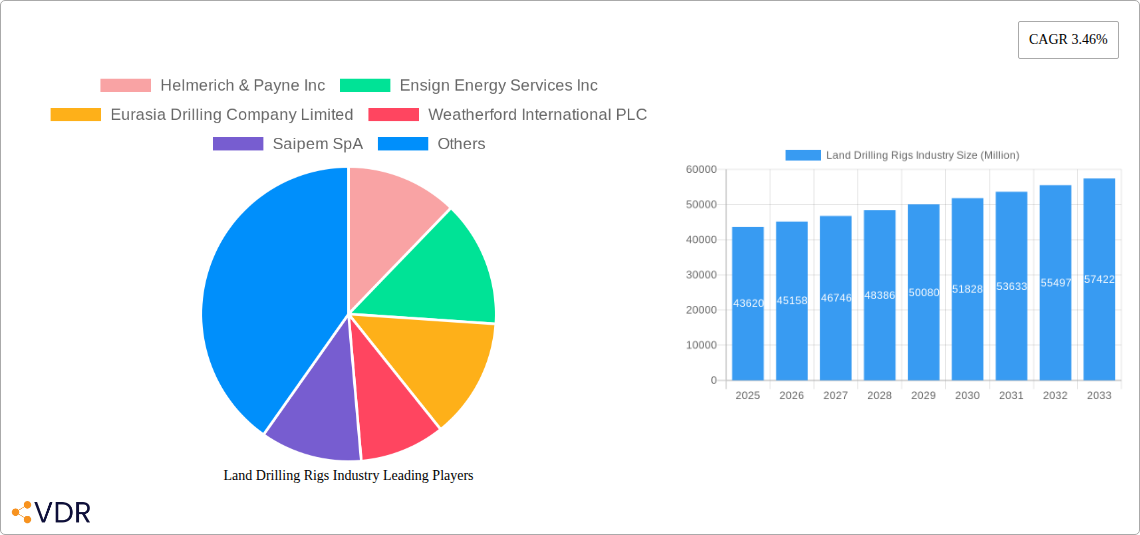
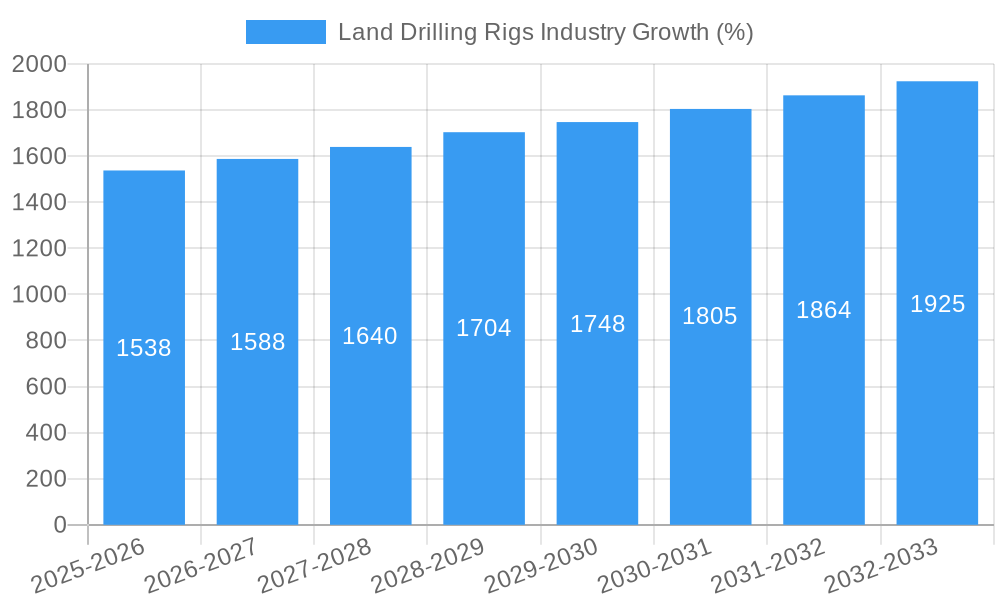
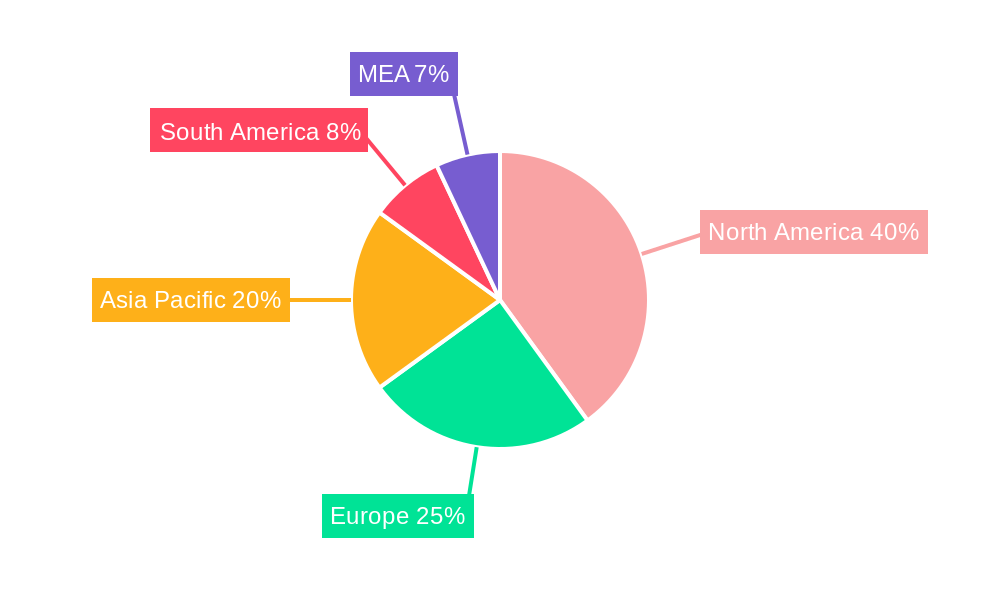
The global land drilling rigs market, valued at $43.62 billion in 2025, is projected to experience steady growth, driven by increasing oil and gas exploration and production activities worldwide. A Compound Annual Growth Rate (CAGR) of 3.46% from 2025 to 2033 indicates a substantial market expansion. Several factors contribute to this growth. Firstly, the rising global energy demand necessitates increased drilling operations to meet the growing consumption needs. Secondly, technological advancements in drilling technology, such as the adoption of automated and remote-controlled rigs, are enhancing efficiency and reducing operational costs, thereby boosting market expansion. Furthermore, exploration in unconventional reserves like shale gas and tight oil is creating new opportunities for land drilling rigs. However, fluctuations in oil and gas prices represent a significant restraint, impacting investment decisions and overall market growth. The market is segmented by rig type (conventional, mobile) and drive mode (mechanical, electrical, compound). Major players like Helmerich & Payne, Ensign Energy Services, and Schlumberger are shaping the market landscape through technological innovation and strategic acquisitions. The regional breakdown shows a strong presence in North America (particularly the US), followed by Asia Pacific (driven by China and India) and Europe. Emerging economies in the Middle East and Africa also offer significant growth potential, contributing to the overall market expansion.
The market’s growth trajectory hinges on several factors. Continued investment in upstream oil and gas exploration will be pivotal. Government regulations and environmental concerns regarding drilling activities, including emissions reduction targets, will influence the adoption of more environmentally friendly drilling technologies. Competition among major players will drive innovation, and the cost of equipment and labor will continue to affect market dynamics. The development and deployment of more efficient and sustainable drilling techniques will play a crucial role in determining the overall market size and growth rate during the forecast period. The balance between supply and demand, along with geopolitical stability in key oil-producing regions, will also influence the market's future trajectory.
Land Drilling Rigs Industry: A Comprehensive Market Report (2019-2033)
This comprehensive report provides an in-depth analysis of the global Land Drilling Rigs industry, encompassing market dynamics, growth trends, regional analysis, key players, and future outlook. With a study period spanning 2019-2033, a base year of 2025, and a forecast period of 2025-2033, this report is an invaluable resource for industry professionals, investors, and strategic decision-makers. The report covers the parent market of Oil and Gas Equipment and the child market of Land Drilling Rigs, offering granular insights into market segments such as Conventional and Mobile rigs, and Mechanical, Electrical, and Compound drive modes. The total market size is predicted to reach xx Million in 2025.
Land Drilling Rigs Industry Market Dynamics & Structure
The land drilling rigs market is characterized by moderate concentration, with key players holding significant market share. Technological innovation, driven by the need for enhanced efficiency and reduced environmental impact, is a key driver. Stringent regulatory frameworks concerning safety and environmental protection shape industry practices. The market faces competition from alternative drilling methods and evolving energy sources. End-user demographics are primarily driven by exploration and production (E&P) companies in the oil and gas sector, with a growing focus on shale gas and unconventional resources. M&A activity is moderate, with strategic acquisitions aimed at expanding geographical reach and technological capabilities.
- Market Concentration: Moderately concentrated, with top 10 players holding approximately xx% market share in 2025.
- Technological Innovation: Focus on automation, digitalization, and environmentally friendly technologies.
- Regulatory Landscape: Stringent safety and environmental regulations influence operational costs and technology adoption.
- Competitive Substitutes: Alternative drilling methods and renewable energy sources present competitive pressures.
- End-User Demographics: Primarily E&P companies, with increasing participation from independent operators.
- M&A Trends: Strategic acquisitions to expand geographical presence and technological portfolios, with an estimated xx M&A deals in the last five years.
Land Drilling Rigs Industry Growth Trends & Insights
The land drilling rigs market witnessed significant growth during the historical period (2019-2024), driven by rising oil and gas demand and exploration activities. The market size is expected to grow at a CAGR of xx% during the forecast period (2025-2033), reaching xx Million by 2033. Technological disruptions, such as the adoption of automation and digital technologies, are boosting efficiency and productivity. Consumer behavior shifts, reflecting a growing emphasis on sustainability and reduced environmental footprint, are influencing technology adoption and operational practices. Market penetration of advanced drilling technologies is gradually increasing, particularly in regions with favorable regulatory environments and robust exploration activities. The increasing adoption of electric and hybrid power rigs is a significant trend.
Dominant Regions, Countries, or Segments in Land Drilling Rigs Industry
North America and the Middle East are currently the dominant regions for land drilling rigs, driven by substantial oil and gas reserves and supportive government policies. Within these regions, specific countries like the US, Saudi Arabia, and the UAE are leading the market due to robust exploration activities and significant investments in the energy sector. Among segments, the conventional rig type dominates the market due to its adaptability and cost-effectiveness. However, mobile rigs are showing promising growth potential, especially in unconventional resource exploration. The demand for electrically driven rigs is increasing due to efficiency and environmental benefits.
- Key Drivers: Robust oil and gas exploration activities, favorable government policies, significant investments in energy infrastructure.
- Dominance Factors: Abundant resources, strong regulatory support, high exploration and production activities.
- Growth Potential: Expanding unconventional resource exploration, adoption of advanced drilling technologies, and government support for energy infrastructure projects will further drive growth in these regions.
Land Drilling Rigs Industry Product Landscape
Land drilling rigs are constantly evolving, with manufacturers introducing innovative features to enhance efficiency, safety, and environmental performance. Key advancements include improved automation, advanced drilling systems, enhanced data analytics capabilities, and hybrid power systems reducing reliance on fossil fuels. These innovations offer unique selling propositions such as increased uptime, reduced operational costs, and a smaller environmental footprint. The integration of advanced sensors and data analytics provides real-time insights for optimizing drilling operations.
Key Drivers, Barriers & Challenges in Land Drilling Rigs Industry
Key Drivers:
- Increasing global energy demand, particularly for oil and gas.
- Exploration and production activities in unconventional resources like shale gas.
- Technological advancements boosting efficiency and productivity.
- Favorable government policies and incentives supporting energy infrastructure development.
Challenges & Restraints:
- Fluctuations in oil and gas prices impacting investment decisions.
- Stringent environmental regulations increasing operational costs.
- Supply chain disruptions affecting the availability of critical components.
- Intense competition among major players impacting pricing and profitability. This is estimated to reduce the overall market growth by approximately xx% by 2030.
Emerging Opportunities in Land Drilling Rigs Industry
- Growing demand for environmentally friendly drilling technologies (e.g., hybrid power rigs).
- Expansion into emerging markets in Asia and Africa with significant exploration potential.
- Development of specialized drilling rigs for unconventional resources.
- Adoption of digitalization and automation for enhanced operational efficiency and data-driven decision making.
Growth Accelerators in the Land Drilling Rigs Industry
Technological innovation, including the development of automated, data-driven rigs and efficient power systems is a significant growth catalyst. Strategic partnerships between drilling rig manufacturers, service providers and E&P companies are fostering collaboration and driving technological advancements. Expansions into new geographical markets, particularly in regions with growing oil and gas reserves, offers significant growth opportunities.
Key Players Shaping the Land Drilling Rigs Industry Market
- Helmerich & Payne Inc
- Ensign Energy Services Inc
- Eurasia Drilling Company Limited
- Weatherford International PLC
- Saipem SpA
- KCA Deutag Group
- Schlumberger Limited
- Nabors Industries Ltd
- Patterson-UTI Energy Inc
- Precision Drilling Corp
Notable Milestones in Land Drilling Rigs Industry Sector
- March 2023: ONGC received ten indigenous rigs from MEIL for onshore exploration.
- March 2023: Adnoc Drilling purchased ten newbuild hybrid power land drilling rigs for USD 252 million.
- December 2022: KCA Deutag secured contract awards and extensions totaling over USD 85 million.
In-Depth Land Drilling Rigs Industry Market Outlook
The future of the land drilling rigs market is promising, driven by sustained demand for oil and gas, the development of advanced drilling technologies, and strategic partnerships fostering innovation. The market's growth trajectory is expected to remain positive, with significant opportunities for companies that embrace technological advancements, prioritize sustainability, and effectively navigate regulatory landscapes. The focus on efficiency, environmental responsibility, and technological innovation will shape the long-term growth trajectory of this crucial industry segment.
Land Drilling Rigs Industry Segmentation
-
1. Type
- 1.1. Conventional
- 1.2. Mobile
-
2. Drive Mode
- 2.1. Mechanical
- 2.2. Electrical
- 2.3. Compound
Land Drilling Rigs Industry Segmentation By Geography
-
1. North America
- 1.1. United States
- 1.2. Canada
- 1.3. Rest of the North America
-
2. Europe
- 2.1. United Kingdom
- 2.2. France
- 2.3. Italy
- 2.4. Germany
- 2.5. Rest of the Europe
-
3. Asia Pacific
- 3.1. China
- 3.2. India
- 3.3. South Korea
- 3.4. Rest of the Asia Pacific
-
4. South America
- 4.1. Brazil
- 4.2. Argentina
- 4.3. Rest of the South America
-
5. Middle East and Africa
- 5.1. United Arab Emirates
- 5.2. Saudi Arabia
- 5.3. Iran
- 5.4. Iraq
- 5.5. Qatar
- 5.6. Rest of the Middle East and Africa
Land Drilling Rigs Industry REPORT HIGHLIGHTS
| Aspects | Details |
|---|---|
| Study Period | 2019-2033 |
| Base Year | 2024 |
| Estimated Year | 2025 |
| Forecast Period | 2025-2033 |
| Historical Period | 2019-2024 |
| Growth Rate | CAGR of 3.46% from 2019-2033 |
| Segmentation |
|
Table of Contents
- 1. Introduction
- 1.1. Research Scope
- 1.2. Market Segmentation
- 1.3. Research Methodology
- 1.4. Definitions and Assumptions
- 2. Executive Summary
- 2.1. Introduction
- 3. Market Dynamics
- 3.1. Introduction
- 3.2. Market Drivers
- 3.2.1. 4.; Increasing Use of High Horsepower and Hi-Tech Rigs4.; Exploiting Unconventional Reserves
- 3.3. Market Restrains
- 3.3.1. 4.; The Global Shift Towards Renewable Energy Sources
- 3.4. Market Trends
- 3.4.1. The Mobile Rig Segment to Dominate the Market
- 4. Market Factor Analysis
- 4.1. Porters Five Forces
- 4.2. Supply/Value Chain
- 4.3. PESTEL analysis
- 4.4. Market Entropy
- 4.5. Patent/Trademark Analysis
- 5. Global Land Drilling Rigs Industry Analysis, Insights and Forecast, 2019-2031
- 5.1. Market Analysis, Insights and Forecast - by Type
- 5.1.1. Conventional
- 5.1.2. Mobile
- 5.2. Market Analysis, Insights and Forecast - by Drive Mode
- 5.2.1. Mechanical
- 5.2.2. Electrical
- 5.2.3. Compound
- 5.3. Market Analysis, Insights and Forecast - by Region
- 5.3.1. North America
- 5.3.2. Europe
- 5.3.3. Asia Pacific
- 5.3.4. South America
- 5.3.5. Middle East and Africa
- 5.1. Market Analysis, Insights and Forecast - by Type
- 6. North America Land Drilling Rigs Industry Analysis, Insights and Forecast, 2019-2031
- 6.1. Market Analysis, Insights and Forecast - by Type
- 6.1.1. Conventional
- 6.1.2. Mobile
- 6.2. Market Analysis, Insights and Forecast - by Drive Mode
- 6.2.1. Mechanical
- 6.2.2. Electrical
- 6.2.3. Compound
- 6.1. Market Analysis, Insights and Forecast - by Type
- 7. Europe Land Drilling Rigs Industry Analysis, Insights and Forecast, 2019-2031
- 7.1. Market Analysis, Insights and Forecast - by Type
- 7.1.1. Conventional
- 7.1.2. Mobile
- 7.2. Market Analysis, Insights and Forecast - by Drive Mode
- 7.2.1. Mechanical
- 7.2.2. Electrical
- 7.2.3. Compound
- 7.1. Market Analysis, Insights and Forecast - by Type
- 8. Asia Pacific Land Drilling Rigs Industry Analysis, Insights and Forecast, 2019-2031
- 8.1. Market Analysis, Insights and Forecast - by Type
- 8.1.1. Conventional
- 8.1.2. Mobile
- 8.2. Market Analysis, Insights and Forecast - by Drive Mode
- 8.2.1. Mechanical
- 8.2.2. Electrical
- 8.2.3. Compound
- 8.1. Market Analysis, Insights and Forecast - by Type
- 9. South America Land Drilling Rigs Industry Analysis, Insights and Forecast, 2019-2031
- 9.1. Market Analysis, Insights and Forecast - by Type
- 9.1.1. Conventional
- 9.1.2. Mobile
- 9.2. Market Analysis, Insights and Forecast - by Drive Mode
- 9.2.1. Mechanical
- 9.2.2. Electrical
- 9.2.3. Compound
- 9.1. Market Analysis, Insights and Forecast - by Type
- 10. Middle East and Africa Land Drilling Rigs Industry Analysis, Insights and Forecast, 2019-2031
- 10.1. Market Analysis, Insights and Forecast - by Type
- 10.1.1. Conventional
- 10.1.2. Mobile
- 10.2. Market Analysis, Insights and Forecast - by Drive Mode
- 10.2.1. Mechanical
- 10.2.2. Electrical
- 10.2.3. Compound
- 10.1. Market Analysis, Insights and Forecast - by Type
- 11. North America Land Drilling Rigs Industry Analysis, Insights and Forecast, 2019-2031
- 11.1. Market Analysis, Insights and Forecast - By Country/Sub-region
- 11.1.1 United States
- 11.1.2 Canada
- 11.1.3 Mexico
- 12. Europe Land Drilling Rigs Industry Analysis, Insights and Forecast, 2019-2031
- 12.1. Market Analysis, Insights and Forecast - By Country/Sub-region
- 12.1.1 Germany
- 12.1.2 United Kingdom
- 12.1.3 France
- 12.1.4 Spain
- 12.1.5 Italy
- 12.1.6 Spain
- 12.1.7 Belgium
- 12.1.8 Netherland
- 12.1.9 Nordics
- 12.1.10 Rest of Europe
- 13. Asia Pacific Land Drilling Rigs Industry Analysis, Insights and Forecast, 2019-2031
- 13.1. Market Analysis, Insights and Forecast - By Country/Sub-region
- 13.1.1 China
- 13.1.2 Japan
- 13.1.3 India
- 13.1.4 South Korea
- 13.1.5 Southeast Asia
- 13.1.6 Australia
- 13.1.7 Indonesia
- 13.1.8 Phillipes
- 13.1.9 Singapore
- 13.1.10 Thailandc
- 13.1.11 Rest of Asia Pacific
- 14. South America Land Drilling Rigs Industry Analysis, Insights and Forecast, 2019-2031
- 14.1. Market Analysis, Insights and Forecast - By Country/Sub-region
- 14.1.1 Brazil
- 14.1.2 Argentina
- 14.1.3 Peru
- 14.1.4 Chile
- 14.1.5 Colombia
- 14.1.6 Ecuador
- 14.1.7 Venezuela
- 14.1.8 Rest of South America
- 15. MEA Land Drilling Rigs Industry Analysis, Insights and Forecast, 2019-2031
- 15.1. Market Analysis, Insights and Forecast - By Country/Sub-region
- 15.1.1 United Arab Emirates
- 15.1.2 Saudi Arabia
- 15.1.3 South Africa
- 15.1.4 Rest of Middle East and Africa
- 16. Competitive Analysis
- 16.1. Global Market Share Analysis 2024
- 16.2. Company Profiles
- 16.2.1 Helmerich & Payne Inc
- 16.2.1.1. Overview
- 16.2.1.2. Products
- 16.2.1.3. SWOT Analysis
- 16.2.1.4. Recent Developments
- 16.2.1.5. Financials (Based on Availability)
- 16.2.2 Ensign Energy Services Inc
- 16.2.2.1. Overview
- 16.2.2.2. Products
- 16.2.2.3. SWOT Analysis
- 16.2.2.4. Recent Developments
- 16.2.2.5. Financials (Based on Availability)
- 16.2.3 Eurasia Drilling Company Limited
- 16.2.3.1. Overview
- 16.2.3.2. Products
- 16.2.3.3. SWOT Analysis
- 16.2.3.4. Recent Developments
- 16.2.3.5. Financials (Based on Availability)
- 16.2.4 Weatherford International PLC
- 16.2.4.1. Overview
- 16.2.4.2. Products
- 16.2.4.3. SWOT Analysis
- 16.2.4.4. Recent Developments
- 16.2.4.5. Financials (Based on Availability)
- 16.2.5 Saipem SpA
- 16.2.5.1. Overview
- 16.2.5.2. Products
- 16.2.5.3. SWOT Analysis
- 16.2.5.4. Recent Developments
- 16.2.5.5. Financials (Based on Availability)
- 16.2.6 KCA Deutag Group
- 16.2.6.1. Overview
- 16.2.6.2. Products
- 16.2.6.3. SWOT Analysis
- 16.2.6.4. Recent Developments
- 16.2.6.5. Financials (Based on Availability)
- 16.2.7 Schlumberger Limited
- 16.2.7.1. Overview
- 16.2.7.2. Products
- 16.2.7.3. SWOT Analysis
- 16.2.7.4. Recent Developments
- 16.2.7.5. Financials (Based on Availability)
- 16.2.8 Nabors Industries Ltd
- 16.2.8.1. Overview
- 16.2.8.2. Products
- 16.2.8.3. SWOT Analysis
- 16.2.8.4. Recent Developments
- 16.2.8.5. Financials (Based on Availability)
- 16.2.9 Patterson-UTI Energy Inc
- 16.2.9.1. Overview
- 16.2.9.2. Products
- 16.2.9.3. SWOT Analysis
- 16.2.9.4. Recent Developments
- 16.2.9.5. Financials (Based on Availability)
- 16.2.10 Precision Drilling Corp
- 16.2.10.1. Overview
- 16.2.10.2. Products
- 16.2.10.3. SWOT Analysis
- 16.2.10.4. Recent Developments
- 16.2.10.5. Financials (Based on Availability)
- 16.2.1 Helmerich & Payne Inc
List of Figures
- Figure 1: Global Land Drilling Rigs Industry Revenue Breakdown (Million, %) by Region 2024 & 2032
- Figure 2: North America Land Drilling Rigs Industry Revenue (Million), by Country 2024 & 2032
- Figure 3: North America Land Drilling Rigs Industry Revenue Share (%), by Country 2024 & 2032
- Figure 4: Europe Land Drilling Rigs Industry Revenue (Million), by Country 2024 & 2032
- Figure 5: Europe Land Drilling Rigs Industry Revenue Share (%), by Country 2024 & 2032
- Figure 6: Asia Pacific Land Drilling Rigs Industry Revenue (Million), by Country 2024 & 2032
- Figure 7: Asia Pacific Land Drilling Rigs Industry Revenue Share (%), by Country 2024 & 2032
- Figure 8: South America Land Drilling Rigs Industry Revenue (Million), by Country 2024 & 2032
- Figure 9: South America Land Drilling Rigs Industry Revenue Share (%), by Country 2024 & 2032
- Figure 10: MEA Land Drilling Rigs Industry Revenue (Million), by Country 2024 & 2032
- Figure 11: MEA Land Drilling Rigs Industry Revenue Share (%), by Country 2024 & 2032
- Figure 12: North America Land Drilling Rigs Industry Revenue (Million), by Type 2024 & 2032
- Figure 13: North America Land Drilling Rigs Industry Revenue Share (%), by Type 2024 & 2032
- Figure 14: North America Land Drilling Rigs Industry Revenue (Million), by Drive Mode 2024 & 2032
- Figure 15: North America Land Drilling Rigs Industry Revenue Share (%), by Drive Mode 2024 & 2032
- Figure 16: North America Land Drilling Rigs Industry Revenue (Million), by Country 2024 & 2032
- Figure 17: North America Land Drilling Rigs Industry Revenue Share (%), by Country 2024 & 2032
- Figure 18: Europe Land Drilling Rigs Industry Revenue (Million), by Type 2024 & 2032
- Figure 19: Europe Land Drilling Rigs Industry Revenue Share (%), by Type 2024 & 2032
- Figure 20: Europe Land Drilling Rigs Industry Revenue (Million), by Drive Mode 2024 & 2032
- Figure 21: Europe Land Drilling Rigs Industry Revenue Share (%), by Drive Mode 2024 & 2032
- Figure 22: Europe Land Drilling Rigs Industry Revenue (Million), by Country 2024 & 2032
- Figure 23: Europe Land Drilling Rigs Industry Revenue Share (%), by Country 2024 & 2032
- Figure 24: Asia Pacific Land Drilling Rigs Industry Revenue (Million), by Type 2024 & 2032
- Figure 25: Asia Pacific Land Drilling Rigs Industry Revenue Share (%), by Type 2024 & 2032
- Figure 26: Asia Pacific Land Drilling Rigs Industry Revenue (Million), by Drive Mode 2024 & 2032
- Figure 27: Asia Pacific Land Drilling Rigs Industry Revenue Share (%), by Drive Mode 2024 & 2032
- Figure 28: Asia Pacific Land Drilling Rigs Industry Revenue (Million), by Country 2024 & 2032
- Figure 29: Asia Pacific Land Drilling Rigs Industry Revenue Share (%), by Country 2024 & 2032
- Figure 30: South America Land Drilling Rigs Industry Revenue (Million), by Type 2024 & 2032
- Figure 31: South America Land Drilling Rigs Industry Revenue Share (%), by Type 2024 & 2032
- Figure 32: South America Land Drilling Rigs Industry Revenue (Million), by Drive Mode 2024 & 2032
- Figure 33: South America Land Drilling Rigs Industry Revenue Share (%), by Drive Mode 2024 & 2032
- Figure 34: South America Land Drilling Rigs Industry Revenue (Million), by Country 2024 & 2032
- Figure 35: South America Land Drilling Rigs Industry Revenue Share (%), by Country 2024 & 2032
- Figure 36: Middle East and Africa Land Drilling Rigs Industry Revenue (Million), by Type 2024 & 2032
- Figure 37: Middle East and Africa Land Drilling Rigs Industry Revenue Share (%), by Type 2024 & 2032
- Figure 38: Middle East and Africa Land Drilling Rigs Industry Revenue (Million), by Drive Mode 2024 & 2032
- Figure 39: Middle East and Africa Land Drilling Rigs Industry Revenue Share (%), by Drive Mode 2024 & 2032
- Figure 40: Middle East and Africa Land Drilling Rigs Industry Revenue (Million), by Country 2024 & 2032
- Figure 41: Middle East and Africa Land Drilling Rigs Industry Revenue Share (%), by Country 2024 & 2032
List of Tables
- Table 1: Global Land Drilling Rigs Industry Revenue Million Forecast, by Region 2019 & 2032
- Table 2: Global Land Drilling Rigs Industry Revenue Million Forecast, by Type 2019 & 2032
- Table 3: Global Land Drilling Rigs Industry Revenue Million Forecast, by Drive Mode 2019 & 2032
- Table 4: Global Land Drilling Rigs Industry Revenue Million Forecast, by Region 2019 & 2032
- Table 5: Global Land Drilling Rigs Industry Revenue Million Forecast, by Country 2019 & 2032
- Table 6: United States Land Drilling Rigs Industry Revenue (Million) Forecast, by Application 2019 & 2032
- Table 7: Canada Land Drilling Rigs Industry Revenue (Million) Forecast, by Application 2019 & 2032
- Table 8: Mexico Land Drilling Rigs Industry Revenue (Million) Forecast, by Application 2019 & 2032
- Table 9: Global Land Drilling Rigs Industry Revenue Million Forecast, by Country 2019 & 2032
- Table 10: Germany Land Drilling Rigs Industry Revenue (Million) Forecast, by Application 2019 & 2032
- Table 11: United Kingdom Land Drilling Rigs Industry Revenue (Million) Forecast, by Application 2019 & 2032
- Table 12: France Land Drilling Rigs Industry Revenue (Million) Forecast, by Application 2019 & 2032
- Table 13: Spain Land Drilling Rigs Industry Revenue (Million) Forecast, by Application 2019 & 2032
- Table 14: Italy Land Drilling Rigs Industry Revenue (Million) Forecast, by Application 2019 & 2032
- Table 15: Spain Land Drilling Rigs Industry Revenue (Million) Forecast, by Application 2019 & 2032
- Table 16: Belgium Land Drilling Rigs Industry Revenue (Million) Forecast, by Application 2019 & 2032
- Table 17: Netherland Land Drilling Rigs Industry Revenue (Million) Forecast, by Application 2019 & 2032
- Table 18: Nordics Land Drilling Rigs Industry Revenue (Million) Forecast, by Application 2019 & 2032
- Table 19: Rest of Europe Land Drilling Rigs Industry Revenue (Million) Forecast, by Application 2019 & 2032
- Table 20: Global Land Drilling Rigs Industry Revenue Million Forecast, by Country 2019 & 2032
- Table 21: China Land Drilling Rigs Industry Revenue (Million) Forecast, by Application 2019 & 2032
- Table 22: Japan Land Drilling Rigs Industry Revenue (Million) Forecast, by Application 2019 & 2032
- Table 23: India Land Drilling Rigs Industry Revenue (Million) Forecast, by Application 2019 & 2032
- Table 24: South Korea Land Drilling Rigs Industry Revenue (Million) Forecast, by Application 2019 & 2032
- Table 25: Southeast Asia Land Drilling Rigs Industry Revenue (Million) Forecast, by Application 2019 & 2032
- Table 26: Australia Land Drilling Rigs Industry Revenue (Million) Forecast, by Application 2019 & 2032
- Table 27: Indonesia Land Drilling Rigs Industry Revenue (Million) Forecast, by Application 2019 & 2032
- Table 28: Phillipes Land Drilling Rigs Industry Revenue (Million) Forecast, by Application 2019 & 2032
- Table 29: Singapore Land Drilling Rigs Industry Revenue (Million) Forecast, by Application 2019 & 2032
- Table 30: Thailandc Land Drilling Rigs Industry Revenue (Million) Forecast, by Application 2019 & 2032
- Table 31: Rest of Asia Pacific Land Drilling Rigs Industry Revenue (Million) Forecast, by Application 2019 & 2032
- Table 32: Global Land Drilling Rigs Industry Revenue Million Forecast, by Country 2019 & 2032
- Table 33: Brazil Land Drilling Rigs Industry Revenue (Million) Forecast, by Application 2019 & 2032
- Table 34: Argentina Land Drilling Rigs Industry Revenue (Million) Forecast, by Application 2019 & 2032
- Table 35: Peru Land Drilling Rigs Industry Revenue (Million) Forecast, by Application 2019 & 2032
- Table 36: Chile Land Drilling Rigs Industry Revenue (Million) Forecast, by Application 2019 & 2032
- Table 37: Colombia Land Drilling Rigs Industry Revenue (Million) Forecast, by Application 2019 & 2032
- Table 38: Ecuador Land Drilling Rigs Industry Revenue (Million) Forecast, by Application 2019 & 2032
- Table 39: Venezuela Land Drilling Rigs Industry Revenue (Million) Forecast, by Application 2019 & 2032
- Table 40: Rest of South America Land Drilling Rigs Industry Revenue (Million) Forecast, by Application 2019 & 2032
- Table 41: Global Land Drilling Rigs Industry Revenue Million Forecast, by Country 2019 & 2032
- Table 42: United Arab Emirates Land Drilling Rigs Industry Revenue (Million) Forecast, by Application 2019 & 2032
- Table 43: Saudi Arabia Land Drilling Rigs Industry Revenue (Million) Forecast, by Application 2019 & 2032
- Table 44: South Africa Land Drilling Rigs Industry Revenue (Million) Forecast, by Application 2019 & 2032
- Table 45: Rest of Middle East and Africa Land Drilling Rigs Industry Revenue (Million) Forecast, by Application 2019 & 2032
- Table 46: Global Land Drilling Rigs Industry Revenue Million Forecast, by Type 2019 & 2032
- Table 47: Global Land Drilling Rigs Industry Revenue Million Forecast, by Drive Mode 2019 & 2032
- Table 48: Global Land Drilling Rigs Industry Revenue Million Forecast, by Country 2019 & 2032
- Table 49: United States Land Drilling Rigs Industry Revenue (Million) Forecast, by Application 2019 & 2032
- Table 50: Canada Land Drilling Rigs Industry Revenue (Million) Forecast, by Application 2019 & 2032
- Table 51: Rest of the North America Land Drilling Rigs Industry Revenue (Million) Forecast, by Application 2019 & 2032
- Table 52: Global Land Drilling Rigs Industry Revenue Million Forecast, by Type 2019 & 2032
- Table 53: Global Land Drilling Rigs Industry Revenue Million Forecast, by Drive Mode 2019 & 2032
- Table 54: Global Land Drilling Rigs Industry Revenue Million Forecast, by Country 2019 & 2032
- Table 55: United Kingdom Land Drilling Rigs Industry Revenue (Million) Forecast, by Application 2019 & 2032
- Table 56: France Land Drilling Rigs Industry Revenue (Million) Forecast, by Application 2019 & 2032
- Table 57: Italy Land Drilling Rigs Industry Revenue (Million) Forecast, by Application 2019 & 2032
- Table 58: Germany Land Drilling Rigs Industry Revenue (Million) Forecast, by Application 2019 & 2032
- Table 59: Rest of the Europe Land Drilling Rigs Industry Revenue (Million) Forecast, by Application 2019 & 2032
- Table 60: Global Land Drilling Rigs Industry Revenue Million Forecast, by Type 2019 & 2032
- Table 61: Global Land Drilling Rigs Industry Revenue Million Forecast, by Drive Mode 2019 & 2032
- Table 62: Global Land Drilling Rigs Industry Revenue Million Forecast, by Country 2019 & 2032
- Table 63: China Land Drilling Rigs Industry Revenue (Million) Forecast, by Application 2019 & 2032
- Table 64: India Land Drilling Rigs Industry Revenue (Million) Forecast, by Application 2019 & 2032
- Table 65: South Korea Land Drilling Rigs Industry Revenue (Million) Forecast, by Application 2019 & 2032
- Table 66: Rest of the Asia Pacific Land Drilling Rigs Industry Revenue (Million) Forecast, by Application 2019 & 2032
- Table 67: Global Land Drilling Rigs Industry Revenue Million Forecast, by Type 2019 & 2032
- Table 68: Global Land Drilling Rigs Industry Revenue Million Forecast, by Drive Mode 2019 & 2032
- Table 69: Global Land Drilling Rigs Industry Revenue Million Forecast, by Country 2019 & 2032
- Table 70: Brazil Land Drilling Rigs Industry Revenue (Million) Forecast, by Application 2019 & 2032
- Table 71: Argentina Land Drilling Rigs Industry Revenue (Million) Forecast, by Application 2019 & 2032
- Table 72: Rest of the South America Land Drilling Rigs Industry Revenue (Million) Forecast, by Application 2019 & 2032
- Table 73: Global Land Drilling Rigs Industry Revenue Million Forecast, by Type 2019 & 2032
- Table 74: Global Land Drilling Rigs Industry Revenue Million Forecast, by Drive Mode 2019 & 2032
- Table 75: Global Land Drilling Rigs Industry Revenue Million Forecast, by Country 2019 & 2032
- Table 76: United Arab Emirates Land Drilling Rigs Industry Revenue (Million) Forecast, by Application 2019 & 2032
- Table 77: Saudi Arabia Land Drilling Rigs Industry Revenue (Million) Forecast, by Application 2019 & 2032
- Table 78: Iran Land Drilling Rigs Industry Revenue (Million) Forecast, by Application 2019 & 2032
- Table 79: Iraq Land Drilling Rigs Industry Revenue (Million) Forecast, by Application 2019 & 2032
- Table 80: Qatar Land Drilling Rigs Industry Revenue (Million) Forecast, by Application 2019 & 2032
- Table 81: Rest of the Middle East and Africa Land Drilling Rigs Industry Revenue (Million) Forecast, by Application 2019 & 2032
Frequently Asked Questions
1. What is the projected Compound Annual Growth Rate (CAGR) of the Land Drilling Rigs Industry?
The projected CAGR is approximately 3.46%.
2. Which companies are prominent players in the Land Drilling Rigs Industry?
Key companies in the market include Helmerich & Payne Inc, Ensign Energy Services Inc, Eurasia Drilling Company Limited, Weatherford International PLC, Saipem SpA, KCA Deutag Group, Schlumberger Limited, Nabors Industries Ltd, Patterson-UTI Energy Inc, Precision Drilling Corp.
3. What are the main segments of the Land Drilling Rigs Industry?
The market segments include Type, Drive Mode.
4. Can you provide details about the market size?
The market size is estimated to be USD 43.62 Million as of 2022.
5. What are some drivers contributing to market growth?
4.; Increasing Use of High Horsepower and Hi-Tech Rigs4.; Exploiting Unconventional Reserves.
6. What are the notable trends driving market growth?
The Mobile Rig Segment to Dominate the Market.
7. Are there any restraints impacting market growth?
4.; The Global Shift Towards Renewable Energy Sources.
8. Can you provide examples of recent developments in the market?
March 2023: The Oil and Natural Gas Corporation (ONGC) received ten indigenous rigs from Megha Engineering and Infrastructure Limited (MEIL) to explore oil and natural gas in its onshore fields in the Krishna-Godavari basin.
9. What pricing options are available for accessing the report?
Pricing options include single-user, multi-user, and enterprise licenses priced at USD 4750, USD 5250, and USD 8750 respectively.
10. Is the market size provided in terms of value or volume?
The market size is provided in terms of value, measured in Million.
11. Are there any specific market keywords associated with the report?
Yes, the market keyword associated with the report is "Land Drilling Rigs Industry," which aids in identifying and referencing the specific market segment covered.
12. How do I determine which pricing option suits my needs best?
The pricing options vary based on user requirements and access needs. Individual users may opt for single-user licenses, while businesses requiring broader access may choose multi-user or enterprise licenses for cost-effective access to the report.
13. Are there any additional resources or data provided in the Land Drilling Rigs Industry report?
While the report offers comprehensive insights, it's advisable to review the specific contents or supplementary materials provided to ascertain if additional resources or data are available.
14. How can I stay updated on further developments or reports in the Land Drilling Rigs Industry?
To stay informed about further developments, trends, and reports in the Land Drilling Rigs Industry, consider subscribing to industry newsletters, following relevant companies and organizations, or regularly checking reputable industry news sources and publications.
Methodology
Step 1 - Identification of Relevant Samples Size from Population Database


Step 2 - Approaches for Defining Global Market Size (Value, Volume* & Price*)

Note*: In applicable scenarios
Step 3 - Data Sources
Primary Research
- Web Analytics
- Survey Reports
- Research Institute
- Latest Research Reports
- Opinion Leaders
Secondary Research
- Annual Reports
- White Paper
- Latest Press Release
- Industry Association
- Paid Database
- Investor Presentations

Step 4 - Data Triangulation
Involves using different sources of information in order to increase the validity of a study
These sources are likely to be stakeholders in a program - participants, other researchers, program staff, other community members, and so on.
Then we put all data in single framework & apply various statistical tools to find out the dynamic on the market.
During the analysis stage, feedback from the stakeholder groups would be compared to determine areas of agreement as well as areas of divergence


