

Key Insights
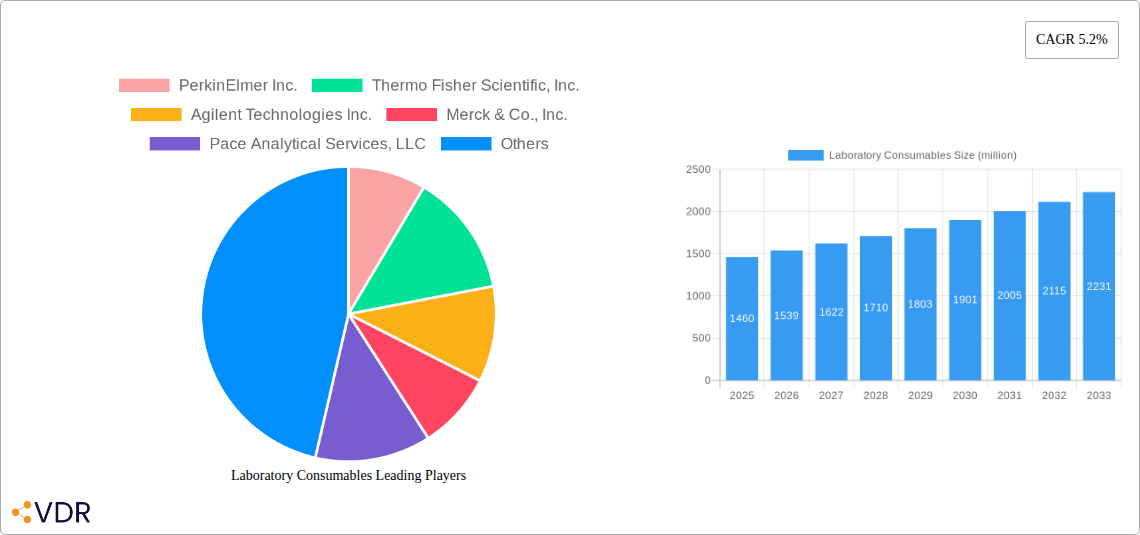
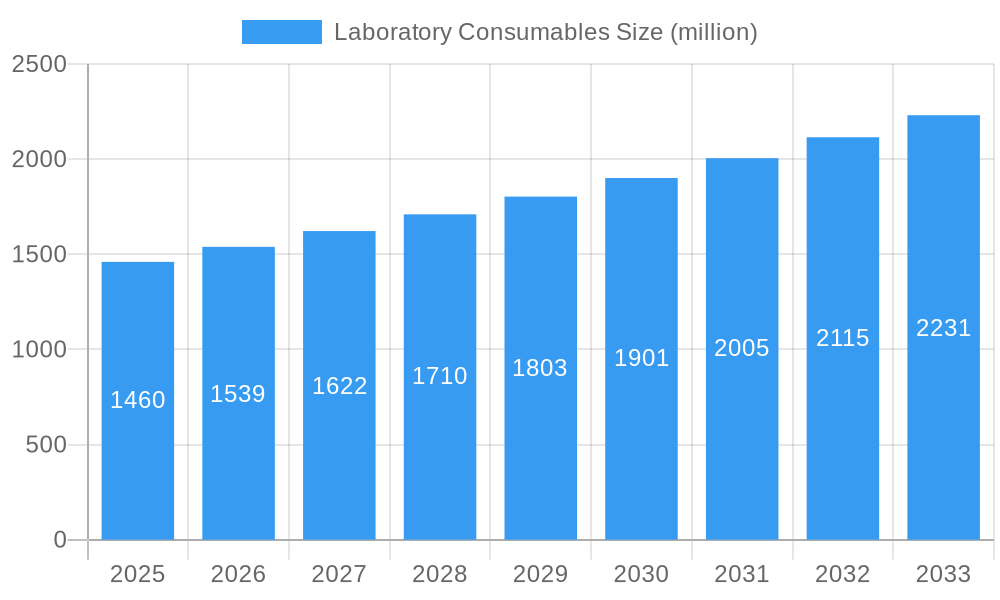
The laboratory consumables market, valued at $1460 million in 2025, is projected to experience robust growth, driven by a Compound Annual Growth Rate (CAGR) of 5.2% from 2025 to 2033. This expansion is fueled by several key factors. The increasing prevalence of chronic diseases globally necessitates more advanced diagnostic testing and research, significantly boosting demand for consumables like pipettes, tubes, microplates, and gloves. Furthermore, the burgeoning biotechnology and pharmaceutical industries, coupled with rising investments in research and development, are major contributors to market growth. Technological advancements leading to the development of higher-quality, more efficient consumables further enhance market appeal. However, factors such as stringent regulatory approvals and price fluctuations in raw materials pose challenges to sustained growth. Competitive landscape analysis reveals a diverse range of players, including established multinational corporations like Thermo Fisher Scientific and PerkinElmer, alongside smaller specialized companies catering to niche segments. This competitive dynamic drives innovation and ensures a wide array of choices for end-users. The market is segmented based on product type (e.g., glassware, plastics, filtration products), application (e.g., clinical diagnostics, life sciences research), and end-user (e.g., hospitals, research institutions, pharmaceutical companies). Future growth will likely be influenced by advancements in automation and the adoption of single-use consumables to enhance efficiency and reduce contamination risks. Geographic expansion into emerging markets with increasing healthcare infrastructure will also contribute to market expansion.
Laboratory Consumables Market Size (In Billion)
The market's trajectory suggests significant opportunities for both established and emerging players. Strategic partnerships, product diversification, and technological innovation will be crucial for sustained success. Companies are focusing on developing eco-friendly and sustainable consumables, aligning with growing environmental concerns. The integration of advanced technologies such as AI and automation in laboratory workflows is expected to create further demand for compatible consumables, shaping future market dynamics. Continuous monitoring of regulatory landscapes and adapting to changing consumer preferences will be essential for companies to maintain a competitive edge in this dynamic market. The robust forecast for the next decade indicates a promising future for the laboratory consumables market, with substantial growth potential across various segments and geographical regions.
Laboratory Consumables Company Market Share
Laboratory Consumables Market Report: 2019-2033
This comprehensive report provides an in-depth analysis of the Laboratory Consumables market, encompassing market dynamics, growth trends, regional analysis, product landscape, key players, and future outlook. The study period covers 2019-2033, with 2025 as the base and estimated year. The forecast period spans 2025-2033, and the historical period is 2019-2024. The report analyzes the parent market of laboratory equipment and the child market of consumables used within various laboratory settings. Market size is presented in million units.
Laboratory Consumables Market Dynamics & Structure
The laboratory consumables market is characterized by a moderately concentrated landscape, with key players like Thermo Fisher Scientific, Danaher, and Agilent Technologies holding significant market share (estimated at xx% combined in 2025). Technological innovation, particularly in automation and disposables, is a key driver, alongside stringent regulatory frameworks (e.g., ISO, GLP) impacting product development and adoption. The market witnesses significant competition from substitute products (e.g., reusable glassware vs. disposable plastics) influencing pricing and demand. End-user demographics are diverse, encompassing research institutions, hospitals, pharmaceutical companies, and industrial labs, with varying demand patterns and preferences. M&A activity has been moderate (xx deals in the last 5 years), primarily focused on expanding product portfolios and geographical reach.
- Market Concentration: Moderately concentrated, with top 5 players holding xx% market share in 2025.
- Technological Drivers: Automation, disposables, and miniaturization are key innovation areas.
- Regulatory Landscape: Stringent standards (ISO, GLP) influence product quality and safety.
- Competitive Substitutes: Reusable vs. disposable options significantly impact market dynamics.
- End-User Demographics: Diverse, including research, healthcare, pharmaceutical, and industrial labs.
- M&A Activity: Moderate activity (xx deals in the last 5 years), focused on portfolio expansion.
Laboratory Consumables Growth Trends & Insights
The laboratory consumables market experienced robust growth during the historical period (2019-2024), driven by increasing R&D spending, advancements in life sciences, and rising diagnostic testing. The market size reached xx million units in 2024, exhibiting a CAGR of xx% (2019-2024). This growth is projected to continue, with a forecasted CAGR of xx% from 2025-2033, reaching an estimated xx million units by 2033. Technological disruptions, such as the adoption of microfluidics and advanced materials, are shaping market trends. Changing consumer behavior, including a preference for convenient, pre-sterilized disposables, further accelerates market expansion.
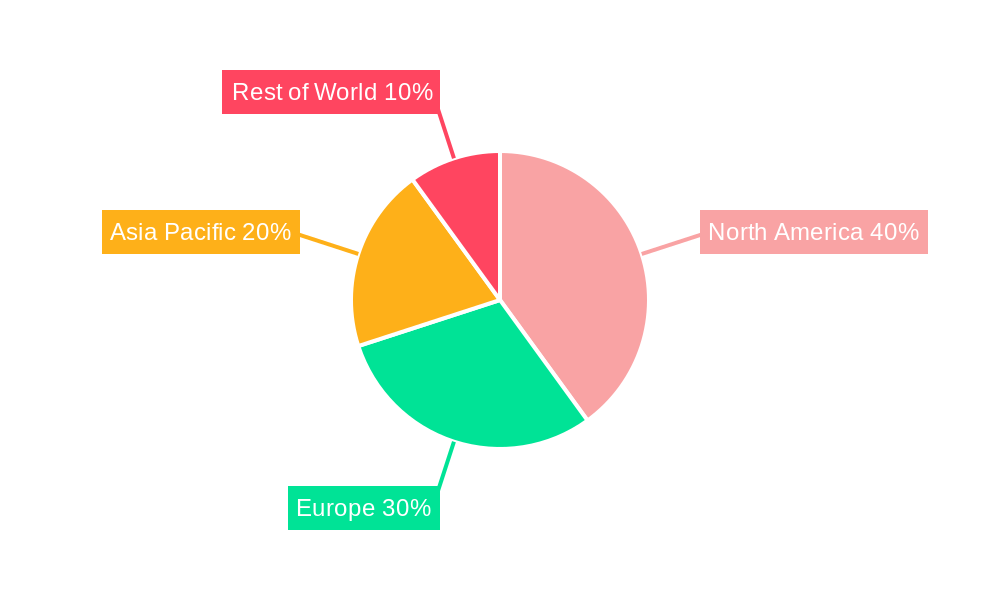
Dominant Regions, Countries, or Segments in Laboratory Consumables
North America currently dominates the laboratory consumables market, holding the largest market share (xx% in 2025) due to robust R&D investments, a strong pharmaceutical industry, and advanced healthcare infrastructure. Europe follows as a significant market, driven by a large scientific research community and increasing healthcare expenditure. Asia-Pacific is witnessing the fastest growth rate, fueled by expanding economies, rising healthcare awareness, and increasing government initiatives promoting research and development.
- North America: Strong R&D, advanced healthcare, and robust pharmaceutical sectors drive dominance.
- Europe: Large research base and high healthcare spending contribute to significant market share.
- Asia-Pacific: Rapid economic growth and rising healthcare investment fuel the fastest growth.
Laboratory Consumables Product Landscape
The market offers a wide range of consumables, including glassware, plasticware, filtration products, reagents, and media. Recent innovations focus on improved material properties (e.g., enhanced chemical resistance, reduced leaching), automation compatibility, and eco-friendly designs (e.g., reduced plastic usage). These advancements aim to enhance experimental accuracy, streamline workflows, and improve sustainability. Unique selling propositions include specialized functionalities (e.g., specific surface treatments for cell culture), improved ease of use, and superior performance characteristics.
Key Drivers, Barriers & Challenges in Laboratory Consumables
Key Drivers:
- Rising R&D spending across various sectors.
- Advancements in life sciences and diagnostics driving demand.
- Growing adoption of automation and high-throughput technologies.
- Increasing prevalence of chronic diseases boosting diagnostic testing.
Key Challenges:
- Supply chain disruptions impacting raw material availability and pricing.
- Stringent regulatory approvals creating delays in product launches (estimated xx% of new product introductions face significant delays).
- Intense competition leading to price pressures and reduced margins (estimated average margin decrease of xx% in the last 5 years).
Emerging Opportunities in Laboratory Consumables
- Untapped markets in developing economies present significant growth potential.
- Growing demand for personalized medicine and point-of-care diagnostics fuels innovation.
- Eco-friendly and sustainable consumables are gaining traction, offering new market segments.
Growth Accelerators in the Laboratory Consumables Industry
Technological breakthroughs in material science and automation are key growth catalysts. Strategic partnerships between consumables manufacturers and instrument providers are streamlining workflows and boosting demand. Expansion into emerging markets and diversification into specialized niches further propel market growth.
Key Players Shaping the Laboratory Consumables Market
- PerkinElmer Inc.
- Thermo Fisher Scientific, Inc.
- Agilent Technologies Inc.
- Merck & Co., Inc.
- Pace Analytical Services, LLC
- Shimadzu Corporation
- VWR International, LLC
- Waters Corporation
- Danaher
- Spectrum Chemical Manufacturing Corp.
- WK Life Sciences
- VITLAB GmbH
- Eppendorf AG
- Bellco Glass
- SKS Science Products
- Citotest Labware Manufacturing Co., Ltd.
- Camlab Ltd
- Medline Scientific Limited
- Crystalgen, Inc.
- Elkay Laboratory Products
Notable Milestones in Laboratory Consumables Sector
- 2020: Introduction of several automated liquid handling systems by major players.
- 2021: Increased focus on sustainable and eco-friendly consumables.
- 2022: Several mergers and acquisitions amongst smaller players consolidating the market.
- 2023: Launch of new, advanced filtration technologies.
- 2024: Significant investments in research and development for new material development.
In-Depth Laboratory Consumables Market Outlook
The laboratory consumables market is poised for continued strong growth, driven by technological advancements, expanding healthcare infrastructure, and increasing R&D activities globally. Strategic partnerships and market expansion into emerging regions will play a crucial role in shaping the future market landscape. Companies that prioritize innovation, sustainability, and customer service will be best positioned for long-term success in this dynamic market.
Laboratory Consumables Segmentation
-
1. Application
- 1.1. Academic Institutions
- 1.2. Clinical and Diagnostic Laboratories
- 1.3. Pharmaceutical and Biotechnology Companies
- 1.4. Others
-
2. Type
- 2.1. Disposable Consumables
- 2.2. Reusable Consumables
Laboratory Consumables Segmentation By Geography
-
1. North America
- 1.1. United States
- 1.2. Canada
- 1.3. Mexico
-
2. South America
- 2.1. Brazil
- 2.2. Argentina
- 2.3. Rest of South America
-
3. Europe
- 3.1. United Kingdom
- 3.2. Germany
- 3.3. France
- 3.4. Italy
- 3.5. Spain
- 3.6. Russia
- 3.7. Benelux
- 3.8. Nordics
- 3.9. Rest of Europe
-
4. Middle East & Africa
- 4.1. Turkey
- 4.2. Israel
- 4.3. GCC
- 4.4. North Africa
- 4.5. South Africa
- 4.6. Rest of Middle East & Africa
-
5. Asia Pacific
- 5.1. China
- 5.2. India
- 5.3. Japan
- 5.4. South Korea
- 5.5. ASEAN
- 5.6. Oceania
- 5.7. Rest of Asia Pacific
Laboratory Consumables Regional Market Share
Geographic Coverage of Laboratory Consumables
Laboratory Consumables REPORT HIGHLIGHTS
| Aspects | Details |
|---|---|
| Study Period | 2020-2034 |
| Base Year | 2025 |
| Estimated Year | 2026 |
| Forecast Period | 2026-2034 |
| Historical Period | 2020-2025 |
| Growth Rate | CAGR of 5.2% from 2020-2034 |
| Segmentation |
|
Table of Contents
- 1. Introduction
- 1.1. Research Scope
- 1.2. Market Segmentation
- 1.3. Research Objective
- 1.4. Definitions and Assumptions
- 2. Executive Summary
- 2.1. Market Snapshot
- 3. Market Dynamics
- 3.1. Market Drivers
- 3.2. Market Restrains
- 3.3. Market Trends
- 3.4. Market Opportunities
- 4. Market Factor Analysis
- 4.1. Porters Five Forces
- 4.1.1. Bargaining Power of Suppliers
- 4.1.2. Bargaining Power of Buyers
- 4.1.3. Threat of New Entrants
- 4.1.4. Threat of Substitutes
- 4.1.5. Competitive Rivalry
- 4.2. PESTEL analysis
- 4.3. BCG Analysis
- 4.3.1. Stars (High Growth, High Market Share)
- 4.3.2. Cash Cows (Low Growth, High Market Share)
- 4.3.3. Question Mark (High Growth, Low Market Share)
- 4.3.4. Dogs (Low Growth, Low Market Share)
- 4.4. Ansoff Matrix Analysis
- 4.5. Supply Chain Analysis
- 4.6. Regulatory Landscape
- 4.7. Current Market Potential and Opportunity Assessment (TAM–SAM–SOM Framework)
- 4.8. VDR Analyst Note
- 4.1. Porters Five Forces
- 5. Market Analysis, Insights and Forecast 2021-2033
- 5.1. Market Analysis, Insights and Forecast - by Application
- 5.1.1. Academic Institutions
- 5.1.2. Clinical and Diagnostic Laboratories
- 5.1.3. Pharmaceutical and Biotechnology Companies
- 5.1.4. Others
- 5.2. Market Analysis, Insights and Forecast - by Type
- 5.2.1. Disposable Consumables
- 5.2.2. Reusable Consumables
- 5.3. Market Analysis, Insights and Forecast - by Region
- 5.3.1. North America
- 5.3.2. South America
- 5.3.3. Europe
- 5.3.4. Middle East & Africa
- 5.3.5. Asia Pacific
- 5.1. Market Analysis, Insights and Forecast - by Application
- 6. Global Laboratory Consumables Analysis, Insights and Forecast, 2021-2033
- 6.1. Market Analysis, Insights and Forecast - by Application
- 6.1.1. Academic Institutions
- 6.1.2. Clinical and Diagnostic Laboratories
- 6.1.3. Pharmaceutical and Biotechnology Companies
- 6.1.4. Others
- 6.2. Market Analysis, Insights and Forecast - by Type
- 6.2.1. Disposable Consumables
- 6.2.2. Reusable Consumables
- 6.1. Market Analysis, Insights and Forecast - by Application
- 7. North America Laboratory Consumables Analysis, Insights and Forecast, 2021-2033
- 7.1. Market Analysis, Insights and Forecast - by Application
- 7.1.1. Academic Institutions
- 7.1.2. Clinical and Diagnostic Laboratories
- 7.1.3. Pharmaceutical and Biotechnology Companies
- 7.1.4. Others
- 7.2. Market Analysis, Insights and Forecast - by Type
- 7.2.1. Disposable Consumables
- 7.2.2. Reusable Consumables
- 7.1. Market Analysis, Insights and Forecast - by Application
- 8. South America Laboratory Consumables Analysis, Insights and Forecast, 2021-2033
- 8.1. Market Analysis, Insights and Forecast - by Application
- 8.1.1. Academic Institutions
- 8.1.2. Clinical and Diagnostic Laboratories
- 8.1.3. Pharmaceutical and Biotechnology Companies
- 8.1.4. Others
- 8.2. Market Analysis, Insights and Forecast - by Type
- 8.2.1. Disposable Consumables
- 8.2.2. Reusable Consumables
- 8.1. Market Analysis, Insights and Forecast - by Application
- 9. Europe Laboratory Consumables Analysis, Insights and Forecast, 2021-2033
- 9.1. Market Analysis, Insights and Forecast - by Application
- 9.1.1. Academic Institutions
- 9.1.2. Clinical and Diagnostic Laboratories
- 9.1.3. Pharmaceutical and Biotechnology Companies
- 9.1.4. Others
- 9.2. Market Analysis, Insights and Forecast - by Type
- 9.2.1. Disposable Consumables
- 9.2.2. Reusable Consumables
- 9.1. Market Analysis, Insights and Forecast - by Application
- 10. Middle East & Africa Laboratory Consumables Analysis, Insights and Forecast, 2021-2033
- 10.1. Market Analysis, Insights and Forecast - by Application
- 10.1.1. Academic Institutions
- 10.1.2. Clinical and Diagnostic Laboratories
- 10.1.3. Pharmaceutical and Biotechnology Companies
- 10.1.4. Others
- 10.2. Market Analysis, Insights and Forecast - by Type
- 10.2.1. Disposable Consumables
- 10.2.2. Reusable Consumables
- 10.1. Market Analysis, Insights and Forecast - by Application
- 11. Asia Pacific Laboratory Consumables Analysis, Insights and Forecast, 2021-2033
- 11.1. Market Analysis, Insights and Forecast - by Application
- 11.1.1. Academic Institutions
- 11.1.2. Clinical and Diagnostic Laboratories
- 11.1.3. Pharmaceutical and Biotechnology Companies
- 11.1.4. Others
- 11.2. Market Analysis, Insights and Forecast - by Type
- 11.2.1. Disposable Consumables
- 11.2.2. Reusable Consumables
- 11.1. Market Analysis, Insights and Forecast - by Application
- 12. Competitive Analysis
- 12.1. Company Profiles
- 12.1.1 PerkinElmer Inc.
- 12.1.1.1. Company Overview
- 12.1.1.2. Products
- 12.1.1.3. Company Financials
- 12.1.1.4. SWOT Analysis
- 12.1.2 Thermo Fisher Scientific Inc.
- 12.1.2.1. Company Overview
- 12.1.2.2. Products
- 12.1.2.3. Company Financials
- 12.1.2.4. SWOT Analysis
- 12.1.3 Agilent Technologies Inc.
- 12.1.3.1. Company Overview
- 12.1.3.2. Products
- 12.1.3.3. Company Financials
- 12.1.3.4. SWOT Analysis
- 12.1.4 Merck & Co. Inc.
- 12.1.4.1. Company Overview
- 12.1.4.2. Products
- 12.1.4.3. Company Financials
- 12.1.4.4. SWOT Analysis
- 12.1.5 Pace Analytical Services LLC
- 12.1.5.1. Company Overview
- 12.1.5.2. Products
- 12.1.5.3. Company Financials
- 12.1.5.4. SWOT Analysis
- 12.1.6 Shimadzu Corporation
- 12.1.6.1. Company Overview
- 12.1.6.2. Products
- 12.1.6.3. Company Financials
- 12.1.6.4. SWOT Analysis
- 12.1.7 VWR International LLC
- 12.1.7.1. Company Overview
- 12.1.7.2. Products
- 12.1.7.3. Company Financials
- 12.1.7.4. SWOT Analysis
- 12.1.8 Waters Corporation
- 12.1.8.1. Company Overview
- 12.1.8.2. Products
- 12.1.8.3. Company Financials
- 12.1.8.4. SWOT Analysis
- 12.1.9 Danaher
- 12.1.9.1. Company Overview
- 12.1.9.2. Products
- 12.1.9.3. Company Financials
- 12.1.9.4. SWOT Analysis
- 12.1.10 Spectrum Chemical Manufacturing Corp.
- 12.1.10.1. Company Overview
- 12.1.10.2. Products
- 12.1.10.3. Company Financials
- 12.1.10.4. SWOT Analysis
- 12.1.11 WK Life Sciences
- 12.1.11.1. Company Overview
- 12.1.11.2. Products
- 12.1.11.3. Company Financials
- 12.1.11.4. SWOT Analysis
- 12.1.12 VITLAB GmbH
- 12.1.12.1. Company Overview
- 12.1.12.2. Products
- 12.1.12.3. Company Financials
- 12.1.12.4. SWOT Analysis
- 12.1.13 Eppendorf AG
- 12.1.13.1. Company Overview
- 12.1.13.2. Products
- 12.1.13.3. Company Financials
- 12.1.13.4. SWOT Analysis
- 12.1.14 Bellco Glass
- 12.1.14.1. Company Overview
- 12.1.14.2. Products
- 12.1.14.3. Company Financials
- 12.1.14.4. SWOT Analysis
- 12.1.15 SKS Science Products
- 12.1.15.1. Company Overview
- 12.1.15.2. Products
- 12.1.15.3. Company Financials
- 12.1.15.4. SWOT Analysis
- 12.1.16 Citotest Labware Manufacturing Co. Ltd.
- 12.1.16.1. Company Overview
- 12.1.16.2. Products
- 12.1.16.3. Company Financials
- 12.1.16.4. SWOT Analysis
- 12.1.17 Camlab Ltd
- 12.1.17.1. Company Overview
- 12.1.17.2. Products
- 12.1.17.3. Company Financials
- 12.1.17.4. SWOT Analysis
- 12.1.18 Medline Scientific Limited
- 12.1.18.1. Company Overview
- 12.1.18.2. Products
- 12.1.18.3. Company Financials
- 12.1.18.4. SWOT Analysis
- 12.1.19 Crystalgen Inc.
- 12.1.19.1. Company Overview
- 12.1.19.2. Products
- 12.1.19.3. Company Financials
- 12.1.19.4. SWOT Analysis
- 12.1.20 Elkay Laboratory Products
- 12.1.20.1. Company Overview
- 12.1.20.2. Products
- 12.1.20.3. Company Financials
- 12.1.20.4. SWOT Analysis
- 12.1.1 PerkinElmer Inc.
- 12.2. Market Entropy
- 12.2.1 Company's Key Areas Served
- 12.2.2 Recent Developments
- 12.3. Company Market Share Analysis 2025
- 12.3.1 Top 5 Companies Market Share Analysis
- 12.3.2 Top 3 Companies Market Share Analysis
- 12.4. List of Potential Customers
- 13. Research Methodology
List of Figures
- Figure 1: Global Laboratory Consumables Revenue Breakdown (million, %) by Region 2025 & 2033
- Figure 2: North America Laboratory Consumables Revenue (million), by Application 2025 & 2033
- Figure 3: North America Laboratory Consumables Revenue Share (%), by Application 2025 & 2033
- Figure 4: North America Laboratory Consumables Revenue (million), by Type 2025 & 2033
- Figure 5: North America Laboratory Consumables Revenue Share (%), by Type 2025 & 2033
- Figure 6: North America Laboratory Consumables Revenue (million), by Country 2025 & 2033
- Figure 7: North America Laboratory Consumables Revenue Share (%), by Country 2025 & 2033
- Figure 8: South America Laboratory Consumables Revenue (million), by Application 2025 & 2033
- Figure 9: South America Laboratory Consumables Revenue Share (%), by Application 2025 & 2033
- Figure 10: South America Laboratory Consumables Revenue (million), by Type 2025 & 2033
- Figure 11: South America Laboratory Consumables Revenue Share (%), by Type 2025 & 2033
- Figure 12: South America Laboratory Consumables Revenue (million), by Country 2025 & 2033
- Figure 13: South America Laboratory Consumables Revenue Share (%), by Country 2025 & 2033
- Figure 14: Europe Laboratory Consumables Revenue (million), by Application 2025 & 2033
- Figure 15: Europe Laboratory Consumables Revenue Share (%), by Application 2025 & 2033
- Figure 16: Europe Laboratory Consumables Revenue (million), by Type 2025 & 2033
- Figure 17: Europe Laboratory Consumables Revenue Share (%), by Type 2025 & 2033
- Figure 18: Europe Laboratory Consumables Revenue (million), by Country 2025 & 2033
- Figure 19: Europe Laboratory Consumables Revenue Share (%), by Country 2025 & 2033
- Figure 20: Middle East & Africa Laboratory Consumables Revenue (million), by Application 2025 & 2033
- Figure 21: Middle East & Africa Laboratory Consumables Revenue Share (%), by Application 2025 & 2033
- Figure 22: Middle East & Africa Laboratory Consumables Revenue (million), by Type 2025 & 2033
- Figure 23: Middle East & Africa Laboratory Consumables Revenue Share (%), by Type 2025 & 2033
- Figure 24: Middle East & Africa Laboratory Consumables Revenue (million), by Country 2025 & 2033
- Figure 25: Middle East & Africa Laboratory Consumables Revenue Share (%), by Country 2025 & 2033
- Figure 26: Asia Pacific Laboratory Consumables Revenue (million), by Application 2025 & 2033
- Figure 27: Asia Pacific Laboratory Consumables Revenue Share (%), by Application 2025 & 2033
- Figure 28: Asia Pacific Laboratory Consumables Revenue (million), by Type 2025 & 2033
- Figure 29: Asia Pacific Laboratory Consumables Revenue Share (%), by Type 2025 & 2033
- Figure 30: Asia Pacific Laboratory Consumables Revenue (million), by Country 2025 & 2033
- Figure 31: Asia Pacific Laboratory Consumables Revenue Share (%), by Country 2025 & 2033
List of Tables
- Table 1: Global Laboratory Consumables Revenue million Forecast, by Application 2020 & 2033
- Table 2: Global Laboratory Consumables Revenue million Forecast, by Type 2020 & 2033
- Table 3: Global Laboratory Consumables Revenue million Forecast, by Region 2020 & 2033
- Table 4: Global Laboratory Consumables Revenue million Forecast, by Application 2020 & 2033
- Table 5: Global Laboratory Consumables Revenue million Forecast, by Type 2020 & 2033
- Table 6: Global Laboratory Consumables Revenue million Forecast, by Country 2020 & 2033
- Table 7: United States Laboratory Consumables Revenue (million) Forecast, by Application 2020 & 2033
- Table 8: Canada Laboratory Consumables Revenue (million) Forecast, by Application 2020 & 2033
- Table 9: Mexico Laboratory Consumables Revenue (million) Forecast, by Application 2020 & 2033
- Table 10: Global Laboratory Consumables Revenue million Forecast, by Application 2020 & 2033
- Table 11: Global Laboratory Consumables Revenue million Forecast, by Type 2020 & 2033
- Table 12: Global Laboratory Consumables Revenue million Forecast, by Country 2020 & 2033
- Table 13: Brazil Laboratory Consumables Revenue (million) Forecast, by Application 2020 & 2033
- Table 14: Argentina Laboratory Consumables Revenue (million) Forecast, by Application 2020 & 2033
- Table 15: Rest of South America Laboratory Consumables Revenue (million) Forecast, by Application 2020 & 2033
- Table 16: Global Laboratory Consumables Revenue million Forecast, by Application 2020 & 2033
- Table 17: Global Laboratory Consumables Revenue million Forecast, by Type 2020 & 2033
- Table 18: Global Laboratory Consumables Revenue million Forecast, by Country 2020 & 2033
- Table 19: United Kingdom Laboratory Consumables Revenue (million) Forecast, by Application 2020 & 2033
- Table 20: Germany Laboratory Consumables Revenue (million) Forecast, by Application 2020 & 2033
- Table 21: France Laboratory Consumables Revenue (million) Forecast, by Application 2020 & 2033
- Table 22: Italy Laboratory Consumables Revenue (million) Forecast, by Application 2020 & 2033
- Table 23: Spain Laboratory Consumables Revenue (million) Forecast, by Application 2020 & 2033
- Table 24: Russia Laboratory Consumables Revenue (million) Forecast, by Application 2020 & 2033
- Table 25: Benelux Laboratory Consumables Revenue (million) Forecast, by Application 2020 & 2033
- Table 26: Nordics Laboratory Consumables Revenue (million) Forecast, by Application 2020 & 2033
- Table 27: Rest of Europe Laboratory Consumables Revenue (million) Forecast, by Application 2020 & 2033
- Table 28: Global Laboratory Consumables Revenue million Forecast, by Application 2020 & 2033
- Table 29: Global Laboratory Consumables Revenue million Forecast, by Type 2020 & 2033
- Table 30: Global Laboratory Consumables Revenue million Forecast, by Country 2020 & 2033
- Table 31: Turkey Laboratory Consumables Revenue (million) Forecast, by Application 2020 & 2033
- Table 32: Israel Laboratory Consumables Revenue (million) Forecast, by Application 2020 & 2033
- Table 33: GCC Laboratory Consumables Revenue (million) Forecast, by Application 2020 & 2033
- Table 34: North Africa Laboratory Consumables Revenue (million) Forecast, by Application 2020 & 2033
- Table 35: South Africa Laboratory Consumables Revenue (million) Forecast, by Application 2020 & 2033
- Table 36: Rest of Middle East & Africa Laboratory Consumables Revenue (million) Forecast, by Application 2020 & 2033
- Table 37: Global Laboratory Consumables Revenue million Forecast, by Application 2020 & 2033
- Table 38: Global Laboratory Consumables Revenue million Forecast, by Type 2020 & 2033
- Table 39: Global Laboratory Consumables Revenue million Forecast, by Country 2020 & 2033
- Table 40: China Laboratory Consumables Revenue (million) Forecast, by Application 2020 & 2033
- Table 41: India Laboratory Consumables Revenue (million) Forecast, by Application 2020 & 2033
- Table 42: Japan Laboratory Consumables Revenue (million) Forecast, by Application 2020 & 2033
- Table 43: South Korea Laboratory Consumables Revenue (million) Forecast, by Application 2020 & 2033
- Table 44: ASEAN Laboratory Consumables Revenue (million) Forecast, by Application 2020 & 2033
- Table 45: Oceania Laboratory Consumables Revenue (million) Forecast, by Application 2020 & 2033
- Table 46: Rest of Asia Pacific Laboratory Consumables Revenue (million) Forecast, by Application 2020 & 2033
Frequently Asked Questions
1. What is the projected Compound Annual Growth Rate (CAGR) of the Laboratory Consumables?
The projected CAGR is approximately 5.2%.
2. Which companies are prominent players in the Laboratory Consumables?
Key companies in the market include PerkinElmer Inc., Thermo Fisher Scientific, Inc., Agilent Technologies Inc., Merck & Co., Inc., Pace Analytical Services, LLC, Shimadzu Corporation, VWR International, LLC, Waters Corporation, Danaher, Spectrum Chemical Manufacturing Corp., WK Life Sciences, VITLAB GmbH, Eppendorf AG, Bellco Glass, SKS Science Products, Citotest Labware Manufacturing Co., Ltd., Camlab Ltd, Medline Scientific Limited, Crystalgen, Inc., Elkay Laboratory Products.
3. What are the main segments of the Laboratory Consumables?
The market segments include Application, Type.
4. Can you provide details about the market size?
The market size is estimated to be USD 1460 million as of 2022.
5. What are some drivers contributing to market growth?
N/A
6. What are the notable trends driving market growth?
N/A
7. Are there any restraints impacting market growth?
N/A
8. Can you provide examples of recent developments in the market?
N/A
9. What pricing options are available for accessing the report?
Pricing options include single-user, multi-user, and enterprise licenses priced at USD 2900.00, USD 4350.00, and USD 5800.00 respectively.
10. Is the market size provided in terms of value or volume?
The market size is provided in terms of value, measured in million.
11. Are there any specific market keywords associated with the report?
Yes, the market keyword associated with the report is "Laboratory Consumables," which aids in identifying and referencing the specific market segment covered.
12. How do I determine which pricing option suits my needs best?
The pricing options vary based on user requirements and access needs. Individual users may opt for single-user licenses, while businesses requiring broader access may choose multi-user or enterprise licenses for cost-effective access to the report.
13. Are there any additional resources or data provided in the Laboratory Consumables report?
While the report offers comprehensive insights, it's advisable to review the specific contents or supplementary materials provided to ascertain if additional resources or data are available.
14. How can I stay updated on further developments or reports in the Laboratory Consumables?
To stay informed about further developments, trends, and reports in the Laboratory Consumables, consider subscribing to industry newsletters, following relevant companies and organizations, or regularly checking reputable industry news sources and publications.
Methodology
Step 1 - Identification of Relevant Samples Size from Population Database


Step 2 - Approaches for Defining Global Market Size (Value, Volume* & Price*)

Note*: In applicable scenarios
Step 3 - Data Sources
Primary Research
- Web Analytics
- Survey Reports
- Research Institute
- Latest Research Reports
- Opinion Leaders
Secondary Research
- Annual Reports
- White Paper
- Latest Press Release
- Industry Association
- Paid Database
- Investor Presentations

Step 4 - Data Triangulation
Involves using different sources of information in order to increase the validity of a study
These sources are likely to be stakeholders in a program - participants, other researchers, program staff, other community members, and so on.
Then we put all data in single framework & apply various statistical tools to find out the dynamic on the market.
During the analysis stage, feedback from the stakeholder groups would be compared to determine areas of agreement as well as areas of divergence