

Key Insights
The global performance additives market is poised for substantial expansion, with an anticipated Compound Annual Growth Rate (CAGR) of 7.5% from 2024 to 2033. This growth trajectory is underpinned by escalating demand from key sectors such as automotive, construction, and packaging, necessitating additives for improved material performance. Concurrently, evolving environmental regulations are driving the adoption of sustainable, high-performance additives, particularly in Europe and North America. Technological innovations in additive formulation further contribute to this market surge, with plastic additives (e.g., impact modifiers, blowing agents) and those for paints & coatings showing significant upward trends.
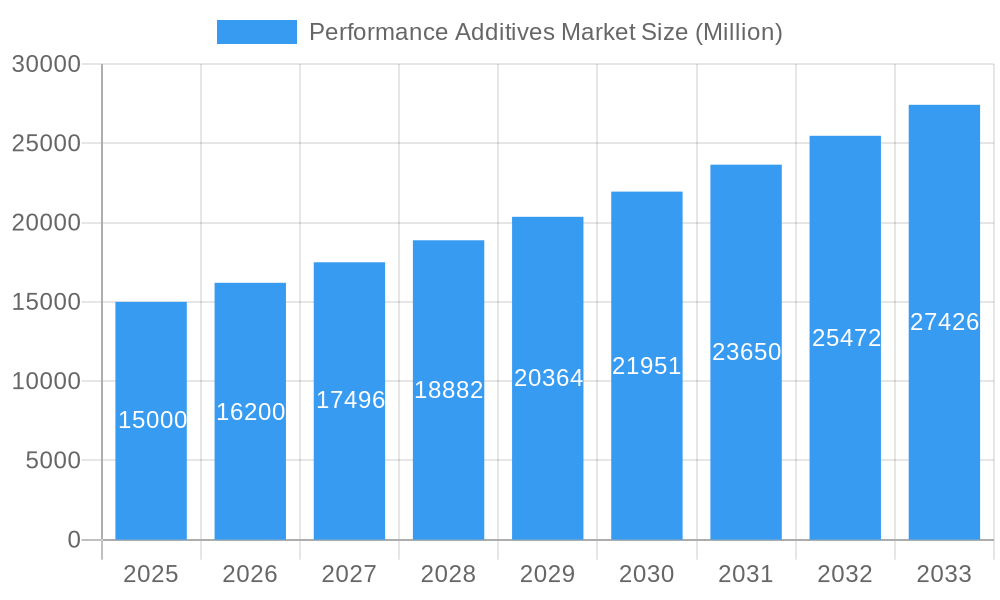
Performance Additives Market Market Size (In Billion)
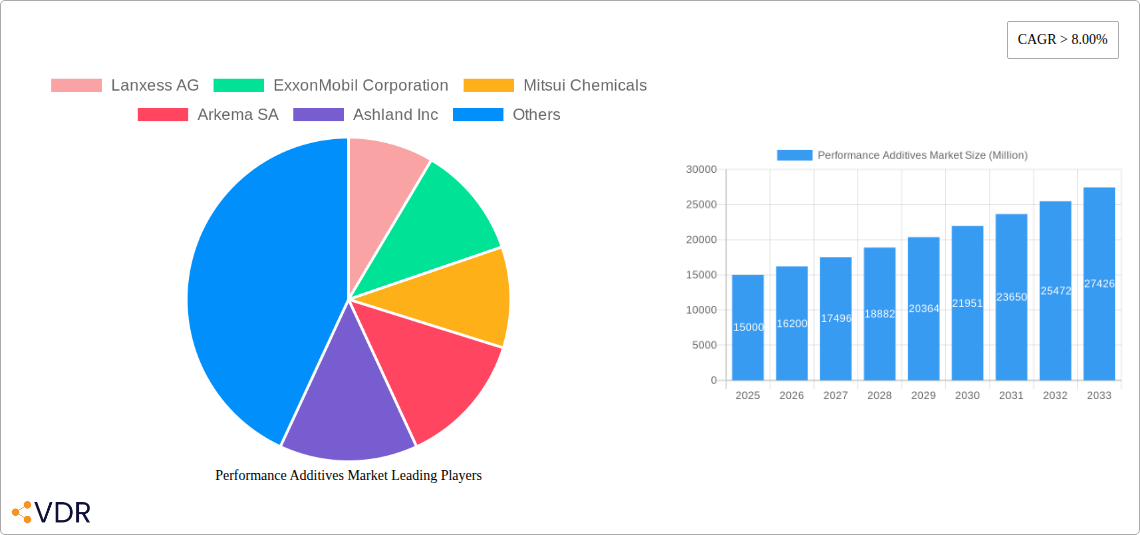
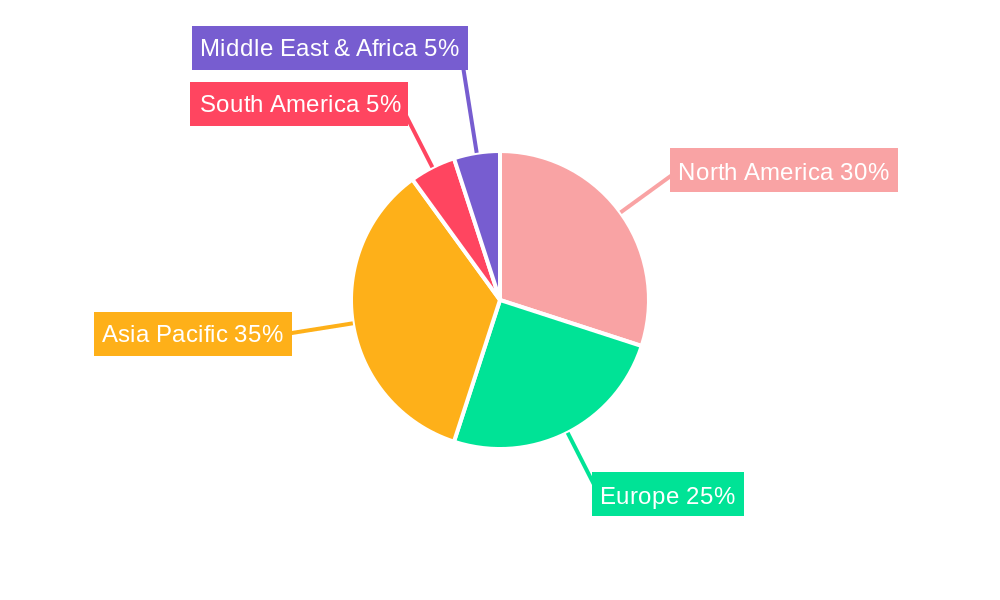
Market segmentation highlights plastic, rubber, and paint & coating additives as key segments. While specific segment sizes are not detailed, plastic and paint & coating additives are estimated to constitute a significant market share. Geographically, the Asia-Pacific region, led by China and India, exhibits strong growth due to rapid industrialization and infrastructure development. North America and Europe maintain strong market positions, supported by advanced manufacturing and technology adoption. Emerging economies in South America and the Middle East & Africa offer significant future growth potential. The market is competitive, featuring major players like Lanxess AG, ExxonMobil Corporation, and BASF SE, who are actively pursuing innovation and portfolio expansion to leverage market opportunities.
Performance Additives Market Company Market Share
The projected market size is $14.02 billion by 2033.
Performance Additives Market Report: 2019-2033
This comprehensive report provides a detailed analysis of the Performance Additives market, encompassing its dynamics, growth trends, regional segmentation, product landscape, and key players. The study covers the period from 2019 to 2033, with a base year of 2025 and a forecast period of 2025-2033. The report leverages extensive data analysis to offer valuable insights for industry professionals, investors, and strategic decision-makers. This report is crucial for understanding the current market scenario and making informed decisions for future growth and investment strategies within the Performance Additives sector and its parent and child markets.
Performance Additives Market Market Dynamics & Structure
The Performance Additives market, valued at xx Million in 2025, exhibits a moderately consolidated structure. Key players, including Lanxess AG, ExxonMobil Corporation, and BASF SE, hold significant market share, while numerous smaller players compete in niche segments. Technological innovation, driven by the need for enhanced performance and sustainability, is a major driver. Stringent regulatory frameworks regarding environmental impact and safety are shaping product development and market access. Competitive pressures from substitutes, particularly bio-based alternatives, are increasing. End-user demographics, primarily across the automotive, construction, and consumer goods sectors, significantly influence market demand. Mergers and acquisitions (M&A) activity is moderate, with xx deals recorded in the past five years, mostly focused on expanding product portfolios and geographical reach.
- Market Concentration: Moderately consolidated, with top 5 players holding xx% market share in 2025.
- Technological Innovation: Focus on enhancing performance, durability, and sustainability.
- Regulatory Landscape: Stringent environmental and safety regulations driving innovation.
- Competitive Substitutes: Growing pressure from bio-based and sustainable alternatives.
- M&A Activity: xx deals in the last 5 years, driven by portfolio expansion and geographical reach.
- Innovation Barriers: High R&D costs and regulatory compliance hurdles.
Performance Additives Market Growth Trends & Insights
The Performance Additives market witnessed robust growth during the historical period (2019-2024), expanding at a CAGR of xx%. This growth is fueled by increasing demand from key end-use industries, particularly the automotive, construction, and packaging sectors. The market is expected to maintain a healthy growth trajectory during the forecast period (2025-2033), with a projected CAGR of xx%, driven by technological advancements, expanding application areas, and rising consumer demand for high-performance materials. Market penetration rates vary significantly across different segments and regions. Technological disruptions, such as the adoption of advanced materials and manufacturing processes, are transforming market dynamics. Consumer behavior shifts, including growing preference for sustainable and eco-friendly products, are influencing product development and market strategy.
- Market Size (2025): xx Million
- CAGR (2019-2024): xx%
- CAGR (2025-2033): xx%
- Market Penetration (2025): xx% (varies by segment)
Dominant Regions, Countries, or Segments in Performance Additives Market
The North American region currently dominates the Performance Additives market, accounting for xx% of the global market share in 2025, followed by Europe and Asia-Pacific. Strong industrial activity, technological advancements, and robust regulatory frameworks contribute to this dominance. Within specific segments, the Paints and Coatings Additives segment (specifically Fuel Additives, holding xx Million market share) demonstrates the highest growth potential, driven by the expanding automotive and construction sectors. The strong demand for Fuel Additives is largely a result of increasingly stringent emission regulations and the need for improved fuel efficiency. Other key segments, including Plastic Additives and Rubber Additives, are also exhibiting significant growth, fueled by rising demand from the packaging and tire industries respectively. Countries like the United States, Germany, China and Japan are major contributors to this regional dominance.
- Leading Region (2025): North America (xx% market share)
- Key Growth Drivers: Strong industrial base, technological advancements, and regulatory environment
- High-Growth Segments: Paints and Coatings Additives (Fuel Additives), Plastic Additives, Rubber Additives.
- Major Contributing Countries: United States, Germany, China, Japan
Performance Additives Market Product Landscape
The Performance Additives market offers a diverse range of products tailored to specific applications. Recent product innovations focus on enhanced performance characteristics, such as improved durability, thermal stability, and UV resistance. Key applications include automotive parts, construction materials, packaging, and electronics. Technological advancements in polymer chemistry, nanotechnology, and bio-based materials are driving the development of novel additives with superior properties. Unique selling propositions increasingly focus on sustainability, cost-effectiveness, and improved performance metrics.
Key Drivers, Barriers & Challenges in Performance Additives Market
Key Drivers:
- Growing demand from end-use industries (automotive, construction, packaging).
- Technological advancements leading to improved performance and functionality.
- Increasing focus on sustainability and environmental regulations.
Challenges and Restraints:
- Fluctuations in raw material prices.
- Stringent regulatory compliance requirements.
- Intense competition from established and emerging players.
- Supply chain disruptions impacting availability and cost.
Emerging Opportunities in Performance Additives Market
- Untapped markets in developing economies.
- Growing demand for high-performance and specialized additives.
- Innovation in bio-based and sustainable additives.
- Expansion into new application areas such as 3D printing and renewable energy.
Growth Accelerators in the Performance Additives Market Industry
Long-term growth will be driven by strategic partnerships, technological breakthroughs (particularly in bio-based materials and nanotechnology), and market expansion into developing economies. Investments in R&D and focused innovation efforts will be critical to maintaining a competitive edge in this dynamic market.
Key Players Shaping the Performance Additives Market Market
- Lanxess AG
- ExxonMobil Corporation
- Mitsui Chemicals
- Arkema SA
- Ashland Inc
- Adeka Corporation
- Evonik Industries AG
- Cytec Solvay
- BASF SE
- Asahi Glass Co Ltd
- Dow
- Eastman Chemical Company
- Lubrizol Corporation (Berkshire Hathaway)
- AkzoNobel NV
- Performance Additives
- Huntsman Corporation
- Baerlocher GmbH
- Clariant AG
- Hexion Inc
- Honeywell International Inc
- List Not Exhaustive
Notable Milestones in Performance Additives Market Sector
- 2021-Q3: Lanxess AG launched a new range of sustainable plastic additives.
- 2022-Q1: BASF SE announced a strategic partnership with a bio-based materials supplier.
- 2023-Q2: Merger between two smaller players in the Rubber Additives segment.
- Further milestones will be detailed in the full report.
In-Depth Performance Additives Market Market Outlook
The Performance Additives market is poised for continued growth, driven by increasing demand from key end-use sectors, technological innovations, and the rising adoption of sustainable practices. Strategic investments in R&D, expansion into new markets, and strategic partnerships will be crucial for companies seeking to capitalize on the significant growth opportunities in this dynamic market. The forecast period will see a strong focus on specialized additives and tailored solutions catering to specific industry needs and consumer preferences, creating a more differentiated and specialized market.
Performance Additives Market Segmentation
-
1. Type
-
1.1. Plastic Additives
- 1.1.1. Lubricants
- 1.1.2. Processing Aids (Fluoropolymer-based)
- 1.1.3. Flow Improvers
- 1.1.4. Slip Additives
- 1.1.5. Antistatic Additives
- 1.1.6. Pigment Wetting Agents
- 1.1.7. Filler Dispersants
- 1.1.8. Antifog Additives
- 1.1.9. Plasticizers
- 1.1.10. Stabilizers
- 1.1.11. Flame Retardants
- 1.1.12. Impact Modifiers
-
1.2. Rubber Additives
- 1.2.1. Accelerators
- 1.2.2. Antidegradants
- 1.2.3. Blowing Agents and Adhesive Agents
-
1.3. Paints and Coatings Additives
- 1.3.1. Biocides
- 1.3.2. Dispersants and Wetting Agents
- 1.3.3. Defoamers and Dearaters
- 1.3.4. Rheology Modifiers
- 1.3.5. Surface Modifiers
- 1.3.6. Flow and Leveling Additives
- 1.3.7. Other Paints and Coatings Additives
-
1.4. Fuel Additives
- 1.4.1. Deposit Control
- 1.4.2. Cetane Improvers
- 1.4.3. Antioxidants
- 1.4.4. Anticorrosion
- 1.4.5. Fuel Dyes
- 1.4.6. Cold Flow Improvers
- 1.4.7. Antiknock Agents
- 1.4.8. Other Fuel Additives
-
1.5. Ink Additives
- 1.5.1. Slip/Rub Material
- 1.5.2. Chelating Agents
- 1.5.3. Other In
-
1.6. Leather Additives
- 1.6.1. Finishing Agents
- 1.6.2. Fat Liquors
- 1.6.3. Syntans
- 1.6.4. Other Le
-
1.7. Lubricant Additives
- 1.7.1. Dispersants and Emulsifiers
- 1.7.2. Viscosity Index Improvers
- 1.7.3. Detergents
- 1.7.4. Corrosion Inhibitors
- 1.7.5. Oxidation Inhibitors
- 1.7.6. Extreme-pressure Additives
- 1.7.7. Friction Modifiers
- 1.7.8. Other Lubricant Additives
-
1.8. Adhesives and Sealants Additives
- 1.8.1. Light Stabilizers
- 1.8.2. Tackifier
- 1.8.3. Other Adhesives and Sealants Additives
-
1.1. Plastic Additives
Performance Additives Market Segmentation By Geography
-
1. Asia Pacific
- 1.1. China
- 1.2. India
- 1.3. Japan
- 1.4. South Korea
- 1.5. Rest of Asia Pacific
-
2. North America
- 2.1. United States
- 2.2. Canada
- 2.3. Mexico
-
3. Europe
- 3.1. Germany
- 3.2. United Kingdom
- 3.3. France
- 3.4. Italy
- 3.5. Rest of Europe
-
4. South America
- 4.1. Brazil
- 4.2. Argentina
- 4.3. Rest of South America
- 5. Middle East
-
6. Saudi Arabia
- 6.1. South Africa
- 6.2. Rest of Middle East
Performance Additives Market Regional Market Share
Geographic Coverage of Performance Additives Market
Performance Additives Market REPORT HIGHLIGHTS
| Aspects | Details |
|---|---|
| Study Period | 2020-2034 |
| Base Year | 2025 |
| Estimated Year | 2026 |
| Forecast Period | 2026-2034 |
| Historical Period | 2020-2025 |
| Growth Rate | CAGR of 7.5% from 2020-2034 |
| Segmentation |
|
Table of Contents
- 1. Introduction
- 1.1. Research Scope
- 1.2. Market Segmentation
- 1.3. Research Objective
- 1.4. Definitions and Assumptions
- 2. Executive Summary
- 2.1. Market Snapshot
- 3. Market Dynamics
- 3.1. Market Drivers
- 3.2. Market Restrains
- 3.3. Market Trends
- 3.4. Market Opportunities
- 4. Market Factor Analysis
- 4.1. Porters Five Forces
- 4.1.1. Bargaining Power of Suppliers
- 4.1.2. Bargaining Power of Buyers
- 4.1.3. Threat of New Entrants
- 4.1.4. Threat of Substitutes
- 4.1.5. Competitive Rivalry
- 4.2. PESTEL analysis
- 4.3. BCG Analysis
- 4.3.1. Stars (High Growth, High Market Share)
- 4.3.2. Cash Cows (Low Growth, High Market Share)
- 4.3.3. Question Mark (High Growth, Low Market Share)
- 4.3.4. Dogs (Low Growth, Low Market Share)
- 4.4. Ansoff Matrix Analysis
- 4.5. Supply Chain Analysis
- 4.6. Regulatory Landscape
- 4.7. Current Market Potential and Opportunity Assessment (TAM–SAM–SOM Framework)
- 4.8. VDR Analyst Note
- 4.1. Porters Five Forces
- 5. Market Analysis, Insights and Forecast 2021-2033
- 5.1. Market Analysis, Insights and Forecast - by Type
- 5.1.1. Plastic Additives
- 5.1.1.1. Lubricants
- 5.1.1.2. Processing Aids (Fluoropolymer-based)
- 5.1.1.3. Flow Improvers
- 5.1.1.4. Slip Additives
- 5.1.1.5. Antistatic Additives
- 5.1.1.6. Pigment Wetting Agents
- 5.1.1.7. Filler Dispersants
- 5.1.1.8. Antifog Additives
- 5.1.1.9. Plasticizers
- 5.1.1.10. Stabilizers
- 5.1.1.11. Flame Retardants
- 5.1.1.12. Impact Modifiers
- 5.1.2. Rubber Additives
- 5.1.2.1. Accelerators
- 5.1.2.2. Antidegradants
- 5.1.2.3. Blowing Agents and Adhesive Agents
- 5.1.3. Paints and Coatings Additives
- 5.1.3.1. Biocides
- 5.1.3.2. Dispersants and Wetting Agents
- 5.1.3.3. Defoamers and Dearaters
- 5.1.3.4. Rheology Modifiers
- 5.1.3.5. Surface Modifiers
- 5.1.3.6. Flow and Leveling Additives
- 5.1.3.7. Other Paints and Coatings Additives
- 5.1.4. Fuel Additives
- 5.1.4.1. Deposit Control
- 5.1.4.2. Cetane Improvers
- 5.1.4.3. Antioxidants
- 5.1.4.4. Anticorrosion
- 5.1.4.5. Fuel Dyes
- 5.1.4.6. Cold Flow Improvers
- 5.1.4.7. Antiknock Agents
- 5.1.4.8. Other Fuel Additives
- 5.1.5. Ink Additives
- 5.1.5.1. Slip/Rub Material
- 5.1.5.2. Chelating Agents
- 5.1.5.3. Other In
- 5.1.6. Leather Additives
- 5.1.6.1. Finishing Agents
- 5.1.6.2. Fat Liquors
- 5.1.6.3. Syntans
- 5.1.6.4. Other Le
- 5.1.7. Lubricant Additives
- 5.1.7.1. Dispersants and Emulsifiers
- 5.1.7.2. Viscosity Index Improvers
- 5.1.7.3. Detergents
- 5.1.7.4. Corrosion Inhibitors
- 5.1.7.5. Oxidation Inhibitors
- 5.1.7.6. Extreme-pressure Additives
- 5.1.7.7. Friction Modifiers
- 5.1.7.8. Other Lubricant Additives
- 5.1.8. Adhesives and Sealants Additives
- 5.1.8.1. Light Stabilizers
- 5.1.8.2. Tackifier
- 5.1.8.3. Other Adhesives and Sealants Additives
- 5.1.1. Plastic Additives
- 5.2. Market Analysis, Insights and Forecast - by Region
- 5.2.1. Asia Pacific
- 5.2.2. North America
- 5.2.3. Europe
- 5.2.4. South America
- 5.2.5. Middle East
- 5.2.6. Saudi Arabia
- 5.1. Market Analysis, Insights and Forecast - by Type
- 6. Global Performance Additives Market Analysis, Insights and Forecast, 2021-2033
- 6.1. Market Analysis, Insights and Forecast - by Type
- 6.1.1. Plastic Additives
- 6.1.1.1. Lubricants
- 6.1.1.2. Processing Aids (Fluoropolymer-based)
- 6.1.1.3. Flow Improvers
- 6.1.1.4. Slip Additives
- 6.1.1.5. Antistatic Additives
- 6.1.1.6. Pigment Wetting Agents
- 6.1.1.7. Filler Dispersants
- 6.1.1.8. Antifog Additives
- 6.1.1.9. Plasticizers
- 6.1.1.10. Stabilizers
- 6.1.1.11. Flame Retardants
- 6.1.1.12. Impact Modifiers
- 6.1.2. Rubber Additives
- 6.1.2.1. Accelerators
- 6.1.2.2. Antidegradants
- 6.1.2.3. Blowing Agents and Adhesive Agents
- 6.1.3. Paints and Coatings Additives
- 6.1.3.1. Biocides
- 6.1.3.2. Dispersants and Wetting Agents
- 6.1.3.3. Defoamers and Dearaters
- 6.1.3.4. Rheology Modifiers
- 6.1.3.5. Surface Modifiers
- 6.1.3.6. Flow and Leveling Additives
- 6.1.3.7. Other Paints and Coatings Additives
- 6.1.4. Fuel Additives
- 6.1.4.1. Deposit Control
- 6.1.4.2. Cetane Improvers
- 6.1.4.3. Antioxidants
- 6.1.4.4. Anticorrosion
- 6.1.4.5. Fuel Dyes
- 6.1.4.6. Cold Flow Improvers
- 6.1.4.7. Antiknock Agents
- 6.1.4.8. Other Fuel Additives
- 6.1.5. Ink Additives
- 6.1.5.1. Slip/Rub Material
- 6.1.5.2. Chelating Agents
- 6.1.5.3. Other In
- 6.1.6. Leather Additives
- 6.1.6.1. Finishing Agents
- 6.1.6.2. Fat Liquors
- 6.1.6.3. Syntans
- 6.1.6.4. Other Le
- 6.1.7. Lubricant Additives
- 6.1.7.1. Dispersants and Emulsifiers
- 6.1.7.2. Viscosity Index Improvers
- 6.1.7.3. Detergents
- 6.1.7.4. Corrosion Inhibitors
- 6.1.7.5. Oxidation Inhibitors
- 6.1.7.6. Extreme-pressure Additives
- 6.1.7.7. Friction Modifiers
- 6.1.7.8. Other Lubricant Additives
- 6.1.8. Adhesives and Sealants Additives
- 6.1.8.1. Light Stabilizers
- 6.1.8.2. Tackifier
- 6.1.8.3. Other Adhesives and Sealants Additives
- 6.1.1. Plastic Additives
- 6.1. Market Analysis, Insights and Forecast - by Type
- 7. Asia Pacific Performance Additives Market Analysis, Insights and Forecast, 2021-2033
- 7.1. Market Analysis, Insights and Forecast - by Type
- 7.1.1. Plastic Additives
- 7.1.1.1. Lubricants
- 7.1.1.2. Processing Aids (Fluoropolymer-based)
- 7.1.1.3. Flow Improvers
- 7.1.1.4. Slip Additives
- 7.1.1.5. Antistatic Additives
- 7.1.1.6. Pigment Wetting Agents
- 7.1.1.7. Filler Dispersants
- 7.1.1.8. Antifog Additives
- 7.1.1.9. Plasticizers
- 7.1.1.10. Stabilizers
- 7.1.1.11. Flame Retardants
- 7.1.1.12. Impact Modifiers
- 7.1.2. Rubber Additives
- 7.1.2.1. Accelerators
- 7.1.2.2. Antidegradants
- 7.1.2.3. Blowing Agents and Adhesive Agents
- 7.1.3. Paints and Coatings Additives
- 7.1.3.1. Biocides
- 7.1.3.2. Dispersants and Wetting Agents
- 7.1.3.3. Defoamers and Dearaters
- 7.1.3.4. Rheology Modifiers
- 7.1.3.5. Surface Modifiers
- 7.1.3.6. Flow and Leveling Additives
- 7.1.3.7. Other Paints and Coatings Additives
- 7.1.4. Fuel Additives
- 7.1.4.1. Deposit Control
- 7.1.4.2. Cetane Improvers
- 7.1.4.3. Antioxidants
- 7.1.4.4. Anticorrosion
- 7.1.4.5. Fuel Dyes
- 7.1.4.6. Cold Flow Improvers
- 7.1.4.7. Antiknock Agents
- 7.1.4.8. Other Fuel Additives
- 7.1.5. Ink Additives
- 7.1.5.1. Slip/Rub Material
- 7.1.5.2. Chelating Agents
- 7.1.5.3. Other In
- 7.1.6. Leather Additives
- 7.1.6.1. Finishing Agents
- 7.1.6.2. Fat Liquors
- 7.1.6.3. Syntans
- 7.1.6.4. Other Le
- 7.1.7. Lubricant Additives
- 7.1.7.1. Dispersants and Emulsifiers
- 7.1.7.2. Viscosity Index Improvers
- 7.1.7.3. Detergents
- 7.1.7.4. Corrosion Inhibitors
- 7.1.7.5. Oxidation Inhibitors
- 7.1.7.6. Extreme-pressure Additives
- 7.1.7.7. Friction Modifiers
- 7.1.7.8. Other Lubricant Additives
- 7.1.8. Adhesives and Sealants Additives
- 7.1.8.1. Light Stabilizers
- 7.1.8.2. Tackifier
- 7.1.8.3. Other Adhesives and Sealants Additives
- 7.1.1. Plastic Additives
- 7.1. Market Analysis, Insights and Forecast - by Type
- 8. North America Performance Additives Market Analysis, Insights and Forecast, 2021-2033
- 8.1. Market Analysis, Insights and Forecast - by Type
- 8.1.1. Plastic Additives
- 8.1.1.1. Lubricants
- 8.1.1.2. Processing Aids (Fluoropolymer-based)
- 8.1.1.3. Flow Improvers
- 8.1.1.4. Slip Additives
- 8.1.1.5. Antistatic Additives
- 8.1.1.6. Pigment Wetting Agents
- 8.1.1.7. Filler Dispersants
- 8.1.1.8. Antifog Additives
- 8.1.1.9. Plasticizers
- 8.1.1.10. Stabilizers
- 8.1.1.11. Flame Retardants
- 8.1.1.12. Impact Modifiers
- 8.1.2. Rubber Additives
- 8.1.2.1. Accelerators
- 8.1.2.2. Antidegradants
- 8.1.2.3. Blowing Agents and Adhesive Agents
- 8.1.3. Paints and Coatings Additives
- 8.1.3.1. Biocides
- 8.1.3.2. Dispersants and Wetting Agents
- 8.1.3.3. Defoamers and Dearaters
- 8.1.3.4. Rheology Modifiers
- 8.1.3.5. Surface Modifiers
- 8.1.3.6. Flow and Leveling Additives
- 8.1.3.7. Other Paints and Coatings Additives
- 8.1.4. Fuel Additives
- 8.1.4.1. Deposit Control
- 8.1.4.2. Cetane Improvers
- 8.1.4.3. Antioxidants
- 8.1.4.4. Anticorrosion
- 8.1.4.5. Fuel Dyes
- 8.1.4.6. Cold Flow Improvers
- 8.1.4.7. Antiknock Agents
- 8.1.4.8. Other Fuel Additives
- 8.1.5. Ink Additives
- 8.1.5.1. Slip/Rub Material
- 8.1.5.2. Chelating Agents
- 8.1.5.3. Other In
- 8.1.6. Leather Additives
- 8.1.6.1. Finishing Agents
- 8.1.6.2. Fat Liquors
- 8.1.6.3. Syntans
- 8.1.6.4. Other Le
- 8.1.7. Lubricant Additives
- 8.1.7.1. Dispersants and Emulsifiers
- 8.1.7.2. Viscosity Index Improvers
- 8.1.7.3. Detergents
- 8.1.7.4. Corrosion Inhibitors
- 8.1.7.5. Oxidation Inhibitors
- 8.1.7.6. Extreme-pressure Additives
- 8.1.7.7. Friction Modifiers
- 8.1.7.8. Other Lubricant Additives
- 8.1.8. Adhesives and Sealants Additives
- 8.1.8.1. Light Stabilizers
- 8.1.8.2. Tackifier
- 8.1.8.3. Other Adhesives and Sealants Additives
- 8.1.1. Plastic Additives
- 8.1. Market Analysis, Insights and Forecast - by Type
- 9. Europe Performance Additives Market Analysis, Insights and Forecast, 2021-2033
- 9.1. Market Analysis, Insights and Forecast - by Type
- 9.1.1. Plastic Additives
- 9.1.1.1. Lubricants
- 9.1.1.2. Processing Aids (Fluoropolymer-based)
- 9.1.1.3. Flow Improvers
- 9.1.1.4. Slip Additives
- 9.1.1.5. Antistatic Additives
- 9.1.1.6. Pigment Wetting Agents
- 9.1.1.7. Filler Dispersants
- 9.1.1.8. Antifog Additives
- 9.1.1.9. Plasticizers
- 9.1.1.10. Stabilizers
- 9.1.1.11. Flame Retardants
- 9.1.1.12. Impact Modifiers
- 9.1.2. Rubber Additives
- 9.1.2.1. Accelerators
- 9.1.2.2. Antidegradants
- 9.1.2.3. Blowing Agents and Adhesive Agents
- 9.1.3. Paints and Coatings Additives
- 9.1.3.1. Biocides
- 9.1.3.2. Dispersants and Wetting Agents
- 9.1.3.3. Defoamers and Dearaters
- 9.1.3.4. Rheology Modifiers
- 9.1.3.5. Surface Modifiers
- 9.1.3.6. Flow and Leveling Additives
- 9.1.3.7. Other Paints and Coatings Additives
- 9.1.4. Fuel Additives
- 9.1.4.1. Deposit Control
- 9.1.4.2. Cetane Improvers
- 9.1.4.3. Antioxidants
- 9.1.4.4. Anticorrosion
- 9.1.4.5. Fuel Dyes
- 9.1.4.6. Cold Flow Improvers
- 9.1.4.7. Antiknock Agents
- 9.1.4.8. Other Fuel Additives
- 9.1.5. Ink Additives
- 9.1.5.1. Slip/Rub Material
- 9.1.5.2. Chelating Agents
- 9.1.5.3. Other In
- 9.1.6. Leather Additives
- 9.1.6.1. Finishing Agents
- 9.1.6.2. Fat Liquors
- 9.1.6.3. Syntans
- 9.1.6.4. Other Le
- 9.1.7. Lubricant Additives
- 9.1.7.1. Dispersants and Emulsifiers
- 9.1.7.2. Viscosity Index Improvers
- 9.1.7.3. Detergents
- 9.1.7.4. Corrosion Inhibitors
- 9.1.7.5. Oxidation Inhibitors
- 9.1.7.6. Extreme-pressure Additives
- 9.1.7.7. Friction Modifiers
- 9.1.7.8. Other Lubricant Additives
- 9.1.8. Adhesives and Sealants Additives
- 9.1.8.1. Light Stabilizers
- 9.1.8.2. Tackifier
- 9.1.8.3. Other Adhesives and Sealants Additives
- 9.1.1. Plastic Additives
- 9.1. Market Analysis, Insights and Forecast - by Type
- 10. South America Performance Additives Market Analysis, Insights and Forecast, 2021-2033
- 10.1. Market Analysis, Insights and Forecast - by Type
- 10.1.1. Plastic Additives
- 10.1.1.1. Lubricants
- 10.1.1.2. Processing Aids (Fluoropolymer-based)
- 10.1.1.3. Flow Improvers
- 10.1.1.4. Slip Additives
- 10.1.1.5. Antistatic Additives
- 10.1.1.6. Pigment Wetting Agents
- 10.1.1.7. Filler Dispersants
- 10.1.1.8. Antifog Additives
- 10.1.1.9. Plasticizers
- 10.1.1.10. Stabilizers
- 10.1.1.11. Flame Retardants
- 10.1.1.12. Impact Modifiers
- 10.1.2. Rubber Additives
- 10.1.2.1. Accelerators
- 10.1.2.2. Antidegradants
- 10.1.2.3. Blowing Agents and Adhesive Agents
- 10.1.3. Paints and Coatings Additives
- 10.1.3.1. Biocides
- 10.1.3.2. Dispersants and Wetting Agents
- 10.1.3.3. Defoamers and Dearaters
- 10.1.3.4. Rheology Modifiers
- 10.1.3.5. Surface Modifiers
- 10.1.3.6. Flow and Leveling Additives
- 10.1.3.7. Other Paints and Coatings Additives
- 10.1.4. Fuel Additives
- 10.1.4.1. Deposit Control
- 10.1.4.2. Cetane Improvers
- 10.1.4.3. Antioxidants
- 10.1.4.4. Anticorrosion
- 10.1.4.5. Fuel Dyes
- 10.1.4.6. Cold Flow Improvers
- 10.1.4.7. Antiknock Agents
- 10.1.4.8. Other Fuel Additives
- 10.1.5. Ink Additives
- 10.1.5.1. Slip/Rub Material
- 10.1.5.2. Chelating Agents
- 10.1.5.3. Other In
- 10.1.6. Leather Additives
- 10.1.6.1. Finishing Agents
- 10.1.6.2. Fat Liquors
- 10.1.6.3. Syntans
- 10.1.6.4. Other Le
- 10.1.7. Lubricant Additives
- 10.1.7.1. Dispersants and Emulsifiers
- 10.1.7.2. Viscosity Index Improvers
- 10.1.7.3. Detergents
- 10.1.7.4. Corrosion Inhibitors
- 10.1.7.5. Oxidation Inhibitors
- 10.1.7.6. Extreme-pressure Additives
- 10.1.7.7. Friction Modifiers
- 10.1.7.8. Other Lubricant Additives
- 10.1.8. Adhesives and Sealants Additives
- 10.1.8.1. Light Stabilizers
- 10.1.8.2. Tackifier
- 10.1.8.3. Other Adhesives and Sealants Additives
- 10.1.1. Plastic Additives
- 10.1. Market Analysis, Insights and Forecast - by Type
- 11. Middle East Performance Additives Market Analysis, Insights and Forecast, 2021-2033
- 11.1. Market Analysis, Insights and Forecast - by Type
- 11.1.1. Plastic Additives
- 11.1.1.1. Lubricants
- 11.1.1.2. Processing Aids (Fluoropolymer-based)
- 11.1.1.3. Flow Improvers
- 11.1.1.4. Slip Additives
- 11.1.1.5. Antistatic Additives
- 11.1.1.6. Pigment Wetting Agents
- 11.1.1.7. Filler Dispersants
- 11.1.1.8. Antifog Additives
- 11.1.1.9. Plasticizers
- 11.1.1.10. Stabilizers
- 11.1.1.11. Flame Retardants
- 11.1.1.12. Impact Modifiers
- 11.1.2. Rubber Additives
- 11.1.2.1. Accelerators
- 11.1.2.2. Antidegradants
- 11.1.2.3. Blowing Agents and Adhesive Agents
- 11.1.3. Paints and Coatings Additives
- 11.1.3.1. Biocides
- 11.1.3.2. Dispersants and Wetting Agents
- 11.1.3.3. Defoamers and Dearaters
- 11.1.3.4. Rheology Modifiers
- 11.1.3.5. Surface Modifiers
- 11.1.3.6. Flow and Leveling Additives
- 11.1.3.7. Other Paints and Coatings Additives
- 11.1.4. Fuel Additives
- 11.1.4.1. Deposit Control
- 11.1.4.2. Cetane Improvers
- 11.1.4.3. Antioxidants
- 11.1.4.4. Anticorrosion
- 11.1.4.5. Fuel Dyes
- 11.1.4.6. Cold Flow Improvers
- 11.1.4.7. Antiknock Agents
- 11.1.4.8. Other Fuel Additives
- 11.1.5. Ink Additives
- 11.1.5.1. Slip/Rub Material
- 11.1.5.2. Chelating Agents
- 11.1.5.3. Other In
- 11.1.6. Leather Additives
- 11.1.6.1. Finishing Agents
- 11.1.6.2. Fat Liquors
- 11.1.6.3. Syntans
- 11.1.6.4. Other Le
- 11.1.7. Lubricant Additives
- 11.1.7.1. Dispersants and Emulsifiers
- 11.1.7.2. Viscosity Index Improvers
- 11.1.7.3. Detergents
- 11.1.7.4. Corrosion Inhibitors
- 11.1.7.5. Oxidation Inhibitors
- 11.1.7.6. Extreme-pressure Additives
- 11.1.7.7. Friction Modifiers
- 11.1.7.8. Other Lubricant Additives
- 11.1.8. Adhesives and Sealants Additives
- 11.1.8.1. Light Stabilizers
- 11.1.8.2. Tackifier
- 11.1.8.3. Other Adhesives and Sealants Additives
- 11.1.1. Plastic Additives
- 11.1. Market Analysis, Insights and Forecast - by Type
- 12. Saudi Arabia Performance Additives Market Analysis, Insights and Forecast, 2021-2033
- 12.1. Market Analysis, Insights and Forecast - by Type
- 12.1.1. Plastic Additives
- 12.1.1.1. Lubricants
- 12.1.1.2. Processing Aids (Fluoropolymer-based)
- 12.1.1.3. Flow Improvers
- 12.1.1.4. Slip Additives
- 12.1.1.5. Antistatic Additives
- 12.1.1.6. Pigment Wetting Agents
- 12.1.1.7. Filler Dispersants
- 12.1.1.8. Antifog Additives
- 12.1.1.9. Plasticizers
- 12.1.1.10. Stabilizers
- 12.1.1.11. Flame Retardants
- 12.1.1.12. Impact Modifiers
- 12.1.2. Rubber Additives
- 12.1.2.1. Accelerators
- 12.1.2.2. Antidegradants
- 12.1.2.3. Blowing Agents and Adhesive Agents
- 12.1.3. Paints and Coatings Additives
- 12.1.3.1. Biocides
- 12.1.3.2. Dispersants and Wetting Agents
- 12.1.3.3. Defoamers and Dearaters
- 12.1.3.4. Rheology Modifiers
- 12.1.3.5. Surface Modifiers
- 12.1.3.6. Flow and Leveling Additives
- 12.1.3.7. Other Paints and Coatings Additives
- 12.1.4. Fuel Additives
- 12.1.4.1. Deposit Control
- 12.1.4.2. Cetane Improvers
- 12.1.4.3. Antioxidants
- 12.1.4.4. Anticorrosion
- 12.1.4.5. Fuel Dyes
- 12.1.4.6. Cold Flow Improvers
- 12.1.4.7. Antiknock Agents
- 12.1.4.8. Other Fuel Additives
- 12.1.5. Ink Additives
- 12.1.5.1. Slip/Rub Material
- 12.1.5.2. Chelating Agents
- 12.1.5.3. Other In
- 12.1.6. Leather Additives
- 12.1.6.1. Finishing Agents
- 12.1.6.2. Fat Liquors
- 12.1.6.3. Syntans
- 12.1.6.4. Other Le
- 12.1.7. Lubricant Additives
- 12.1.7.1. Dispersants and Emulsifiers
- 12.1.7.2. Viscosity Index Improvers
- 12.1.7.3. Detergents
- 12.1.7.4. Corrosion Inhibitors
- 12.1.7.5. Oxidation Inhibitors
- 12.1.7.6. Extreme-pressure Additives
- 12.1.7.7. Friction Modifiers
- 12.1.7.8. Other Lubricant Additives
- 12.1.8. Adhesives and Sealants Additives
- 12.1.8.1. Light Stabilizers
- 12.1.8.2. Tackifier
- 12.1.8.3. Other Adhesives and Sealants Additives
- 12.1.1. Plastic Additives
- 12.1. Market Analysis, Insights and Forecast - by Type
- 13. Competitive Analysis
- 13.1. Company Profiles
- 13.1.1 Lanxess AG
- 13.1.1.1. Company Overview
- 13.1.1.2. Products
- 13.1.1.3. Company Financials
- 13.1.1.4. SWOT Analysis
- 13.1.2 ExxonMobil Corporation
- 13.1.2.1. Company Overview
- 13.1.2.2. Products
- 13.1.2.3. Company Financials
- 13.1.2.4. SWOT Analysis
- 13.1.3 Mitsui Chemicals
- 13.1.3.1. Company Overview
- 13.1.3.2. Products
- 13.1.3.3. Company Financials
- 13.1.3.4. SWOT Analysis
- 13.1.4 Arkema SA
- 13.1.4.1. Company Overview
- 13.1.4.2. Products
- 13.1.4.3. Company Financials
- 13.1.4.4. SWOT Analysis
- 13.1.5 Ashland Inc
- 13.1.5.1. Company Overview
- 13.1.5.2. Products
- 13.1.5.3. Company Financials
- 13.1.5.4. SWOT Analysis
- 13.1.6 Adeka Corporation
- 13.1.6.1. Company Overview
- 13.1.6.2. Products
- 13.1.6.3. Company Financials
- 13.1.6.4. SWOT Analysis
- 13.1.7 Evonik Industries AG
- 13.1.7.1. Company Overview
- 13.1.7.2. Products
- 13.1.7.3. Company Financials
- 13.1.7.4. SWOT Analysis
- 13.1.8 Cytec Solvay
- 13.1.8.1. Company Overview
- 13.1.8.2. Products
- 13.1.8.3. Company Financials
- 13.1.8.4. SWOT Analysis
- 13.1.9 BASF SE
- 13.1.9.1. Company Overview
- 13.1.9.2. Products
- 13.1.9.3. Company Financials
- 13.1.9.4. SWOT Analysis
- 13.1.10 Asahi Glass Co Ltd
- 13.1.10.1. Company Overview
- 13.1.10.2. Products
- 13.1.10.3. Company Financials
- 13.1.10.4. SWOT Analysis
- 13.1.11 Dow
- 13.1.11.1. Company Overview
- 13.1.11.2. Products
- 13.1.11.3. Company Financials
- 13.1.11.4. SWOT Analysis
- 13.1.12 Eastman Chemical Company
- 13.1.12.1. Company Overview
- 13.1.12.2. Products
- 13.1.12.3. Company Financials
- 13.1.12.4. SWOT Analysis
- 13.1.13 Lubrizol Corporation (Berkshire Hathaway)
- 13.1.13.1. Company Overview
- 13.1.13.2. Products
- 13.1.13.3. Company Financials
- 13.1.13.4. SWOT Analysis
- 13.1.14 AkzoNobel NV
- 13.1.14.1. Company Overview
- 13.1.14.2. Products
- 13.1.14.3. Company Financials
- 13.1.14.4. SWOT Analysis
- 13.1.15 Performance Additives
- 13.1.15.1. Company Overview
- 13.1.15.2. Products
- 13.1.15.3. Company Financials
- 13.1.15.4. SWOT Analysis
- 13.1.16 Huntsman Corporation
- 13.1.16.1. Company Overview
- 13.1.16.2. Products
- 13.1.16.3. Company Financials
- 13.1.16.4. SWOT Analysis
- 13.1.17 Baerlocher GmbH
- 13.1.17.1. Company Overview
- 13.1.17.2. Products
- 13.1.17.3. Company Financials
- 13.1.17.4. SWOT Analysis
- 13.1.18 Clariant AG
- 13.1.18.1. Company Overview
- 13.1.18.2. Products
- 13.1.18.3. Company Financials
- 13.1.18.4. SWOT Analysis
- 13.1.19 Hexion Inc
- 13.1.19.1. Company Overview
- 13.1.19.2. Products
- 13.1.19.3. Company Financials
- 13.1.19.4. SWOT Analysis
- 13.1.20 Honeywell International Inc *List Not Exhaustive
- 13.1.20.1. Company Overview
- 13.1.20.2. Products
- 13.1.20.3. Company Financials
- 13.1.20.4. SWOT Analysis
- 13.1.1 Lanxess AG
- 13.2. Market Entropy
- 13.2.1 Company's Key Areas Served
- 13.2.2 Recent Developments
- 13.3. Company Market Share Analysis 2025
- 13.3.1 Top 5 Companies Market Share Analysis
- 13.3.2 Top 3 Companies Market Share Analysis
- 13.4. List of Potential Customers
- 14. Research Methodology
List of Figures
- Figure 1: Global Performance Additives Market Revenue Breakdown (billion, %) by Region 2025 & 2033
- Figure 2: Asia Pacific Performance Additives Market Revenue (billion), by Type 2025 & 2033
- Figure 3: Asia Pacific Performance Additives Market Revenue Share (%), by Type 2025 & 2033
- Figure 4: Asia Pacific Performance Additives Market Revenue (billion), by Country 2025 & 2033
- Figure 5: Asia Pacific Performance Additives Market Revenue Share (%), by Country 2025 & 2033
- Figure 6: North America Performance Additives Market Revenue (billion), by Type 2025 & 2033
- Figure 7: North America Performance Additives Market Revenue Share (%), by Type 2025 & 2033
- Figure 8: North America Performance Additives Market Revenue (billion), by Country 2025 & 2033
- Figure 9: North America Performance Additives Market Revenue Share (%), by Country 2025 & 2033
- Figure 10: Europe Performance Additives Market Revenue (billion), by Type 2025 & 2033
- Figure 11: Europe Performance Additives Market Revenue Share (%), by Type 2025 & 2033
- Figure 12: Europe Performance Additives Market Revenue (billion), by Country 2025 & 2033
- Figure 13: Europe Performance Additives Market Revenue Share (%), by Country 2025 & 2033
- Figure 14: South America Performance Additives Market Revenue (billion), by Type 2025 & 2033
- Figure 15: South America Performance Additives Market Revenue Share (%), by Type 2025 & 2033
- Figure 16: South America Performance Additives Market Revenue (billion), by Country 2025 & 2033
- Figure 17: South America Performance Additives Market Revenue Share (%), by Country 2025 & 2033
- Figure 18: Middle East Performance Additives Market Revenue (billion), by Type 2025 & 2033
- Figure 19: Middle East Performance Additives Market Revenue Share (%), by Type 2025 & 2033
- Figure 20: Middle East Performance Additives Market Revenue (billion), by Country 2025 & 2033
- Figure 21: Middle East Performance Additives Market Revenue Share (%), by Country 2025 & 2033
- Figure 22: Saudi Arabia Performance Additives Market Revenue (billion), by Type 2025 & 2033
- Figure 23: Saudi Arabia Performance Additives Market Revenue Share (%), by Type 2025 & 2033
- Figure 24: Saudi Arabia Performance Additives Market Revenue (billion), by Country 2025 & 2033
- Figure 25: Saudi Arabia Performance Additives Market Revenue Share (%), by Country 2025 & 2033
List of Tables
- Table 1: Global Performance Additives Market Revenue billion Forecast, by Type 2020 & 2033
- Table 2: Global Performance Additives Market Revenue billion Forecast, by Region 2020 & 2033
- Table 3: Global Performance Additives Market Revenue billion Forecast, by Type 2020 & 2033
- Table 4: Global Performance Additives Market Revenue billion Forecast, by Country 2020 & 2033
- Table 5: China Performance Additives Market Revenue (billion) Forecast, by Application 2020 & 2033
- Table 6: India Performance Additives Market Revenue (billion) Forecast, by Application 2020 & 2033
- Table 7: Japan Performance Additives Market Revenue (billion) Forecast, by Application 2020 & 2033
- Table 8: South Korea Performance Additives Market Revenue (billion) Forecast, by Application 2020 & 2033
- Table 9: Rest of Asia Pacific Performance Additives Market Revenue (billion) Forecast, by Application 2020 & 2033
- Table 10: Global Performance Additives Market Revenue billion Forecast, by Type 2020 & 2033
- Table 11: Global Performance Additives Market Revenue billion Forecast, by Country 2020 & 2033
- Table 12: United States Performance Additives Market Revenue (billion) Forecast, by Application 2020 & 2033
- Table 13: Canada Performance Additives Market Revenue (billion) Forecast, by Application 2020 & 2033
- Table 14: Mexico Performance Additives Market Revenue (billion) Forecast, by Application 2020 & 2033
- Table 15: Global Performance Additives Market Revenue billion Forecast, by Type 2020 & 2033
- Table 16: Global Performance Additives Market Revenue billion Forecast, by Country 2020 & 2033
- Table 17: Germany Performance Additives Market Revenue (billion) Forecast, by Application 2020 & 2033
- Table 18: United Kingdom Performance Additives Market Revenue (billion) Forecast, by Application 2020 & 2033
- Table 19: France Performance Additives Market Revenue (billion) Forecast, by Application 2020 & 2033
- Table 20: Italy Performance Additives Market Revenue (billion) Forecast, by Application 2020 & 2033
- Table 21: Rest of Europe Performance Additives Market Revenue (billion) Forecast, by Application 2020 & 2033
- Table 22: Global Performance Additives Market Revenue billion Forecast, by Type 2020 & 2033
- Table 23: Global Performance Additives Market Revenue billion Forecast, by Country 2020 & 2033
- Table 24: Brazil Performance Additives Market Revenue (billion) Forecast, by Application 2020 & 2033
- Table 25: Argentina Performance Additives Market Revenue (billion) Forecast, by Application 2020 & 2033
- Table 26: Rest of South America Performance Additives Market Revenue (billion) Forecast, by Application 2020 & 2033
- Table 27: Global Performance Additives Market Revenue billion Forecast, by Type 2020 & 2033
- Table 28: Global Performance Additives Market Revenue billion Forecast, by Country 2020 & 2033
- Table 29: Global Performance Additives Market Revenue billion Forecast, by Type 2020 & 2033
- Table 30: Global Performance Additives Market Revenue billion Forecast, by Country 2020 & 2033
- Table 31: South Africa Performance Additives Market Revenue (billion) Forecast, by Application 2020 & 2033
- Table 32: Rest of Middle East Performance Additives Market Revenue (billion) Forecast, by Application 2020 & 2033
Frequently Asked Questions
1. What is the projected Compound Annual Growth Rate (CAGR) of the Performance Additives Market?
The projected CAGR is approximately 7.5%.
2. Which companies are prominent players in the Performance Additives Market?
Key companies in the market include Lanxess AG, ExxonMobil Corporation, Mitsui Chemicals, Arkema SA, Ashland Inc, Adeka Corporation, Evonik Industries AG, Cytec Solvay, BASF SE, Asahi Glass Co Ltd, Dow, Eastman Chemical Company, Lubrizol Corporation (Berkshire Hathaway), AkzoNobel NV, Performance Additives, Huntsman Corporation, Baerlocher GmbH, Clariant AG, Hexion Inc, Honeywell International Inc *List Not Exhaustive.
3. What are the main segments of the Performance Additives Market?
The market segments include Type.
4. Can you provide details about the market size?
The market size is estimated to be USD 14.02 billion as of 2022.
5. What are some drivers contributing to market growth?
; Replacement of Conventional Materials by Plastics in Several Applications; Increasing Demand for Plastic in Emerging Nations.
6. What are the notable trends driving market growth?
Plastic Additives Segment to Dominate the Market Demand.
7. Are there any restraints impacting market growth?
; Stringent Governmental Regulations on Plastic Usage; Depleting Natural Resources. such as Oil and Gas.
8. Can you provide examples of recent developments in the market?
N/A
9. What pricing options are available for accessing the report?
Pricing options include single-user, multi-user, and enterprise licenses priced at USD 4750, USD 5250, and USD 8750 respectively.
10. Is the market size provided in terms of value or volume?
The market size is provided in terms of value, measured in billion.
11. Are there any specific market keywords associated with the report?
Yes, the market keyword associated with the report is "Performance Additives Market," which aids in identifying and referencing the specific market segment covered.
12. How do I determine which pricing option suits my needs best?
The pricing options vary based on user requirements and access needs. Individual users may opt for single-user licenses, while businesses requiring broader access may choose multi-user or enterprise licenses for cost-effective access to the report.
13. Are there any additional resources or data provided in the Performance Additives Market report?
While the report offers comprehensive insights, it's advisable to review the specific contents or supplementary materials provided to ascertain if additional resources or data are available.
14. How can I stay updated on further developments or reports in the Performance Additives Market?
To stay informed about further developments, trends, and reports in the Performance Additives Market, consider subscribing to industry newsletters, following relevant companies and organizations, or regularly checking reputable industry news sources and publications.
Methodology
Step 1 - Identification of Relevant Samples Size from Population Database


Step 2 - Approaches for Defining Global Market Size (Value, Volume* & Price*)

Note*: In applicable scenarios
Step 3 - Data Sources
Primary Research
- Web Analytics
- Survey Reports
- Research Institute
- Latest Research Reports
- Opinion Leaders
Secondary Research
- Annual Reports
- White Paper
- Latest Press Release
- Industry Association
- Paid Database
- Investor Presentations

Step 4 - Data Triangulation
Involves using different sources of information in order to increase the validity of a study
These sources are likely to be stakeholders in a program - participants, other researchers, program staff, other community members, and so on.
Then we put all data in single framework & apply various statistical tools to find out the dynamic on the market.
During the analysis stage, feedback from the stakeholder groups would be compared to determine areas of agreement as well as areas of divergence