
Key Insights
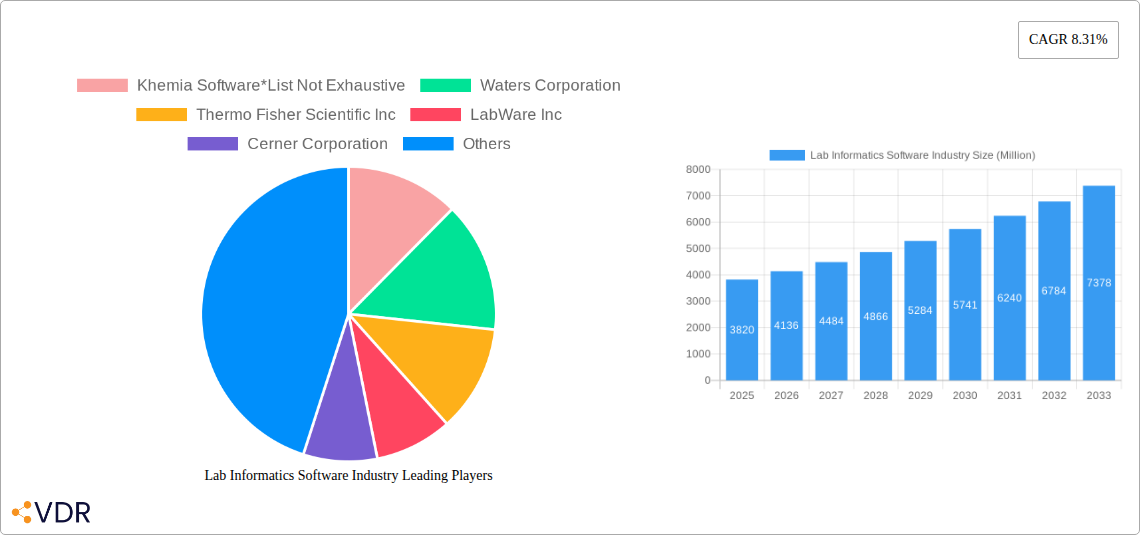
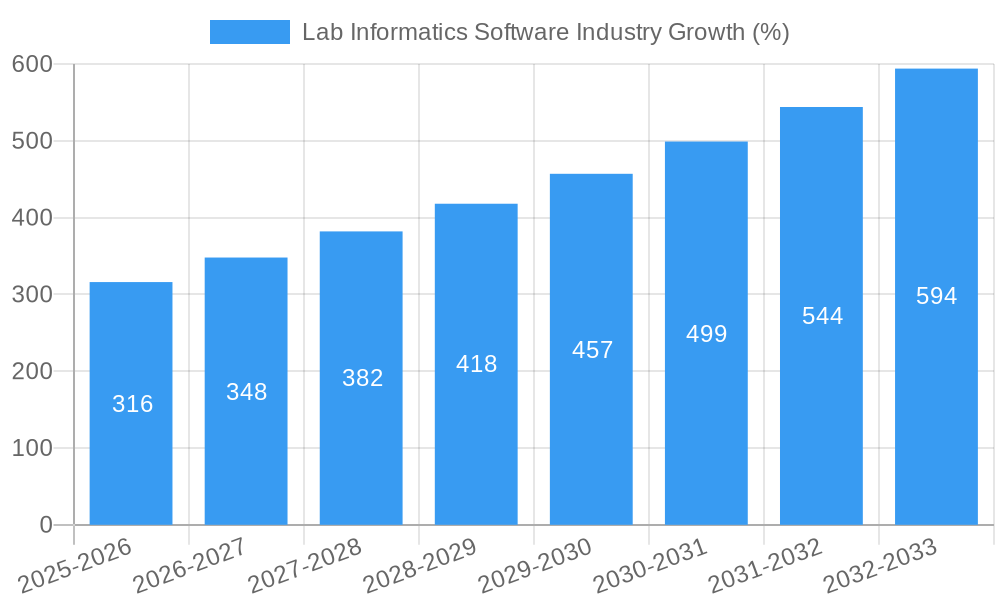
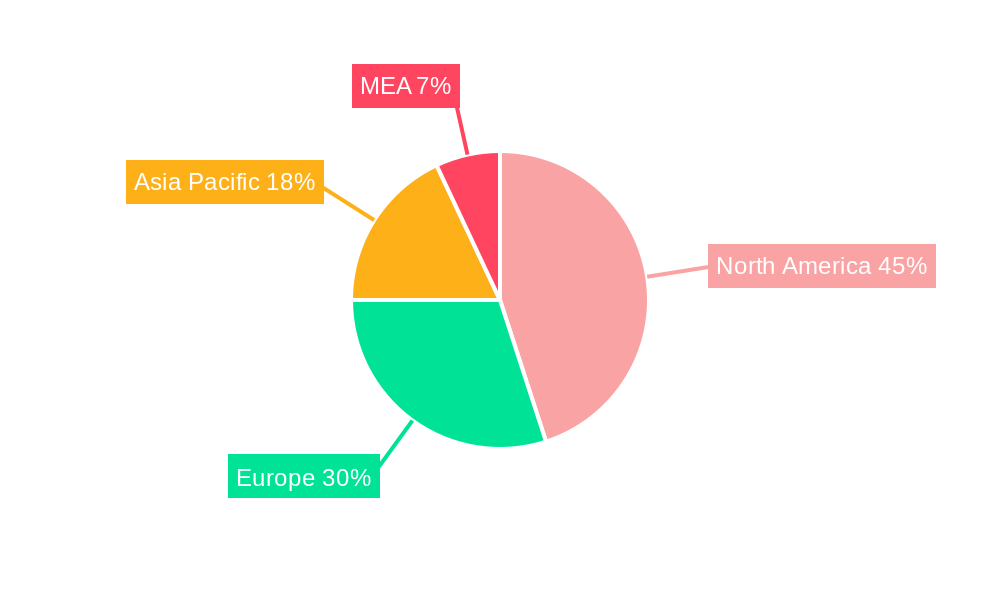
The Lab Informatics Software market is experiencing robust growth, projected to reach \$3.82 billion in 2025 and exhibiting a Compound Annual Growth Rate (CAGR) of 8.31% from 2025 to 2033. This expansion is driven by several key factors. The increasing need for efficient data management and analysis within laboratories across diverse sectors, including pharmaceuticals, biotechnology, and healthcare, fuels demand for sophisticated software solutions. Automation of laboratory workflows, enhanced data security and compliance with stringent regulatory requirements (like FDA 21 CFR Part 11) are also significant drivers. Growing adoption of cloud-based solutions offers scalability and cost-effectiveness, further accelerating market growth. The market is segmented by product (LIMS, ELN, ECM, LES, CDS, SDMS, EDC, CDMS), component (software and services), and delivery mode (on-premise, web-hosted, and cloud-based). The cloud-based segment is witnessing the fastest growth due to its flexibility and accessibility. North America currently holds a significant market share, owing to the presence of established players and advanced research infrastructure. However, the Asia-Pacific region is anticipated to show substantial growth in the coming years driven by increasing R&D investments and expanding healthcare infrastructure. Competition in the market is intense, with established players like Thermo Fisher Scientific, Agilent Technologies, and Waters Corporation competing alongside specialized providers like LabWare and LabVantage. Future growth will likely be influenced by advancements in artificial intelligence (AI) and machine learning (ML) integration within lab informatics software, enabling more advanced data analysis and predictive capabilities.
The competitive landscape is expected to remain dynamic, with ongoing mergers, acquisitions, and strategic partnerships shaping the market structure. Companies are focusing on enhancing their product portfolios through technological innovations and expanding their geographic reach to capitalize on emerging opportunities. The increasing adoption of integrated solutions that seamlessly connect different laboratory instruments and systems will be a crucial factor influencing future market dynamics. Furthermore, the growing demand for data integration and interoperability across different platforms will drive the development of more robust and user-friendly software solutions. The continued focus on improving data security and compliance with industry regulations will also play a crucial role in shaping the future trajectory of the Lab Informatics Software market. The long-term outlook for the market remains positive, driven by ongoing technological advancements and the rising demand for efficient and reliable laboratory data management solutions across various industries.
This comprehensive report provides an in-depth analysis of the Lab Informatics Software market, encompassing market dynamics, growth trends, regional segmentation, product landscape, key players, and future outlook. The study period spans 2019-2033, with 2025 serving as the base and estimated year. The forecast period covers 2025-2033, and the historical period encompasses 2019-2024. The market is segmented by product (LIMS, ELN, ECM, LES, CDS, SDMS, EDC, CDMS), component (Software, Services), and delivery mode (On-premise, Web-hosted, Cloud-based). The total market size is projected to reach xx Million by 2033.
Lab Informatics Software Industry Market Dynamics & Structure
The Lab Informatics Software market is characterized by a moderately concentrated landscape with key players holding significant market share. Technological innovation, particularly in AI and cloud computing, is a major driver, while regulatory compliance (e.g., FDA 21 CFR Part 11) and data security concerns heavily influence market dynamics. Competitive substitution primarily comes from legacy systems and manual processes. The end-user base spans diverse sectors, including pharmaceutical, biotechnology, healthcare, and academic research.
- Market Concentration: The top 5 players hold an estimated xx% market share in 2025.
- Innovation Drivers: AI-powered data analysis, cloud-based solutions, and improved data interoperability.
- Regulatory Framework: Stringent data security and compliance regulations (e.g., HIPAA, GDPR) drive adoption of compliant software.
- Competitive Substitutes: Manual data management, legacy systems represent a key challenge to market growth.
- M&A Trends: The past five years have seen xx M&A deals, primarily focused on expanding product portfolios and geographical reach.
- End-User Demographics: Pharmaceutical and biotech companies represent the largest segment, accounting for xx% of the market in 2025.
Lab Informatics Software Industry Growth Trends & Insights
The Lab Informatics Software market is experiencing robust growth, driven by increasing demand for efficient data management, automation, and regulatory compliance. The global market size reached xx Million in 2024 and is projected to reach xx Million in 2025, exhibiting a CAGR of xx% during the historical period. This growth is fueled by the rising adoption of cloud-based solutions, increasing R&D spending in various industries, and the growing need for enhanced data security and collaboration tools. Technological disruptions, such as the increasing adoption of AI and machine learning in data analysis, further accelerate market growth. Consumer behavior shifts towards more data-driven decision-making also contribute significantly. Market penetration for LIMS is estimated at xx% in 2025, expected to rise to xx% by 2033.
Dominant Regions, Countries, or Segments in Lab Informatics Software Industry
North America currently dominates the Lab Informatics Software market, driven by strong R&D spending, early adoption of advanced technologies, and a well-established regulatory framework. Europe follows closely, while Asia-Pacific is experiencing rapid growth due to increasing investments in healthcare infrastructure and technological advancements.
- By Product: LIMS remains the largest segment, holding xx% of the market in 2025. ELN and SDMS are also exhibiting significant growth, driven by rising demand for efficient data management and regulatory compliance.
- By Component: The Software segment dominates, accounting for xx% of the market share in 2025, owing to the increasing prevalence of software-based solutions for laboratory operations.
- By Delivery Mode: Cloud-based solutions are experiencing rapid growth, with an expected market share of xx% in 2025. This is driven by its scalability, cost-effectiveness, and enhanced accessibility.
Key Drivers:
- Strong government support for R&D in key regions.
- Growing adoption of advanced technologies such as AI and machine learning.
- Increasing demand for enhanced data security and regulatory compliance.
Lab Informatics Software Industry Product Landscape
The Lab Informatics Software market offers a diverse range of products, including LIMS, ELN, and SDMS, each with unique features and functionalities. Recent innovations focus on improved data integration, advanced analytics capabilities, and enhanced user interfaces to simplify data management and analysis. The integration of AI and machine learning is a notable trend, enabling automated data analysis and predictive modeling. Key selling propositions include improved efficiency, enhanced data security, and regulatory compliance capabilities.
Key Drivers, Barriers & Challenges in Lab Informatics Software Industry
Key Drivers: Increasing demand for automated data management, rising R&D spending, and stringent regulatory requirements are key drivers. The integration of AI and machine learning is revolutionizing data analysis and providing actionable insights. Cloud-based solutions offer scalability and cost-effectiveness.
Key Challenges: High implementation costs, data security concerns, and integration complexities with existing systems pose challenges. Lack of skilled professionals and resistance to adopting new technologies further hinder market growth. The impact of these challenges is estimated to reduce market growth by approximately xx% in the forecast period.
Emerging Opportunities in Lab Informatics Software Industry
Untapped markets in developing economies, particularly in Asia-Pacific and Latin America, present significant growth opportunities. The increasing adoption of personalized medicine and precision diagnostics is creating demand for specialized software solutions. Integration with IoT devices and wearables opens up new avenues for data collection and analysis.
Growth Accelerators in the Lab Informatics Software Industry
Technological breakthroughs in AI, cloud computing, and data analytics are expected to accelerate market growth significantly. Strategic partnerships between software vendors and laboratory equipment manufacturers are strengthening market penetration. The expansion into new geographical markets and diversification into new industry verticals will further drive long-term growth.
Key Players Shaping the Lab Informatics Software Market
- Khemia Software
- Waters Corporation
- Thermo Fisher Scientific Inc
- LabWare Inc
- Cerner Corporation
- Abbott Laboratories (Abbott Informatics Corporation)
- PerkinElmer Inc
- LabVantage Solutions Inc
- McKesson Corporation
- Agilent Technologies
- LabLynx Inc
Notable Milestones in Lab Informatics Software Industry Sector
- August 2021: CTI Clinical Trial and Consulting Services partnered with LabWare, Inc. to expand laboratory services for rare disease and cell & gene therapy research.
- March 2021: LabVantage Solutions, Inc. launched LabVantage Analytics, a self-service advanced analytics solution for LIMS data.
In-Depth Lab Informatics Software Industry Market Outlook
The Lab Informatics Software market is poised for continued strong growth, driven by technological advancements, increasing regulatory pressures, and the expanding adoption of digital technologies in various industries. Strategic partnerships, product innovations, and expansion into emerging markets will create significant opportunities for market players. The market is predicted to reach xx Million by 2033, presenting lucrative prospects for both established players and new entrants.
Lab Informatics Software Industry Segmentation
-
1. Product
- 1.1. Laboratory Information Management System (LIMS)
- 1.2. Electronic Lab Notebooks (ELN)
- 1.3. Enterprise Content Management (ECM)
- 1.4. Laboratory Execution System (LES)
- 1.5. Chromatography Data System (CDS)
- 1.6. Scientific Data Management System (SDMS)
- 1.7. Electron
-
2. Component
- 2.1. Services
- 2.2. Software
-
3. Delivery Mode
- 3.1. On-premise
- 3.2. Web-hosted
- 3.3. Cloud-based
Lab Informatics Software Industry Segmentation By Geography
-
1. North America
- 1.1. United States
- 1.2. Canada
- 1.3. Mexico
-
2. Europe
- 2.1. Germany
- 2.2. United Kingdom
- 2.3. France
- 2.4. Italy
- 2.5. Spain
- 2.6. Rest of Europe
-
3. Asia Pacific
- 3.1. China
- 3.2. Japan
- 3.3. India
- 3.4. Australia
- 3.5. South Korea
- 3.6. Rest of Asia Pacific
-
4. Middle East and Africa
- 4.1. GCC
- 4.2. South Africa
- 4.3. Rest of Middle East and Africa
-
5. South America
- 5.1. Brazil
- 5.2. Argentina
- 5.3. Rest of South America
Lab Informatics Software Industry REPORT HIGHLIGHTS
| Aspects | Details |
|---|---|
| Study Period | 2019-2033 |
| Base Year | 2024 |
| Estimated Year | 2025 |
| Forecast Period | 2025-2033 |
| Historical Period | 2019-2024 |
| Growth Rate | CAGR of 8.31% from 2019-2033 |
| Segmentation |
|
Table of Contents
- 1. Introduction
- 1.1. Research Scope
- 1.2. Market Segmentation
- 1.3. Research Methodology
- 1.4. Definitions and Assumptions
- 2. Executive Summary
- 2.1. Introduction
- 3. Market Dynamics
- 3.1. Introduction
- 3.2. Market Drivers
- 3.2.1. High Accuracy and Efficiency of Results; Increasing Applications of Lab Informatics Solutions; Increasing Number of Diagnoses
- 3.3. Market Restrains
- 3.3.1. Lack of Integration Standards for Laboratory Informatics; Lack of Skilled Professionals
- 3.4. Market Trends
- 3.4.1. Laboratory Information Management System is Expected to Hold its Highest Market Share in the Product
- 4. Market Factor Analysis
- 4.1. Porters Five Forces
- 4.2. Supply/Value Chain
- 4.3. PESTEL analysis
- 4.4. Market Entropy
- 4.5. Patent/Trademark Analysis
- 5. Global Lab Informatics Software Industry Analysis, Insights and Forecast, 2019-2031
- 5.1. Market Analysis, Insights and Forecast - by Product
- 5.1.1. Laboratory Information Management System (LIMS)
- 5.1.2. Electronic Lab Notebooks (ELN)
- 5.1.3. Enterprise Content Management (ECM)
- 5.1.4. Laboratory Execution System (LES)
- 5.1.5. Chromatography Data System (CDS)
- 5.1.6. Scientific Data Management System (SDMS)
- 5.1.7. Electron
- 5.2. Market Analysis, Insights and Forecast - by Component
- 5.2.1. Services
- 5.2.2. Software
- 5.3. Market Analysis, Insights and Forecast - by Delivery Mode
- 5.3.1. On-premise
- 5.3.2. Web-hosted
- 5.3.3. Cloud-based
- 5.4. Market Analysis, Insights and Forecast - by Region
- 5.4.1. North America
- 5.4.2. Europe
- 5.4.3. Asia Pacific
- 5.4.4. Middle East and Africa
- 5.4.5. South America
- 5.1. Market Analysis, Insights and Forecast - by Product
- 6. North America Lab Informatics Software Industry Analysis, Insights and Forecast, 2019-2031
- 6.1. Market Analysis, Insights and Forecast - by Product
- 6.1.1. Laboratory Information Management System (LIMS)
- 6.1.2. Electronic Lab Notebooks (ELN)
- 6.1.3. Enterprise Content Management (ECM)
- 6.1.4. Laboratory Execution System (LES)
- 6.1.5. Chromatography Data System (CDS)
- 6.1.6. Scientific Data Management System (SDMS)
- 6.1.7. Electron
- 6.2. Market Analysis, Insights and Forecast - by Component
- 6.2.1. Services
- 6.2.2. Software
- 6.3. Market Analysis, Insights and Forecast - by Delivery Mode
- 6.3.1. On-premise
- 6.3.2. Web-hosted
- 6.3.3. Cloud-based
- 6.1. Market Analysis, Insights and Forecast - by Product
- 7. Europe Lab Informatics Software Industry Analysis, Insights and Forecast, 2019-2031
- 7.1. Market Analysis, Insights and Forecast - by Product
- 7.1.1. Laboratory Information Management System (LIMS)
- 7.1.2. Electronic Lab Notebooks (ELN)
- 7.1.3. Enterprise Content Management (ECM)
- 7.1.4. Laboratory Execution System (LES)
- 7.1.5. Chromatography Data System (CDS)
- 7.1.6. Scientific Data Management System (SDMS)
- 7.1.7. Electron
- 7.2. Market Analysis, Insights and Forecast - by Component
- 7.2.1. Services
- 7.2.2. Software
- 7.3. Market Analysis, Insights and Forecast - by Delivery Mode
- 7.3.1. On-premise
- 7.3.2. Web-hosted
- 7.3.3. Cloud-based
- 7.1. Market Analysis, Insights and Forecast - by Product
- 8. Asia Pacific Lab Informatics Software Industry Analysis, Insights and Forecast, 2019-2031
- 8.1. Market Analysis, Insights and Forecast - by Product
- 8.1.1. Laboratory Information Management System (LIMS)
- 8.1.2. Electronic Lab Notebooks (ELN)
- 8.1.3. Enterprise Content Management (ECM)
- 8.1.4. Laboratory Execution System (LES)
- 8.1.5. Chromatography Data System (CDS)
- 8.1.6. Scientific Data Management System (SDMS)
- 8.1.7. Electron
- 8.2. Market Analysis, Insights and Forecast - by Component
- 8.2.1. Services
- 8.2.2. Software
- 8.3. Market Analysis, Insights and Forecast - by Delivery Mode
- 8.3.1. On-premise
- 8.3.2. Web-hosted
- 8.3.3. Cloud-based
- 8.1. Market Analysis, Insights and Forecast - by Product
- 9. Middle East and Africa Lab Informatics Software Industry Analysis, Insights and Forecast, 2019-2031
- 9.1. Market Analysis, Insights and Forecast - by Product
- 9.1.1. Laboratory Information Management System (LIMS)
- 9.1.2. Electronic Lab Notebooks (ELN)
- 9.1.3. Enterprise Content Management (ECM)
- 9.1.4. Laboratory Execution System (LES)
- 9.1.5. Chromatography Data System (CDS)
- 9.1.6. Scientific Data Management System (SDMS)
- 9.1.7. Electron
- 9.2. Market Analysis, Insights and Forecast - by Component
- 9.2.1. Services
- 9.2.2. Software
- 9.3. Market Analysis, Insights and Forecast - by Delivery Mode
- 9.3.1. On-premise
- 9.3.2. Web-hosted
- 9.3.3. Cloud-based
- 9.1. Market Analysis, Insights and Forecast - by Product
- 10. South America Lab Informatics Software Industry Analysis, Insights and Forecast, 2019-2031
- 10.1. Market Analysis, Insights and Forecast - by Product
- 10.1.1. Laboratory Information Management System (LIMS)
- 10.1.2. Electronic Lab Notebooks (ELN)
- 10.1.3. Enterprise Content Management (ECM)
- 10.1.4. Laboratory Execution System (LES)
- 10.1.5. Chromatography Data System (CDS)
- 10.1.6. Scientific Data Management System (SDMS)
- 10.1.7. Electron
- 10.2. Market Analysis, Insights and Forecast - by Component
- 10.2.1. Services
- 10.2.2. Software
- 10.3. Market Analysis, Insights and Forecast - by Delivery Mode
- 10.3.1. On-premise
- 10.3.2. Web-hosted
- 10.3.3. Cloud-based
- 10.1. Market Analysis, Insights and Forecast - by Product
- 11. North Americ Lab Informatics Software Industry Analysis, Insights and Forecast, 2019-2031
- 11.1. Market Analysis, Insights and Forecast - By Country/Sub-region
- 11.1.1 United States
- 11.1.2 Canada
- 11.1.3 Mexico
- 12. South America Lab Informatics Software Industry Analysis, Insights and Forecast, 2019-2031
- 12.1. Market Analysis, Insights and Forecast - By Country/Sub-region
- 12.1.1 Brazil
- 12.1.2 Mexico
- 12.1.3 Rest of South America
- 13. Europe Lab Informatics Software Industry Analysis, Insights and Forecast, 2019-2031
- 13.1. Market Analysis, Insights and Forecast - By Country/Sub-region
- 13.1.1 Germany
- 13.1.2 United Kingdom
- 13.1.3 France
- 13.1.4 Italy
- 13.1.5 Spain
- 13.1.6 Rest of Europe
- 14. Asia Pacific Lab Informatics Software Industry Analysis, Insights and Forecast, 2019-2031
- 14.1. Market Analysis, Insights and Forecast - By Country/Sub-region
- 14.1.1 China
- 14.1.2 Japan
- 14.1.3 India
- 14.1.4 South Korea
- 14.1.5 Taiwan
- 14.1.6 Australia
- 14.1.7 Rest of Asia-Pacific
- 15. MEA Lab Informatics Software Industry Analysis, Insights and Forecast, 2019-2031
- 15.1. Market Analysis, Insights and Forecast - By Country/Sub-region
- 15.1.1 Middle East
- 15.1.2 Africa
- 16. Competitive Analysis
- 16.1. Global Market Share Analysis 2024
- 16.2. Company Profiles
- 16.2.1 Khemia Software*List Not Exhaustive
- 16.2.1.1. Overview
- 16.2.1.2. Products
- 16.2.1.3. SWOT Analysis
- 16.2.1.4. Recent Developments
- 16.2.1.5. Financials (Based on Availability)
- 16.2.2 Waters Corporation
- 16.2.2.1. Overview
- 16.2.2.2. Products
- 16.2.2.3. SWOT Analysis
- 16.2.2.4. Recent Developments
- 16.2.2.5. Financials (Based on Availability)
- 16.2.3 Thermo Fisher Scientific Inc
- 16.2.3.1. Overview
- 16.2.3.2. Products
- 16.2.3.3. SWOT Analysis
- 16.2.3.4. Recent Developments
- 16.2.3.5. Financials (Based on Availability)
- 16.2.4 LabWare Inc
- 16.2.4.1. Overview
- 16.2.4.2. Products
- 16.2.4.3. SWOT Analysis
- 16.2.4.4. Recent Developments
- 16.2.4.5. Financials (Based on Availability)
- 16.2.5 Cerner Corporation
- 16.2.5.1. Overview
- 16.2.5.2. Products
- 16.2.5.3. SWOT Analysis
- 16.2.5.4. Recent Developments
- 16.2.5.5. Financials (Based on Availability)
- 16.2.6 Abbott Laboratories (Abbott Informatics Corporation)
- 16.2.6.1. Overview
- 16.2.6.2. Products
- 16.2.6.3. SWOT Analysis
- 16.2.6.4. Recent Developments
- 16.2.6.5. Financials (Based on Availability)
- 16.2.7 PerkinElmer Inc
- 16.2.7.1. Overview
- 16.2.7.2. Products
- 16.2.7.3. SWOT Analysis
- 16.2.7.4. Recent Developments
- 16.2.7.5. Financials (Based on Availability)
- 16.2.8 LabVantage Solutions Inc
- 16.2.8.1. Overview
- 16.2.8.2. Products
- 16.2.8.3. SWOT Analysis
- 16.2.8.4. Recent Developments
- 16.2.8.5. Financials (Based on Availability)
- 16.2.9 McKesson Corporation
- 16.2.9.1. Overview
- 16.2.9.2. Products
- 16.2.9.3. SWOT Analysis
- 16.2.9.4. Recent Developments
- 16.2.9.5. Financials (Based on Availability)
- 16.2.10 Agilent Technologies
- 16.2.10.1. Overview
- 16.2.10.2. Products
- 16.2.10.3. SWOT Analysis
- 16.2.10.4. Recent Developments
- 16.2.10.5. Financials (Based on Availability)
- 16.2.11 LabLynx Inc
- 16.2.11.1. Overview
- 16.2.11.2. Products
- 16.2.11.3. SWOT Analysis
- 16.2.11.4. Recent Developments
- 16.2.11.5. Financials (Based on Availability)
- 16.2.1 Khemia Software*List Not Exhaustive
List of Figures
- Figure 1: Global Lab Informatics Software Industry Revenue Breakdown (Million, %) by Region 2024 & 2032
- Figure 2: North Americ Lab Informatics Software Industry Revenue (Million), by Country 2024 & 2032
- Figure 3: North Americ Lab Informatics Software Industry Revenue Share (%), by Country 2024 & 2032
- Figure 4: South America Lab Informatics Software Industry Revenue (Million), by Country 2024 & 2032
- Figure 5: South America Lab Informatics Software Industry Revenue Share (%), by Country 2024 & 2032
- Figure 6: Europe Lab Informatics Software Industry Revenue (Million), by Country 2024 & 2032
- Figure 7: Europe Lab Informatics Software Industry Revenue Share (%), by Country 2024 & 2032
- Figure 8: Asia Pacific Lab Informatics Software Industry Revenue (Million), by Country 2024 & 2032
- Figure 9: Asia Pacific Lab Informatics Software Industry Revenue Share (%), by Country 2024 & 2032
- Figure 10: MEA Lab Informatics Software Industry Revenue (Million), by Country 2024 & 2032
- Figure 11: MEA Lab Informatics Software Industry Revenue Share (%), by Country 2024 & 2032
- Figure 12: North America Lab Informatics Software Industry Revenue (Million), by Product 2024 & 2032
- Figure 13: North America Lab Informatics Software Industry Revenue Share (%), by Product 2024 & 2032
- Figure 14: North America Lab Informatics Software Industry Revenue (Million), by Component 2024 & 2032
- Figure 15: North America Lab Informatics Software Industry Revenue Share (%), by Component 2024 & 2032
- Figure 16: North America Lab Informatics Software Industry Revenue (Million), by Delivery Mode 2024 & 2032
- Figure 17: North America Lab Informatics Software Industry Revenue Share (%), by Delivery Mode 2024 & 2032
- Figure 18: North America Lab Informatics Software Industry Revenue (Million), by Country 2024 & 2032
- Figure 19: North America Lab Informatics Software Industry Revenue Share (%), by Country 2024 & 2032
- Figure 20: Europe Lab Informatics Software Industry Revenue (Million), by Product 2024 & 2032
- Figure 21: Europe Lab Informatics Software Industry Revenue Share (%), by Product 2024 & 2032
- Figure 22: Europe Lab Informatics Software Industry Revenue (Million), by Component 2024 & 2032
- Figure 23: Europe Lab Informatics Software Industry Revenue Share (%), by Component 2024 & 2032
- Figure 24: Europe Lab Informatics Software Industry Revenue (Million), by Delivery Mode 2024 & 2032
- Figure 25: Europe Lab Informatics Software Industry Revenue Share (%), by Delivery Mode 2024 & 2032
- Figure 26: Europe Lab Informatics Software Industry Revenue (Million), by Country 2024 & 2032
- Figure 27: Europe Lab Informatics Software Industry Revenue Share (%), by Country 2024 & 2032
- Figure 28: Asia Pacific Lab Informatics Software Industry Revenue (Million), by Product 2024 & 2032
- Figure 29: Asia Pacific Lab Informatics Software Industry Revenue Share (%), by Product 2024 & 2032
- Figure 30: Asia Pacific Lab Informatics Software Industry Revenue (Million), by Component 2024 & 2032
- Figure 31: Asia Pacific Lab Informatics Software Industry Revenue Share (%), by Component 2024 & 2032
- Figure 32: Asia Pacific Lab Informatics Software Industry Revenue (Million), by Delivery Mode 2024 & 2032
- Figure 33: Asia Pacific Lab Informatics Software Industry Revenue Share (%), by Delivery Mode 2024 & 2032
- Figure 34: Asia Pacific Lab Informatics Software Industry Revenue (Million), by Country 2024 & 2032
- Figure 35: Asia Pacific Lab Informatics Software Industry Revenue Share (%), by Country 2024 & 2032
- Figure 36: Middle East and Africa Lab Informatics Software Industry Revenue (Million), by Product 2024 & 2032
- Figure 37: Middle East and Africa Lab Informatics Software Industry Revenue Share (%), by Product 2024 & 2032
- Figure 38: Middle East and Africa Lab Informatics Software Industry Revenue (Million), by Component 2024 & 2032
- Figure 39: Middle East and Africa Lab Informatics Software Industry Revenue Share (%), by Component 2024 & 2032
- Figure 40: Middle East and Africa Lab Informatics Software Industry Revenue (Million), by Delivery Mode 2024 & 2032
- Figure 41: Middle East and Africa Lab Informatics Software Industry Revenue Share (%), by Delivery Mode 2024 & 2032
- Figure 42: Middle East and Africa Lab Informatics Software Industry Revenue (Million), by Country 2024 & 2032
- Figure 43: Middle East and Africa Lab Informatics Software Industry Revenue Share (%), by Country 2024 & 2032
- Figure 44: South America Lab Informatics Software Industry Revenue (Million), by Product 2024 & 2032
- Figure 45: South America Lab Informatics Software Industry Revenue Share (%), by Product 2024 & 2032
- Figure 46: South America Lab Informatics Software Industry Revenue (Million), by Component 2024 & 2032
- Figure 47: South America Lab Informatics Software Industry Revenue Share (%), by Component 2024 & 2032
- Figure 48: South America Lab Informatics Software Industry Revenue (Million), by Delivery Mode 2024 & 2032
- Figure 49: South America Lab Informatics Software Industry Revenue Share (%), by Delivery Mode 2024 & 2032
- Figure 50: South America Lab Informatics Software Industry Revenue (Million), by Country 2024 & 2032
- Figure 51: South America Lab Informatics Software Industry Revenue Share (%), by Country 2024 & 2032
List of Tables
- Table 1: Global Lab Informatics Software Industry Revenue Million Forecast, by Region 2019 & 2032
- Table 2: Global Lab Informatics Software Industry Revenue Million Forecast, by Product 2019 & 2032
- Table 3: Global Lab Informatics Software Industry Revenue Million Forecast, by Component 2019 & 2032
- Table 4: Global Lab Informatics Software Industry Revenue Million Forecast, by Delivery Mode 2019 & 2032
- Table 5: Global Lab Informatics Software Industry Revenue Million Forecast, by Region 2019 & 2032
- Table 6: Global Lab Informatics Software Industry Revenue Million Forecast, by Country 2019 & 2032
- Table 7: United States Lab Informatics Software Industry Revenue (Million) Forecast, by Application 2019 & 2032
- Table 8: Canada Lab Informatics Software Industry Revenue (Million) Forecast, by Application 2019 & 2032
- Table 9: Mexico Lab Informatics Software Industry Revenue (Million) Forecast, by Application 2019 & 2032
- Table 10: Global Lab Informatics Software Industry Revenue Million Forecast, by Country 2019 & 2032
- Table 11: Brazil Lab Informatics Software Industry Revenue (Million) Forecast, by Application 2019 & 2032
- Table 12: Mexico Lab Informatics Software Industry Revenue (Million) Forecast, by Application 2019 & 2032
- Table 13: Rest of South America Lab Informatics Software Industry Revenue (Million) Forecast, by Application 2019 & 2032
- Table 14: Global Lab Informatics Software Industry Revenue Million Forecast, by Country 2019 & 2032
- Table 15: Germany Lab Informatics Software Industry Revenue (Million) Forecast, by Application 2019 & 2032
- Table 16: United Kingdom Lab Informatics Software Industry Revenue (Million) Forecast, by Application 2019 & 2032
- Table 17: France Lab Informatics Software Industry Revenue (Million) Forecast, by Application 2019 & 2032
- Table 18: Italy Lab Informatics Software Industry Revenue (Million) Forecast, by Application 2019 & 2032
- Table 19: Spain Lab Informatics Software Industry Revenue (Million) Forecast, by Application 2019 & 2032
- Table 20: Rest of Europe Lab Informatics Software Industry Revenue (Million) Forecast, by Application 2019 & 2032
- Table 21: Global Lab Informatics Software Industry Revenue Million Forecast, by Country 2019 & 2032
- Table 22: China Lab Informatics Software Industry Revenue (Million) Forecast, by Application 2019 & 2032
- Table 23: Japan Lab Informatics Software Industry Revenue (Million) Forecast, by Application 2019 & 2032
- Table 24: India Lab Informatics Software Industry Revenue (Million) Forecast, by Application 2019 & 2032
- Table 25: South Korea Lab Informatics Software Industry Revenue (Million) Forecast, by Application 2019 & 2032
- Table 26: Taiwan Lab Informatics Software Industry Revenue (Million) Forecast, by Application 2019 & 2032
- Table 27: Australia Lab Informatics Software Industry Revenue (Million) Forecast, by Application 2019 & 2032
- Table 28: Rest of Asia-Pacific Lab Informatics Software Industry Revenue (Million) Forecast, by Application 2019 & 2032
- Table 29: Global Lab Informatics Software Industry Revenue Million Forecast, by Country 2019 & 2032
- Table 30: Middle East Lab Informatics Software Industry Revenue (Million) Forecast, by Application 2019 & 2032
- Table 31: Africa Lab Informatics Software Industry Revenue (Million) Forecast, by Application 2019 & 2032
- Table 32: Global Lab Informatics Software Industry Revenue Million Forecast, by Product 2019 & 2032
- Table 33: Global Lab Informatics Software Industry Revenue Million Forecast, by Component 2019 & 2032
- Table 34: Global Lab Informatics Software Industry Revenue Million Forecast, by Delivery Mode 2019 & 2032
- Table 35: Global Lab Informatics Software Industry Revenue Million Forecast, by Country 2019 & 2032
- Table 36: United States Lab Informatics Software Industry Revenue (Million) Forecast, by Application 2019 & 2032
- Table 37: Canada Lab Informatics Software Industry Revenue (Million) Forecast, by Application 2019 & 2032
- Table 38: Mexico Lab Informatics Software Industry Revenue (Million) Forecast, by Application 2019 & 2032
- Table 39: Global Lab Informatics Software Industry Revenue Million Forecast, by Product 2019 & 2032
- Table 40: Global Lab Informatics Software Industry Revenue Million Forecast, by Component 2019 & 2032
- Table 41: Global Lab Informatics Software Industry Revenue Million Forecast, by Delivery Mode 2019 & 2032
- Table 42: Global Lab Informatics Software Industry Revenue Million Forecast, by Country 2019 & 2032
- Table 43: Germany Lab Informatics Software Industry Revenue (Million) Forecast, by Application 2019 & 2032
- Table 44: United Kingdom Lab Informatics Software Industry Revenue (Million) Forecast, by Application 2019 & 2032
- Table 45: France Lab Informatics Software Industry Revenue (Million) Forecast, by Application 2019 & 2032
- Table 46: Italy Lab Informatics Software Industry Revenue (Million) Forecast, by Application 2019 & 2032
- Table 47: Spain Lab Informatics Software Industry Revenue (Million) Forecast, by Application 2019 & 2032
- Table 48: Rest of Europe Lab Informatics Software Industry Revenue (Million) Forecast, by Application 2019 & 2032
- Table 49: Global Lab Informatics Software Industry Revenue Million Forecast, by Product 2019 & 2032
- Table 50: Global Lab Informatics Software Industry Revenue Million Forecast, by Component 2019 & 2032
- Table 51: Global Lab Informatics Software Industry Revenue Million Forecast, by Delivery Mode 2019 & 2032
- Table 52: Global Lab Informatics Software Industry Revenue Million Forecast, by Country 2019 & 2032
- Table 53: China Lab Informatics Software Industry Revenue (Million) Forecast, by Application 2019 & 2032
- Table 54: Japan Lab Informatics Software Industry Revenue (Million) Forecast, by Application 2019 & 2032
- Table 55: India Lab Informatics Software Industry Revenue (Million) Forecast, by Application 2019 & 2032
- Table 56: Australia Lab Informatics Software Industry Revenue (Million) Forecast, by Application 2019 & 2032
- Table 57: South Korea Lab Informatics Software Industry Revenue (Million) Forecast, by Application 2019 & 2032
- Table 58: Rest of Asia Pacific Lab Informatics Software Industry Revenue (Million) Forecast, by Application 2019 & 2032
- Table 59: Global Lab Informatics Software Industry Revenue Million Forecast, by Product 2019 & 2032
- Table 60: Global Lab Informatics Software Industry Revenue Million Forecast, by Component 2019 & 2032
- Table 61: Global Lab Informatics Software Industry Revenue Million Forecast, by Delivery Mode 2019 & 2032
- Table 62: Global Lab Informatics Software Industry Revenue Million Forecast, by Country 2019 & 2032
- Table 63: GCC Lab Informatics Software Industry Revenue (Million) Forecast, by Application 2019 & 2032
- Table 64: South Africa Lab Informatics Software Industry Revenue (Million) Forecast, by Application 2019 & 2032
- Table 65: Rest of Middle East and Africa Lab Informatics Software Industry Revenue (Million) Forecast, by Application 2019 & 2032
- Table 66: Global Lab Informatics Software Industry Revenue Million Forecast, by Product 2019 & 2032
- Table 67: Global Lab Informatics Software Industry Revenue Million Forecast, by Component 2019 & 2032
- Table 68: Global Lab Informatics Software Industry Revenue Million Forecast, by Delivery Mode 2019 & 2032
- Table 69: Global Lab Informatics Software Industry Revenue Million Forecast, by Country 2019 & 2032
- Table 70: Brazil Lab Informatics Software Industry Revenue (Million) Forecast, by Application 2019 & 2032
- Table 71: Argentina Lab Informatics Software Industry Revenue (Million) Forecast, by Application 2019 & 2032
- Table 72: Rest of South America Lab Informatics Software Industry Revenue (Million) Forecast, by Application 2019 & 2032
Frequently Asked Questions
1. What is the projected Compound Annual Growth Rate (CAGR) of the Lab Informatics Software Industry?
The projected CAGR is approximately 8.31%.
2. Which companies are prominent players in the Lab Informatics Software Industry?
Key companies in the market include Khemia Software*List Not Exhaustive, Waters Corporation, Thermo Fisher Scientific Inc, LabWare Inc, Cerner Corporation, Abbott Laboratories (Abbott Informatics Corporation), PerkinElmer Inc, LabVantage Solutions Inc, McKesson Corporation, Agilent Technologies, LabLynx Inc.
3. What are the main segments of the Lab Informatics Software Industry?
The market segments include Product, Component, Delivery Mode.
4. Can you provide details about the market size?
The market size is estimated to be USD 3.82 Million as of 2022.
5. What are some drivers contributing to market growth?
High Accuracy and Efficiency of Results; Increasing Applications of Lab Informatics Solutions; Increasing Number of Diagnoses.
6. What are the notable trends driving market growth?
Laboratory Information Management System is Expected to Hold its Highest Market Share in the Product.
7. Are there any restraints impacting market growth?
Lack of Integration Standards for Laboratory Informatics; Lack of Skilled Professionals.
8. Can you provide examples of recent developments in the market?
In August 2021, CTI Clinical Trial and Consulting Services (CTI) entered into a partnership with LabWare, Inc. to expand laboratory services to support rare disease and cell & gene therapy research across all regions of the world.
9. What pricing options are available for accessing the report?
Pricing options include single-user, multi-user, and enterprise licenses priced at USD 4750, USD 5250, and USD 8750 respectively.
10. Is the market size provided in terms of value or volume?
The market size is provided in terms of value, measured in Million.
11. Are there any specific market keywords associated with the report?
Yes, the market keyword associated with the report is "Lab Informatics Software Industry," which aids in identifying and referencing the specific market segment covered.
12. How do I determine which pricing option suits my needs best?
The pricing options vary based on user requirements and access needs. Individual users may opt for single-user licenses, while businesses requiring broader access may choose multi-user or enterprise licenses for cost-effective access to the report.
13. Are there any additional resources or data provided in the Lab Informatics Software Industry report?
While the report offers comprehensive insights, it's advisable to review the specific contents or supplementary materials provided to ascertain if additional resources or data are available.
14. How can I stay updated on further developments or reports in the Lab Informatics Software Industry?
To stay informed about further developments, trends, and reports in the Lab Informatics Software Industry, consider subscribing to industry newsletters, following relevant companies and organizations, or regularly checking reputable industry news sources and publications.
Methodology
Step 1 - Identification of Relevant Samples Size from Population Database


Step 2 - Approaches for Defining Global Market Size (Value, Volume* & Price*)

Note*: In applicable scenarios
Step 3 - Data Sources
Primary Research
- Web Analytics
- Survey Reports
- Research Institute
- Latest Research Reports
- Opinion Leaders
Secondary Research
- Annual Reports
- White Paper
- Latest Press Release
- Industry Association
- Paid Database
- Investor Presentations

Step 4 - Data Triangulation
Involves using different sources of information in order to increase the validity of a study
These sources are likely to be stakeholders in a program - participants, other researchers, program staff, other community members, and so on.
Then we put all data in single framework & apply various statistical tools to find out the dynamic on the market.
During the analysis stage, feedback from the stakeholder groups would be compared to determine areas of agreement as well as areas of divergence


