
Key Insights
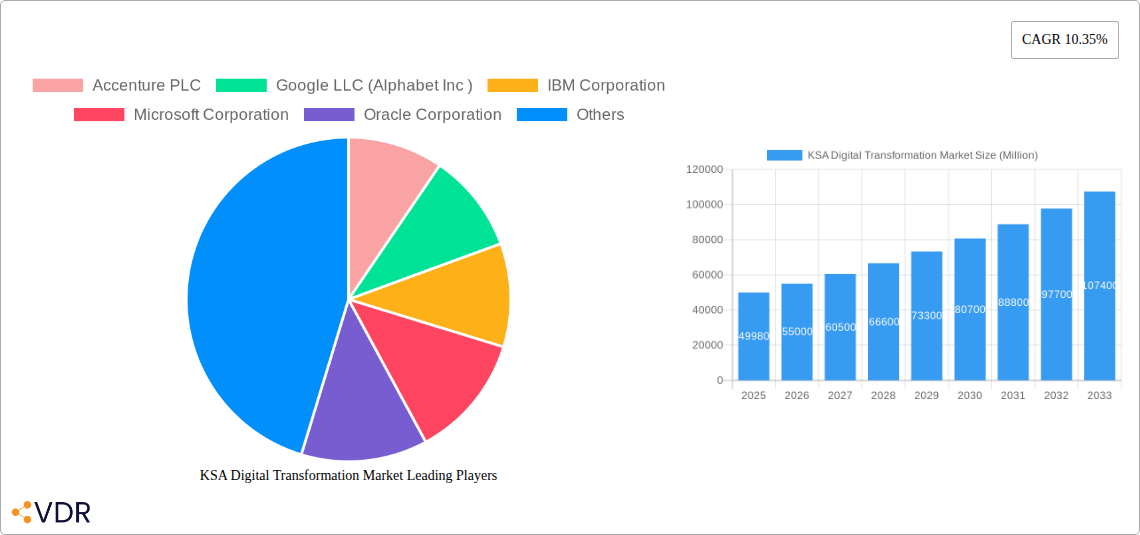
The Kingdom of Saudi Arabia (KSA) digital transformation market is experiencing robust growth, projected to reach a market size of $49.98 billion by 2025, exhibiting a Compound Annual Growth Rate (CAGR) of 10.35% from 2019 to 2033. This expansion is fueled by several key drivers. The Saudi Vision 2030 initiative, focused on economic diversification and technological advancement, is a primary catalyst, driving significant investments in digital infrastructure and promoting the adoption of advanced technologies across various sectors. Furthermore, the increasing penetration of smartphones and internet access, coupled with a young and tech-savvy population, creates a fertile ground for digital solutions. Government initiatives to support digital innovation, including regulatory reforms and investment in digital skills development, further accelerate market growth. Growth is being witnessed across segments, including cloud computing, cybersecurity, big data analytics, and artificial intelligence, driven by the need for enhanced efficiency, improved service delivery, and strengthened national security. While data privacy concerns and a potential skills gap represent some challenges, the overall market trajectory remains strongly positive, presenting substantial opportunities for both local and international players.
The competitive landscape is intensely dynamic, featuring a mix of global technology giants and regional players. Accenture, Google, IBM, Microsoft, Oracle, and others are actively competing for market share, offering a wide range of digital transformation services and solutions. The market's future growth will likely be shaped by the continued implementation of Vision 2030, the government's push for digital inclusion, and the emergence of new technologies such as the metaverse and Web3. Specific segments within the market, such as FinTech and e-government, are expected to experience particularly rapid expansion, driven by both consumer demand and government initiatives aimed at enhancing citizen services and financial inclusion. Companies focused on providing tailored solutions addressing the unique needs of the KSA market, particularly those integrating local cultural nuances and regulatory frameworks, are poised to gain a significant competitive edge.
KSA Digital Transformation Market: A Comprehensive Report (2019-2033)
This comprehensive report provides an in-depth analysis of the Kingdom of Saudi Arabia (KSA) Digital Transformation Market, offering valuable insights for industry professionals, investors, and policymakers. The report covers the period 2019-2033, with a focus on the forecast period 2025-2033, using 2025 as the base year. The market is segmented by various factors, offering a granular view of the opportunities and challenges within this rapidly evolving landscape. The total market size is projected to reach xx Million by 2033.
KSA Digital Transformation Market Dynamics & Structure
The KSA digital transformation market is experiencing significant growth, driven by government initiatives like Vision 2030 and increasing private sector investment. Market concentration is moderate, with several major players vying for market share. Technological innovation, particularly in AI, cloud computing, and cybersecurity, is a key driver. The regulatory framework, while evolving, supports digital adoption. Competitive product substitutes are emerging, increasing competition. The end-user demographics are shifting towards a more digitally-savvy population. M&A activity is expected to increase as companies consolidate and expand their offerings.
- Market Concentration: Moderately concentrated, with top 5 players holding approximately 55% market share in 2025.
- Technological Innovation: AI, Cloud Computing, IoT, and Cybersecurity are key drivers.
- Regulatory Framework: Supportive of digital transformation, with ongoing developments.
- Competitive Substitutes: Increasing competition from niche players and open-source solutions.
- End-User Demographics: Growing digital literacy and adoption across all sectors.
- M&A Trends: Expected increase in mergers and acquisitions to enhance market position. An estimated xx M&A deals are predicted between 2025 and 2033.
KSA Digital Transformation Market Growth Trends & Insights
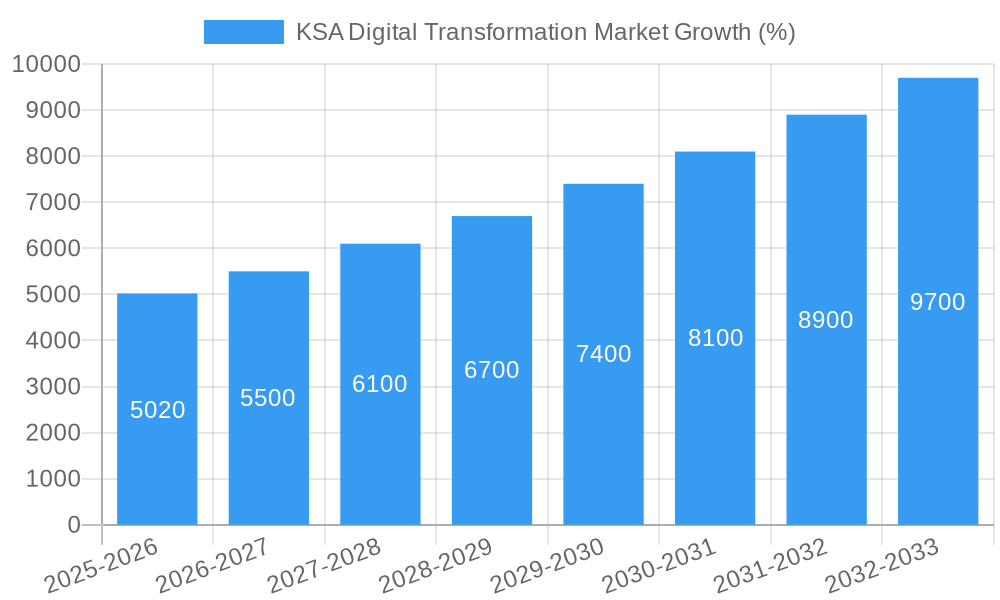
The KSA digital transformation market demonstrates robust growth, fueled by government investments and private sector adoption. The market size has shown a significant increase from xx Million in 2019 to an estimated xx Million in 2025. This growth is projected to continue at a Compound Annual Growth Rate (CAGR) of xx% from 2025 to 2033, reaching xx Million by 2033. Market penetration is increasing across various sectors, with a particularly strong uptake in the financial services and government sectors. Technological disruptions, such as the widespread adoption of cloud-based solutions, and changing consumer behavior are influencing market dynamics. The increasing demand for digital services and solutions is a major driver for this growth.
Dominant Regions, Countries, or Segments in KSA Digital Transformation Market
The Riyadh region is currently the dominant driver of the KSA digital transformation market, accounting for approximately xx% of the market share in 2025. This dominance is attributed to the concentration of government agencies, major corporations, and technological infrastructure in the region. Other major cities like Jeddah and Dammam are also experiencing significant growth. The financial services sector is a key segment, followed by the government and telecom sectors.
- Key Drivers in Riyadh: Government initiatives, robust infrastructure, skilled workforce.
- Growth Potential in other regions: Expanding digital infrastructure and government initiatives in other regions.
- Dominant Segments: Financial services, Government, Telecommunications.
KSA Digital Transformation Market Product Landscape
The KSA digital transformation market offers a diverse range of products and services, including cloud computing solutions, cybersecurity systems, data analytics platforms, and AI-powered applications. These solutions are tailored to meet the specific needs of various industries, showcasing advanced features and functionalities. Key product innovations focus on enhancing security, scalability, and user experience.
Key Drivers, Barriers & Challenges in KSA Digital Transformation Market
Key Drivers: Government support (Vision 2030), increasing digital literacy, private sector investment, and technological advancements. For example, the significant investment in 5G infrastructure is accelerating digital transformation across various sectors.
Key Barriers and Challenges: Cybersecurity threats, talent shortage, integration complexities, and regulatory uncertainties remain significant hurdles. These challenges could result in a xx% reduction in projected growth if not addressed effectively.
Emerging Opportunities in KSA Digital Transformation Market
Significant opportunities exist in sectors such as healthcare, education, and smart cities. The adoption of AI and IoT in these sectors presents considerable growth potential. Furthermore, the development of indigenous technological solutions and the expansion of digital services into rural areas offer promising avenues for growth.
Growth Accelerators in the KSA Digital Transformation Market Industry
Strategic partnerships between government entities and private sector companies are crucial growth accelerators. Furthermore, investments in research and development, along with the promotion of a robust digital ecosystem, will significantly enhance market expansion and long-term growth.
Key Players Shaping the KSA Digital Transformation Market Market
- Accenture PLC
- Google LLC (Alphabet Inc)
- IBM Corporation
- Microsoft Corporation
- Oracle Corporation
- Hewlett Packard Enterprise
- SAP SE
- Capgemini SE
- Dell Technologies
- Cisco Systems Inc
- Siemens A
Notable Milestones in KSA Digital Transformation Market Sector
- March 2024: Launch of digital transformation initiatives at the Public Prosecution headquarters in Riyadh.
- July 2024: Zain KSA launches digital authentication services in collaboration with the Sadq platform.
In-Depth KSA Digital Transformation Market Market Outlook
The KSA digital transformation market presents a compelling investment opportunity, with significant growth potential driven by government support, technological advancements, and increasing private sector adoption. Strategic partnerships, coupled with investments in infrastructure and talent development, will further propel market expansion. The market is poised for sustained growth, offering lucrative prospects for both established players and emerging companies.
KSA Digital Transformation Market Segmentation
-
1. Type
-
1.1. Artificial Intelligence and Machine Learning
- 1.1.1. Current
- 1.1.2. Key Grow
- 1.1.3. Use Case Analysis
- 1.1.4. Market Outlook
- 1.2. Extended Reality (VR & AR)
- 1.3. IoT
- 1.4. Industrial Robotics
- 1.5. Blockchain
- 1.6. Additive Manufacturing/3D Printing
- 1.7. Cybersecurity
- 1.8. Cloud Edge Computing
-
1.9. Others (digital twin, mobility and connectivity)
- 1.9.1. Market B
-
1.1. Artificial Intelligence and Machine Learning
-
2. End-User Industry
- 2.1. Manufacturing
- 2.2. Oil, Gas and Utilities
- 2.3. Retail & e-commerce
- 2.4. Transportation and Logistics
- 2.5. Healthcare
- 2.6. BFSI
- 2.7. Telecom and IT
- 2.8. Government and Public Sector
- 2.9. Others (
KSA Digital Transformation Market Segmentation By Geography
-
1. North America
- 1.1. United States
- 1.2. Canada
- 1.3. Mexico
-
2. South America
- 2.1. Brazil
- 2.2. Argentina
- 2.3. Rest of South America
-
3. Europe
- 3.1. United Kingdom
- 3.2. Germany
- 3.3. France
- 3.4. Italy
- 3.5. Spain
- 3.6. Russia
- 3.7. Benelux
- 3.8. Nordics
- 3.9. Rest of Europe
-
4. Middle East & Africa
- 4.1. Turkey
- 4.2. Israel
- 4.3. GCC
- 4.4. North Africa
- 4.5. South Africa
- 4.6. Rest of Middle East & Africa
-
5. Asia Pacific
- 5.1. China
- 5.2. India
- 5.3. Japan
- 5.4. South Korea
- 5.5. ASEAN
- 5.6. Oceania
- 5.7. Rest of Asia Pacific
KSA Digital Transformation Market REPORT HIGHLIGHTS
| Aspects | Details |
|---|---|
| Study Period | 2019-2033 |
| Base Year | 2024 |
| Estimated Year | 2025 |
| Forecast Period | 2025-2033 |
| Historical Period | 2019-2024 |
| Growth Rate | CAGR of 10.35% from 2019-2033 |
| Segmentation |
|
Table of Contents
- 1. Introduction
- 1.1. Research Scope
- 1.2. Market Segmentation
- 1.3. Research Methodology
- 1.4. Definitions and Assumptions
- 2. Executive Summary
- 2.1. Introduction
- 3. Market Dynamics
- 3.1. Introduction
- 3.2. Market Drivers
- 3.2.1. Increase in the adoption of big data analytics and other technologies in the Saudi Arabia; The rapid proliferation of mobile devices and apps
- 3.3. Market Restrains
- 3.3.1. Increase in the adoption of big data analytics and other technologies in the Saudi Arabia; The rapid proliferation of mobile devices and apps
- 3.4. Market Trends
- 3.4.1. The IoT Segment is Expected to Occupy the Largest Market Share
- 4. Market Factor Analysis
- 4.1. Porters Five Forces
- 4.2. Supply/Value Chain
- 4.3. PESTEL analysis
- 4.4. Market Entropy
- 4.5. Patent/Trademark Analysis
- 5. Global KSA Digital Transformation Market Analysis, Insights and Forecast, 2019-2031
- 5.1. Market Analysis, Insights and Forecast - by Type
- 5.1.1. Artificial Intelligence and Machine Learning
- 5.1.1.1. Current
- 5.1.1.2. Key Grow
- 5.1.1.3. Use Case Analysis
- 5.1.1.4. Market Outlook
- 5.1.2. Extended Reality (VR & AR)
- 5.1.3. IoT
- 5.1.4. Industrial Robotics
- 5.1.5. Blockchain
- 5.1.6. Additive Manufacturing/3D Printing
- 5.1.7. Cybersecurity
- 5.1.8. Cloud Edge Computing
- 5.1.9. Others (digital twin, mobility and connectivity)
- 5.1.9.1. Market B
- 5.1.1. Artificial Intelligence and Machine Learning
- 5.2. Market Analysis, Insights and Forecast - by End-User Industry
- 5.2.1. Manufacturing
- 5.2.2. Oil, Gas and Utilities
- 5.2.3. Retail & e-commerce
- 5.2.4. Transportation and Logistics
- 5.2.5. Healthcare
- 5.2.6. BFSI
- 5.2.7. Telecom and IT
- 5.2.8. Government and Public Sector
- 5.2.9. Others (
- 5.3. Market Analysis, Insights and Forecast - by Region
- 5.3.1. North America
- 5.3.2. South America
- 5.3.3. Europe
- 5.3.4. Middle East & Africa
- 5.3.5. Asia Pacific
- 5.1. Market Analysis, Insights and Forecast - by Type
- 6. North America KSA Digital Transformation Market Analysis, Insights and Forecast, 2019-2031
- 6.1. Market Analysis, Insights and Forecast - by Type
- 6.1.1. Artificial Intelligence and Machine Learning
- 6.1.1.1. Current
- 6.1.1.2. Key Grow
- 6.1.1.3. Use Case Analysis
- 6.1.1.4. Market Outlook
- 6.1.2. Extended Reality (VR & AR)
- 6.1.3. IoT
- 6.1.4. Industrial Robotics
- 6.1.5. Blockchain
- 6.1.6. Additive Manufacturing/3D Printing
- 6.1.7. Cybersecurity
- 6.1.8. Cloud Edge Computing
- 6.1.9. Others (digital twin, mobility and connectivity)
- 6.1.9.1. Market B
- 6.1.1. Artificial Intelligence and Machine Learning
- 6.2. Market Analysis, Insights and Forecast - by End-User Industry
- 6.2.1. Manufacturing
- 6.2.2. Oil, Gas and Utilities
- 6.2.3. Retail & e-commerce
- 6.2.4. Transportation and Logistics
- 6.2.5. Healthcare
- 6.2.6. BFSI
- 6.2.7. Telecom and IT
- 6.2.8. Government and Public Sector
- 6.2.9. Others (
- 6.1. Market Analysis, Insights and Forecast - by Type
- 7. South America KSA Digital Transformation Market Analysis, Insights and Forecast, 2019-2031
- 7.1. Market Analysis, Insights and Forecast - by Type
- 7.1.1. Artificial Intelligence and Machine Learning
- 7.1.1.1. Current
- 7.1.1.2. Key Grow
- 7.1.1.3. Use Case Analysis
- 7.1.1.4. Market Outlook
- 7.1.2. Extended Reality (VR & AR)
- 7.1.3. IoT
- 7.1.4. Industrial Robotics
- 7.1.5. Blockchain
- 7.1.6. Additive Manufacturing/3D Printing
- 7.1.7. Cybersecurity
- 7.1.8. Cloud Edge Computing
- 7.1.9. Others (digital twin, mobility and connectivity)
- 7.1.9.1. Market B
- 7.1.1. Artificial Intelligence and Machine Learning
- 7.2. Market Analysis, Insights and Forecast - by End-User Industry
- 7.2.1. Manufacturing
- 7.2.2. Oil, Gas and Utilities
- 7.2.3. Retail & e-commerce
- 7.2.4. Transportation and Logistics
- 7.2.5. Healthcare
- 7.2.6. BFSI
- 7.2.7. Telecom and IT
- 7.2.8. Government and Public Sector
- 7.2.9. Others (
- 7.1. Market Analysis, Insights and Forecast - by Type
- 8. Europe KSA Digital Transformation Market Analysis, Insights and Forecast, 2019-2031
- 8.1. Market Analysis, Insights and Forecast - by Type
- 8.1.1. Artificial Intelligence and Machine Learning
- 8.1.1.1. Current
- 8.1.1.2. Key Grow
- 8.1.1.3. Use Case Analysis
- 8.1.1.4. Market Outlook
- 8.1.2. Extended Reality (VR & AR)
- 8.1.3. IoT
- 8.1.4. Industrial Robotics
- 8.1.5. Blockchain
- 8.1.6. Additive Manufacturing/3D Printing
- 8.1.7. Cybersecurity
- 8.1.8. Cloud Edge Computing
- 8.1.9. Others (digital twin, mobility and connectivity)
- 8.1.9.1. Market B
- 8.1.1. Artificial Intelligence and Machine Learning
- 8.2. Market Analysis, Insights and Forecast - by End-User Industry
- 8.2.1. Manufacturing
- 8.2.2. Oil, Gas and Utilities
- 8.2.3. Retail & e-commerce
- 8.2.4. Transportation and Logistics
- 8.2.5. Healthcare
- 8.2.6. BFSI
- 8.2.7. Telecom and IT
- 8.2.8. Government and Public Sector
- 8.2.9. Others (
- 8.1. Market Analysis, Insights and Forecast - by Type
- 9. Middle East & Africa KSA Digital Transformation Market Analysis, Insights and Forecast, 2019-2031
- 9.1. Market Analysis, Insights and Forecast - by Type
- 9.1.1. Artificial Intelligence and Machine Learning
- 9.1.1.1. Current
- 9.1.1.2. Key Grow
- 9.1.1.3. Use Case Analysis
- 9.1.1.4. Market Outlook
- 9.1.2. Extended Reality (VR & AR)
- 9.1.3. IoT
- 9.1.4. Industrial Robotics
- 9.1.5. Blockchain
- 9.1.6. Additive Manufacturing/3D Printing
- 9.1.7. Cybersecurity
- 9.1.8. Cloud Edge Computing
- 9.1.9. Others (digital twin, mobility and connectivity)
- 9.1.9.1. Market B
- 9.1.1. Artificial Intelligence and Machine Learning
- 9.2. Market Analysis, Insights and Forecast - by End-User Industry
- 9.2.1. Manufacturing
- 9.2.2. Oil, Gas and Utilities
- 9.2.3. Retail & e-commerce
- 9.2.4. Transportation and Logistics
- 9.2.5. Healthcare
- 9.2.6. BFSI
- 9.2.7. Telecom and IT
- 9.2.8. Government and Public Sector
- 9.2.9. Others (
- 9.1. Market Analysis, Insights and Forecast - by Type
- 10. Asia Pacific KSA Digital Transformation Market Analysis, Insights and Forecast, 2019-2031
- 10.1. Market Analysis, Insights and Forecast - by Type
- 10.1.1. Artificial Intelligence and Machine Learning
- 10.1.1.1. Current
- 10.1.1.2. Key Grow
- 10.1.1.3. Use Case Analysis
- 10.1.1.4. Market Outlook
- 10.1.2. Extended Reality (VR & AR)
- 10.1.3. IoT
- 10.1.4. Industrial Robotics
- 10.1.5. Blockchain
- 10.1.6. Additive Manufacturing/3D Printing
- 10.1.7. Cybersecurity
- 10.1.8. Cloud Edge Computing
- 10.1.9. Others (digital twin, mobility and connectivity)
- 10.1.9.1. Market B
- 10.1.1. Artificial Intelligence and Machine Learning
- 10.2. Market Analysis, Insights and Forecast - by End-User Industry
- 10.2.1. Manufacturing
- 10.2.2. Oil, Gas and Utilities
- 10.2.3. Retail & e-commerce
- 10.2.4. Transportation and Logistics
- 10.2.5. Healthcare
- 10.2.6. BFSI
- 10.2.7. Telecom and IT
- 10.2.8. Government and Public Sector
- 10.2.9. Others (
- 10.1. Market Analysis, Insights and Forecast - by Type
- 11. Competitive Analysis
- 11.1. Global Market Share Analysis 2024
- 11.2. Company Profiles
- 11.2.1 Accenture PLC
- 11.2.1.1. Overview
- 11.2.1.2. Products
- 11.2.1.3. SWOT Analysis
- 11.2.1.4. Recent Developments
- 11.2.1.5. Financials (Based on Availability)
- 11.2.2 Google LLC (Alphabet Inc )
- 11.2.2.1. Overview
- 11.2.2.2. Products
- 11.2.2.3. SWOT Analysis
- 11.2.2.4. Recent Developments
- 11.2.2.5. Financials (Based on Availability)
- 11.2.3 IBM Corporation
- 11.2.3.1. Overview
- 11.2.3.2. Products
- 11.2.3.3. SWOT Analysis
- 11.2.3.4. Recent Developments
- 11.2.3.5. Financials (Based on Availability)
- 11.2.4 Microsoft Corporation
- 11.2.4.1. Overview
- 11.2.4.2. Products
- 11.2.4.3. SWOT Analysis
- 11.2.4.4. Recent Developments
- 11.2.4.5. Financials (Based on Availability)
- 11.2.5 Oracle Corporation
- 11.2.5.1. Overview
- 11.2.5.2. Products
- 11.2.5.3. SWOT Analysis
- 11.2.5.4. Recent Developments
- 11.2.5.5. Financials (Based on Availability)
- 11.2.6 Hewlett Packard Enterprise
- 11.2.6.1. Overview
- 11.2.6.2. Products
- 11.2.6.3. SWOT Analysis
- 11.2.6.4. Recent Developments
- 11.2.6.5. Financials (Based on Availability)
- 11.2.7 SAP SE
- 11.2.7.1. Overview
- 11.2.7.2. Products
- 11.2.7.3. SWOT Analysis
- 11.2.7.4. Recent Developments
- 11.2.7.5. Financials (Based on Availability)
- 11.2.8 Capgemini SE
- 11.2.8.1. Overview
- 11.2.8.2. Products
- 11.2.8.3. SWOT Analysis
- 11.2.8.4. Recent Developments
- 11.2.8.5. Financials (Based on Availability)
- 11.2.9 Dell Technologies
- 11.2.9.1. Overview
- 11.2.9.2. Products
- 11.2.9.3. SWOT Analysis
- 11.2.9.4. Recent Developments
- 11.2.9.5. Financials (Based on Availability)
- 11.2.10 Cisco Systems Inc
- 11.2.10.1. Overview
- 11.2.10.2. Products
- 11.2.10.3. SWOT Analysis
- 11.2.10.4. Recent Developments
- 11.2.10.5. Financials (Based on Availability)
- 11.2.11 Siemens A
- 11.2.11.1. Overview
- 11.2.11.2. Products
- 11.2.11.3. SWOT Analysis
- 11.2.11.4. Recent Developments
- 11.2.11.5. Financials (Based on Availability)
- 11.2.1 Accenture PLC
List of Figures
- Figure 1: Global KSA Digital Transformation Market Revenue Breakdown (Million, %) by Region 2024 & 2032
- Figure 2: Global KSA Digital Transformation Market Volume Breakdown (Billion, %) by Region 2024 & 2032
- Figure 3: North America KSA Digital Transformation Market Revenue (Million), by Type 2024 & 2032
- Figure 4: North America KSA Digital Transformation Market Volume (Billion), by Type 2024 & 2032
- Figure 5: North America KSA Digital Transformation Market Revenue Share (%), by Type 2024 & 2032
- Figure 6: North America KSA Digital Transformation Market Volume Share (%), by Type 2024 & 2032
- Figure 7: North America KSA Digital Transformation Market Revenue (Million), by End-User Industry 2024 & 2032
- Figure 8: North America KSA Digital Transformation Market Volume (Billion), by End-User Industry 2024 & 2032
- Figure 9: North America KSA Digital Transformation Market Revenue Share (%), by End-User Industry 2024 & 2032
- Figure 10: North America KSA Digital Transformation Market Volume Share (%), by End-User Industry 2024 & 2032
- Figure 11: North America KSA Digital Transformation Market Revenue (Million), by Country 2024 & 2032
- Figure 12: North America KSA Digital Transformation Market Volume (Billion), by Country 2024 & 2032
- Figure 13: North America KSA Digital Transformation Market Revenue Share (%), by Country 2024 & 2032
- Figure 14: North America KSA Digital Transformation Market Volume Share (%), by Country 2024 & 2032
- Figure 15: South America KSA Digital Transformation Market Revenue (Million), by Type 2024 & 2032
- Figure 16: South America KSA Digital Transformation Market Volume (Billion), by Type 2024 & 2032
- Figure 17: South America KSA Digital Transformation Market Revenue Share (%), by Type 2024 & 2032
- Figure 18: South America KSA Digital Transformation Market Volume Share (%), by Type 2024 & 2032
- Figure 19: South America KSA Digital Transformation Market Revenue (Million), by End-User Industry 2024 & 2032
- Figure 20: South America KSA Digital Transformation Market Volume (Billion), by End-User Industry 2024 & 2032
- Figure 21: South America KSA Digital Transformation Market Revenue Share (%), by End-User Industry 2024 & 2032
- Figure 22: South America KSA Digital Transformation Market Volume Share (%), by End-User Industry 2024 & 2032
- Figure 23: South America KSA Digital Transformation Market Revenue (Million), by Country 2024 & 2032
- Figure 24: South America KSA Digital Transformation Market Volume (Billion), by Country 2024 & 2032
- Figure 25: South America KSA Digital Transformation Market Revenue Share (%), by Country 2024 & 2032
- Figure 26: South America KSA Digital Transformation Market Volume Share (%), by Country 2024 & 2032
- Figure 27: Europe KSA Digital Transformation Market Revenue (Million), by Type 2024 & 2032
- Figure 28: Europe KSA Digital Transformation Market Volume (Billion), by Type 2024 & 2032
- Figure 29: Europe KSA Digital Transformation Market Revenue Share (%), by Type 2024 & 2032
- Figure 30: Europe KSA Digital Transformation Market Volume Share (%), by Type 2024 & 2032
- Figure 31: Europe KSA Digital Transformation Market Revenue (Million), by End-User Industry 2024 & 2032
- Figure 32: Europe KSA Digital Transformation Market Volume (Billion), by End-User Industry 2024 & 2032
- Figure 33: Europe KSA Digital Transformation Market Revenue Share (%), by End-User Industry 2024 & 2032
- Figure 34: Europe KSA Digital Transformation Market Volume Share (%), by End-User Industry 2024 & 2032
- Figure 35: Europe KSA Digital Transformation Market Revenue (Million), by Country 2024 & 2032
- Figure 36: Europe KSA Digital Transformation Market Volume (Billion), by Country 2024 & 2032
- Figure 37: Europe KSA Digital Transformation Market Revenue Share (%), by Country 2024 & 2032
- Figure 38: Europe KSA Digital Transformation Market Volume Share (%), by Country 2024 & 2032
- Figure 39: Middle East & Africa KSA Digital Transformation Market Revenue (Million), by Type 2024 & 2032
- Figure 40: Middle East & Africa KSA Digital Transformation Market Volume (Billion), by Type 2024 & 2032
- Figure 41: Middle East & Africa KSA Digital Transformation Market Revenue Share (%), by Type 2024 & 2032
- Figure 42: Middle East & Africa KSA Digital Transformation Market Volume Share (%), by Type 2024 & 2032
- Figure 43: Middle East & Africa KSA Digital Transformation Market Revenue (Million), by End-User Industry 2024 & 2032
- Figure 44: Middle East & Africa KSA Digital Transformation Market Volume (Billion), by End-User Industry 2024 & 2032
- Figure 45: Middle East & Africa KSA Digital Transformation Market Revenue Share (%), by End-User Industry 2024 & 2032
- Figure 46: Middle East & Africa KSA Digital Transformation Market Volume Share (%), by End-User Industry 2024 & 2032
- Figure 47: Middle East & Africa KSA Digital Transformation Market Revenue (Million), by Country 2024 & 2032
- Figure 48: Middle East & Africa KSA Digital Transformation Market Volume (Billion), by Country 2024 & 2032
- Figure 49: Middle East & Africa KSA Digital Transformation Market Revenue Share (%), by Country 2024 & 2032
- Figure 50: Middle East & Africa KSA Digital Transformation Market Volume Share (%), by Country 2024 & 2032
- Figure 51: Asia Pacific KSA Digital Transformation Market Revenue (Million), by Type 2024 & 2032
- Figure 52: Asia Pacific KSA Digital Transformation Market Volume (Billion), by Type 2024 & 2032
- Figure 53: Asia Pacific KSA Digital Transformation Market Revenue Share (%), by Type 2024 & 2032
- Figure 54: Asia Pacific KSA Digital Transformation Market Volume Share (%), by Type 2024 & 2032
- Figure 55: Asia Pacific KSA Digital Transformation Market Revenue (Million), by End-User Industry 2024 & 2032
- Figure 56: Asia Pacific KSA Digital Transformation Market Volume (Billion), by End-User Industry 2024 & 2032
- Figure 57: Asia Pacific KSA Digital Transformation Market Revenue Share (%), by End-User Industry 2024 & 2032
- Figure 58: Asia Pacific KSA Digital Transformation Market Volume Share (%), by End-User Industry 2024 & 2032
- Figure 59: Asia Pacific KSA Digital Transformation Market Revenue (Million), by Country 2024 & 2032
- Figure 60: Asia Pacific KSA Digital Transformation Market Volume (Billion), by Country 2024 & 2032
- Figure 61: Asia Pacific KSA Digital Transformation Market Revenue Share (%), by Country 2024 & 2032
- Figure 62: Asia Pacific KSA Digital Transformation Market Volume Share (%), by Country 2024 & 2032
List of Tables
- Table 1: Global KSA Digital Transformation Market Revenue Million Forecast, by Region 2019 & 2032
- Table 2: Global KSA Digital Transformation Market Volume Billion Forecast, by Region 2019 & 2032
- Table 3: Global KSA Digital Transformation Market Revenue Million Forecast, by Type 2019 & 2032
- Table 4: Global KSA Digital Transformation Market Volume Billion Forecast, by Type 2019 & 2032
- Table 5: Global KSA Digital Transformation Market Revenue Million Forecast, by End-User Industry 2019 & 2032
- Table 6: Global KSA Digital Transformation Market Volume Billion Forecast, by End-User Industry 2019 & 2032
- Table 7: Global KSA Digital Transformation Market Revenue Million Forecast, by Region 2019 & 2032
- Table 8: Global KSA Digital Transformation Market Volume Billion Forecast, by Region 2019 & 2032
- Table 9: Global KSA Digital Transformation Market Revenue Million Forecast, by Type 2019 & 2032
- Table 10: Global KSA Digital Transformation Market Volume Billion Forecast, by Type 2019 & 2032
- Table 11: Global KSA Digital Transformation Market Revenue Million Forecast, by End-User Industry 2019 & 2032
- Table 12: Global KSA Digital Transformation Market Volume Billion Forecast, by End-User Industry 2019 & 2032
- Table 13: Global KSA Digital Transformation Market Revenue Million Forecast, by Country 2019 & 2032
- Table 14: Global KSA Digital Transformation Market Volume Billion Forecast, by Country 2019 & 2032
- Table 15: United States KSA Digital Transformation Market Revenue (Million) Forecast, by Application 2019 & 2032
- Table 16: United States KSA Digital Transformation Market Volume (Billion) Forecast, by Application 2019 & 2032
- Table 17: Canada KSA Digital Transformation Market Revenue (Million) Forecast, by Application 2019 & 2032
- Table 18: Canada KSA Digital Transformation Market Volume (Billion) Forecast, by Application 2019 & 2032
- Table 19: Mexico KSA Digital Transformation Market Revenue (Million) Forecast, by Application 2019 & 2032
- Table 20: Mexico KSA Digital Transformation Market Volume (Billion) Forecast, by Application 2019 & 2032
- Table 21: Global KSA Digital Transformation Market Revenue Million Forecast, by Type 2019 & 2032
- Table 22: Global KSA Digital Transformation Market Volume Billion Forecast, by Type 2019 & 2032
- Table 23: Global KSA Digital Transformation Market Revenue Million Forecast, by End-User Industry 2019 & 2032
- Table 24: Global KSA Digital Transformation Market Volume Billion Forecast, by End-User Industry 2019 & 2032
- Table 25: Global KSA Digital Transformation Market Revenue Million Forecast, by Country 2019 & 2032
- Table 26: Global KSA Digital Transformation Market Volume Billion Forecast, by Country 2019 & 2032
- Table 27: Brazil KSA Digital Transformation Market Revenue (Million) Forecast, by Application 2019 & 2032
- Table 28: Brazil KSA Digital Transformation Market Volume (Billion) Forecast, by Application 2019 & 2032
- Table 29: Argentina KSA Digital Transformation Market Revenue (Million) Forecast, by Application 2019 & 2032
- Table 30: Argentina KSA Digital Transformation Market Volume (Billion) Forecast, by Application 2019 & 2032
- Table 31: Rest of South America KSA Digital Transformation Market Revenue (Million) Forecast, by Application 2019 & 2032
- Table 32: Rest of South America KSA Digital Transformation Market Volume (Billion) Forecast, by Application 2019 & 2032
- Table 33: Global KSA Digital Transformation Market Revenue Million Forecast, by Type 2019 & 2032
- Table 34: Global KSA Digital Transformation Market Volume Billion Forecast, by Type 2019 & 2032
- Table 35: Global KSA Digital Transformation Market Revenue Million Forecast, by End-User Industry 2019 & 2032
- Table 36: Global KSA Digital Transformation Market Volume Billion Forecast, by End-User Industry 2019 & 2032
- Table 37: Global KSA Digital Transformation Market Revenue Million Forecast, by Country 2019 & 2032
- Table 38: Global KSA Digital Transformation Market Volume Billion Forecast, by Country 2019 & 2032
- Table 39: United Kingdom KSA Digital Transformation Market Revenue (Million) Forecast, by Application 2019 & 2032
- Table 40: United Kingdom KSA Digital Transformation Market Volume (Billion) Forecast, by Application 2019 & 2032
- Table 41: Germany KSA Digital Transformation Market Revenue (Million) Forecast, by Application 2019 & 2032
- Table 42: Germany KSA Digital Transformation Market Volume (Billion) Forecast, by Application 2019 & 2032
- Table 43: France KSA Digital Transformation Market Revenue (Million) Forecast, by Application 2019 & 2032
- Table 44: France KSA Digital Transformation Market Volume (Billion) Forecast, by Application 2019 & 2032
- Table 45: Italy KSA Digital Transformation Market Revenue (Million) Forecast, by Application 2019 & 2032
- Table 46: Italy KSA Digital Transformation Market Volume (Billion) Forecast, by Application 2019 & 2032
- Table 47: Spain KSA Digital Transformation Market Revenue (Million) Forecast, by Application 2019 & 2032
- Table 48: Spain KSA Digital Transformation Market Volume (Billion) Forecast, by Application 2019 & 2032
- Table 49: Russia KSA Digital Transformation Market Revenue (Million) Forecast, by Application 2019 & 2032
- Table 50: Russia KSA Digital Transformation Market Volume (Billion) Forecast, by Application 2019 & 2032
- Table 51: Benelux KSA Digital Transformation Market Revenue (Million) Forecast, by Application 2019 & 2032
- Table 52: Benelux KSA Digital Transformation Market Volume (Billion) Forecast, by Application 2019 & 2032
- Table 53: Nordics KSA Digital Transformation Market Revenue (Million) Forecast, by Application 2019 & 2032
- Table 54: Nordics KSA Digital Transformation Market Volume (Billion) Forecast, by Application 2019 & 2032
- Table 55: Rest of Europe KSA Digital Transformation Market Revenue (Million) Forecast, by Application 2019 & 2032
- Table 56: Rest of Europe KSA Digital Transformation Market Volume (Billion) Forecast, by Application 2019 & 2032
- Table 57: Global KSA Digital Transformation Market Revenue Million Forecast, by Type 2019 & 2032
- Table 58: Global KSA Digital Transformation Market Volume Billion Forecast, by Type 2019 & 2032
- Table 59: Global KSA Digital Transformation Market Revenue Million Forecast, by End-User Industry 2019 & 2032
- Table 60: Global KSA Digital Transformation Market Volume Billion Forecast, by End-User Industry 2019 & 2032
- Table 61: Global KSA Digital Transformation Market Revenue Million Forecast, by Country 2019 & 2032
- Table 62: Global KSA Digital Transformation Market Volume Billion Forecast, by Country 2019 & 2032
- Table 63: Turkey KSA Digital Transformation Market Revenue (Million) Forecast, by Application 2019 & 2032
- Table 64: Turkey KSA Digital Transformation Market Volume (Billion) Forecast, by Application 2019 & 2032
- Table 65: Israel KSA Digital Transformation Market Revenue (Million) Forecast, by Application 2019 & 2032
- Table 66: Israel KSA Digital Transformation Market Volume (Billion) Forecast, by Application 2019 & 2032
- Table 67: GCC KSA Digital Transformation Market Revenue (Million) Forecast, by Application 2019 & 2032
- Table 68: GCC KSA Digital Transformation Market Volume (Billion) Forecast, by Application 2019 & 2032
- Table 69: North Africa KSA Digital Transformation Market Revenue (Million) Forecast, by Application 2019 & 2032
- Table 70: North Africa KSA Digital Transformation Market Volume (Billion) Forecast, by Application 2019 & 2032
- Table 71: South Africa KSA Digital Transformation Market Revenue (Million) Forecast, by Application 2019 & 2032
- Table 72: South Africa KSA Digital Transformation Market Volume (Billion) Forecast, by Application 2019 & 2032
- Table 73: Rest of Middle East & Africa KSA Digital Transformation Market Revenue (Million) Forecast, by Application 2019 & 2032
- Table 74: Rest of Middle East & Africa KSA Digital Transformation Market Volume (Billion) Forecast, by Application 2019 & 2032
- Table 75: Global KSA Digital Transformation Market Revenue Million Forecast, by Type 2019 & 2032
- Table 76: Global KSA Digital Transformation Market Volume Billion Forecast, by Type 2019 & 2032
- Table 77: Global KSA Digital Transformation Market Revenue Million Forecast, by End-User Industry 2019 & 2032
- Table 78: Global KSA Digital Transformation Market Volume Billion Forecast, by End-User Industry 2019 & 2032
- Table 79: Global KSA Digital Transformation Market Revenue Million Forecast, by Country 2019 & 2032
- Table 80: Global KSA Digital Transformation Market Volume Billion Forecast, by Country 2019 & 2032
- Table 81: China KSA Digital Transformation Market Revenue (Million) Forecast, by Application 2019 & 2032
- Table 82: China KSA Digital Transformation Market Volume (Billion) Forecast, by Application 2019 & 2032
- Table 83: India KSA Digital Transformation Market Revenue (Million) Forecast, by Application 2019 & 2032
- Table 84: India KSA Digital Transformation Market Volume (Billion) Forecast, by Application 2019 & 2032
- Table 85: Japan KSA Digital Transformation Market Revenue (Million) Forecast, by Application 2019 & 2032
- Table 86: Japan KSA Digital Transformation Market Volume (Billion) Forecast, by Application 2019 & 2032
- Table 87: South Korea KSA Digital Transformation Market Revenue (Million) Forecast, by Application 2019 & 2032
- Table 88: South Korea KSA Digital Transformation Market Volume (Billion) Forecast, by Application 2019 & 2032
- Table 89: ASEAN KSA Digital Transformation Market Revenue (Million) Forecast, by Application 2019 & 2032
- Table 90: ASEAN KSA Digital Transformation Market Volume (Billion) Forecast, by Application 2019 & 2032
- Table 91: Oceania KSA Digital Transformation Market Revenue (Million) Forecast, by Application 2019 & 2032
- Table 92: Oceania KSA Digital Transformation Market Volume (Billion) Forecast, by Application 2019 & 2032
- Table 93: Rest of Asia Pacific KSA Digital Transformation Market Revenue (Million) Forecast, by Application 2019 & 2032
- Table 94: Rest of Asia Pacific KSA Digital Transformation Market Volume (Billion) Forecast, by Application 2019 & 2032
Frequently Asked Questions
1. What is the projected Compound Annual Growth Rate (CAGR) of the KSA Digital Transformation Market?
The projected CAGR is approximately 10.35%.
2. Which companies are prominent players in the KSA Digital Transformation Market?
Key companies in the market include Accenture PLC, Google LLC (Alphabet Inc ), IBM Corporation, Microsoft Corporation, Oracle Corporation, Hewlett Packard Enterprise, SAP SE, Capgemini SE, Dell Technologies, Cisco Systems Inc, Siemens A.
3. What are the main segments of the KSA Digital Transformation Market?
The market segments include Type, End-User Industry.
4. Can you provide details about the market size?
The market size is estimated to be USD 49.98 Million as of 2022.
5. What are some drivers contributing to market growth?
Increase in the adoption of big data analytics and other technologies in the Saudi Arabia; The rapid proliferation of mobile devices and apps.
6. What are the notable trends driving market growth?
The IoT Segment is Expected to Occupy the Largest Market Share.
7. Are there any restraints impacting market growth?
Increase in the adoption of big data analytics and other technologies in the Saudi Arabia; The rapid proliferation of mobile devices and apps.
8. Can you provide examples of recent developments in the market?
March 2024: Sheikh Saud bin Abdullah Al-Mujab, the Attorney General, spearheaded the launch of digital transformation initiatives at the Public Prosecution (PP) headquarters in Riyadh, underscoring the PP's ongoing strategic focus. The projects aim to boost digital transformation within the PP's operations, deliver digital services to beneficiaries, maintain regulatory compliance, and strengthen collaboration with government agencies.
9. What pricing options are available for accessing the report?
Pricing options include single-user, multi-user, and enterprise licenses priced at USD 3800, USD 4500, and USD 5800 respectively.
10. Is the market size provided in terms of value or volume?
The market size is provided in terms of value, measured in Million and volume, measured in Billion.
11. Are there any specific market keywords associated with the report?
Yes, the market keyword associated with the report is "KSA Digital Transformation Market," which aids in identifying and referencing the specific market segment covered.
12. How do I determine which pricing option suits my needs best?
The pricing options vary based on user requirements and access needs. Individual users may opt for single-user licenses, while businesses requiring broader access may choose multi-user or enterprise licenses for cost-effective access to the report.
13. Are there any additional resources or data provided in the KSA Digital Transformation Market report?
While the report offers comprehensive insights, it's advisable to review the specific contents or supplementary materials provided to ascertain if additional resources or data are available.
14. How can I stay updated on further developments or reports in the KSA Digital Transformation Market?
To stay informed about further developments, trends, and reports in the KSA Digital Transformation Market, consider subscribing to industry newsletters, following relevant companies and organizations, or regularly checking reputable industry news sources and publications.
Methodology
Step 1 - Identification of Relevant Samples Size from Population Database


Step 2 - Approaches for Defining Global Market Size (Value, Volume* & Price*)

Note*: In applicable scenarios
Step 3 - Data Sources
Primary Research
- Web Analytics
- Survey Reports
- Research Institute
- Latest Research Reports
- Opinion Leaders
Secondary Research
- Annual Reports
- White Paper
- Latest Press Release
- Industry Association
- Paid Database
- Investor Presentations

Step 4 - Data Triangulation
Involves using different sources of information in order to increase the validity of a study
These sources are likely to be stakeholders in a program - participants, other researchers, program staff, other community members, and so on.
Then we put all data in single framework & apply various statistical tools to find out the dynamic on the market.
During the analysis stage, feedback from the stakeholder groups would be compared to determine areas of agreement as well as areas of divergence


