

Key Insights
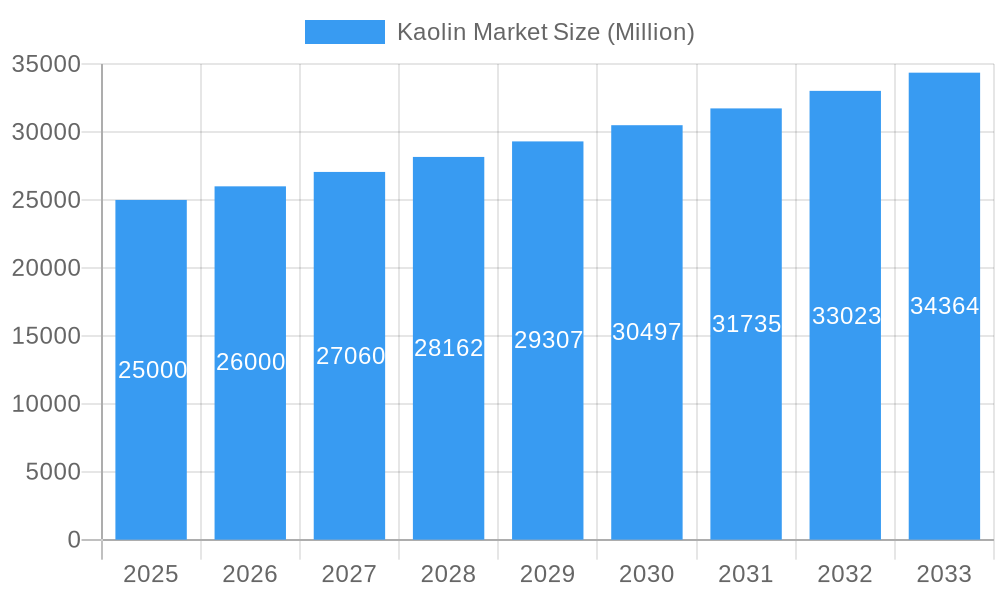
The global kaolin market is poised for substantial expansion, driven by escalating demand across a spectrum of applications. In the base year of 2025, the market size is valued at $4.26 billion. This growth trajectory is projected to continue at a Compound Annual Growth Rate (CAGR) of 3.7% through 2033. Key growth catalysts include the burgeoning paper and packaging sector, the expanding construction industry's utilization of kaolin in ceramics and coatings, and the increasing incorporation of kaolin in specialized applications such as rubber and plastics. Furthermore, continuous technological advancements are facilitating the development of innovative kaolin-based products with superior properties, thereby accelerating market proliferation.
Kaolin Market Market Size (In Billion)
Significant regional disparities characterize the kaolin market. The Asia Pacific region, notably China and India, is anticipated to lead market share due to rapid industrialization and escalating construction activities. North America and Europe constitute significant markets, propelled by well-established industries and high per capita consumption. Conversely, emerging economies in South America, the Middle East, and Africa present promising avenues for growth, albeit at a potentially more moderate pace than established regions. While evolving mining regulations and fluctuating raw material costs pose potential hurdles, ongoing innovation and strategic collaborations between kaolin manufacturers and end-user industries are expected to effectively address these challenges and sustain market expansion throughout the forecast period. The competitive arena comprises both established global enterprises and regional participants, fostering a dynamic and evolving market structure.
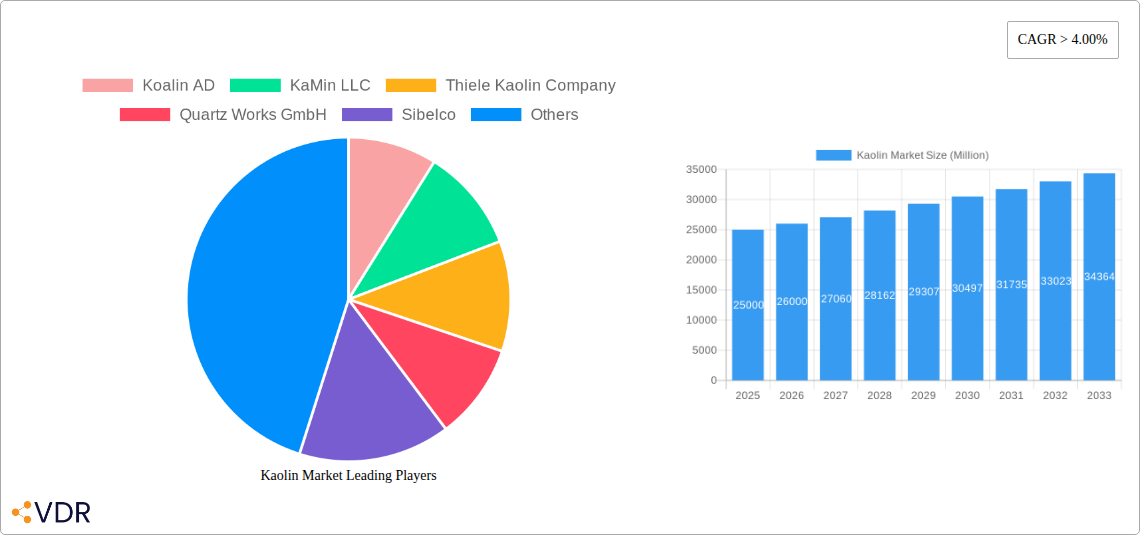
Kaolin Market Company Market Share
Kaolin Market: A Comprehensive Market Report (2019-2033)
This comprehensive report provides an in-depth analysis of the global kaolin market, encompassing market dynamics, growth trends, regional segmentation, product landscape, key players, and future outlook. The study period covers 2019-2033, with 2025 as the base year and a forecast period of 2025-2033. This report is essential for industry professionals, investors, and stakeholders seeking to understand the current market scenario and future growth prospects within the kaolin and its parent market, industrial minerals, and child markets like paper, ceramics, and rubber industries.
Kaolin Market Dynamics & Structure
The global kaolin market exhibits a moderately consolidated structure, with key players holding significant market share. Market concentration is influenced by factors such as economies of scale in mining and processing, access to high-quality raw materials, and established distribution networks. Technological innovation, primarily focused on enhancing kaolin's properties for specific applications (e.g., improved brightness, particle size distribution), plays a crucial role in shaping market dynamics. Stringent environmental regulations related to mining and processing impact operational costs and necessitate sustainable practices. The market also faces competition from alternative materials like synthetic fillers in certain applications. M&A activity, as evidenced by recent acquisitions, signifies industry consolidation and efforts to enhance market presence and product portfolios. The global kaolin market size is estimated to reach xx Million in 2025.
- Market Concentration: Moderately consolidated, with top players holding approximately xx% market share in 2025.
- Technological Innovation: Focus on enhancing brightness, particle size distribution, and functional properties.
- Regulatory Framework: Stringent environmental regulations impacting mining and processing.
- Competitive Substitutes: Synthetic fillers pose competition in specific applications.
- M&A Activity: Significant M&A activity observed, indicating industry consolidation.
- End-user Demographics: Diverse end-user base across various industries.
Kaolin Market Growth Trends & Insights
The kaolin market has witnessed consistent growth over the historical period (2019-2024), driven by increasing demand from key applications like paper, ceramics, and coatings. The market is projected to maintain a healthy CAGR of xx% during the forecast period (2025-2033), reaching xx Million by 2033. This growth is fueled by several factors, including rising disposable incomes, infrastructural development in emerging economies, technological advancements leading to improved kaolin grades and new applications, and the growth of the construction, packaging, and automotive sectors. Consumer behavior shifts towards sustainable and eco-friendly products are positively influencing demand for naturally occurring materials like kaolin. Technological disruptions in processing and mining techniques have also contributed to efficiency gains and lower production costs. Market penetration in emerging regions remains relatively low, offering significant growth opportunities in the future.
Dominant Regions, Countries, or Segments in Kaolin Market
The Asia-Pacific region is currently the dominant market for kaolin, driven by robust growth in the paper, ceramics, and coatings industries in countries like China and India. This region's strong economic growth and expanding industrial base fuel significant demand for kaolin. North America and Europe also hold considerable market share, though their growth rates are comparatively slower. Among applications, the paper industry currently represents the largest segment, followed by ceramics.
- Key Drivers (Asia-Pacific): Rapid industrialization, infrastructure development, growing paper and ceramics industries.
- Key Drivers (North America): Established manufacturing base, high per-capita consumption.
- Key Drivers (Europe): Strong regulatory frameworks driving demand for sustainable materials.
- Segment Dominance: Paper industry holds the largest market share, followed by ceramics and rubber.
Kaolin Market Product Landscape
Kaolin products are differentiated based on their properties, including particle size, brightness, viscosity, and other functional characteristics. Innovations focus on developing tailored kaolin grades to meet the specific needs of various applications. This includes enhanced brightness kaolin for paper coatings and high-viscosity grades for ceramic applications. Technological advancements in processing techniques, such as advanced milling and surface treatment technologies, play a crucial role in enhancing the performance metrics of kaolin products. Unique selling propositions often revolve around cost-effectiveness, sustainability, and improved performance compared to alternative materials.
Key Drivers, Barriers & Challenges in Kaolin Market
Key Drivers: Growing demand from key application sectors (paper, ceramics, coatings, rubber); infrastructural development in emerging markets; technological innovations leading to improved kaolin grades and new applications.
Challenges & Restraints: Fluctuations in raw material prices; stringent environmental regulations; competition from synthetic substitutes; supply chain disruptions; geopolitical instability impacting mining operations. For example, the impact of raw material price fluctuations on profitability is estimated to be around xx%.
Emerging Opportunities in Kaolin Market
Emerging opportunities in the kaolin market include exploration of new applications in areas like pharmaceuticals, cosmetics, and advanced materials. Untapped markets in developing economies offer significant growth potential. Growing consumer preference for sustainable and environmentally friendly products creates opportunities for kaolin as a naturally occurring material. The development of innovative kaolin-based composites with improved performance characteristics represents another significant opportunity.
Growth Accelerators in the Kaolin Market Industry
Long-term growth in the kaolin market is likely to be driven by technological advancements in kaolin processing and application development, leading to new product functionalities and market expansion. Strategic partnerships and collaborations across the value chain can foster innovation and enhance market penetration. The adoption of sustainable mining practices and enhanced supply chain management will contribute to the long-term growth of the industry.
Key Players Shaping the Kaolin Market Market
- Koalin AD
- KaMin LLC
- Thiele Kaolin Company
- Quartz Works GmbH
- Sibelco
- Imerys
- BASF SE
- EICL
- KERAMOST AS
Notable Milestones in Kaolin Market Sector
- September 2022: KaMin acquired the Kaolin Minerals Division of BASF, expanding its production capacity and market reach significantly.
- March 2022: Imerys divested selected North American kaolin assets to Thiele Kaolin Corporation, reshaping the competitive landscape in the paper and packaging sectors.
In-Depth Kaolin Market Market Outlook
The kaolin market is poised for continued growth over the forecast period, driven by factors such as increasing industrial activity, technological advancements, and the growing demand for sustainable materials. Strategic opportunities exist in exploring new applications, expanding into emerging markets, and fostering innovation through strategic partnerships. Companies focusing on sustainable mining practices and supply chain optimization are expected to gain a competitive advantage. The market’s long-term prospects remain positive, presenting significant investment opportunities for stakeholders.
Kaolin Market Segmentation
-
1. Application
- 1.1. Rubber
- 1.2. Ceramics
- 1.3. Paper
- 1.4. Plastics
- 1.5. Paintings
- 1.6. Other Applications
Kaolin Market Segmentation By Geography
-
1. Asia Pacific
- 1.1. China
- 1.2. India
- 1.3. Japan
- 1.4. South Korea
- 1.5. Rest of Asia Pacific
-
2. North America
- 2.1. United States
- 2.2. Canada
- 2.3. Mexico
-
3. Europe
- 3.1. Germany
- 3.2. United Kingdom
- 3.3. France
- 3.4. Italy
- 3.5. Rest of Europe
-
4. South America
- 4.1. Brazil
- 4.2. Argentina
- 4.3. Rest of South America
-
5. Middle East and Africa
- 5.1. Saudi Arabia
- 5.2. South Africa
- 5.3. Rest of Middle East and Africa
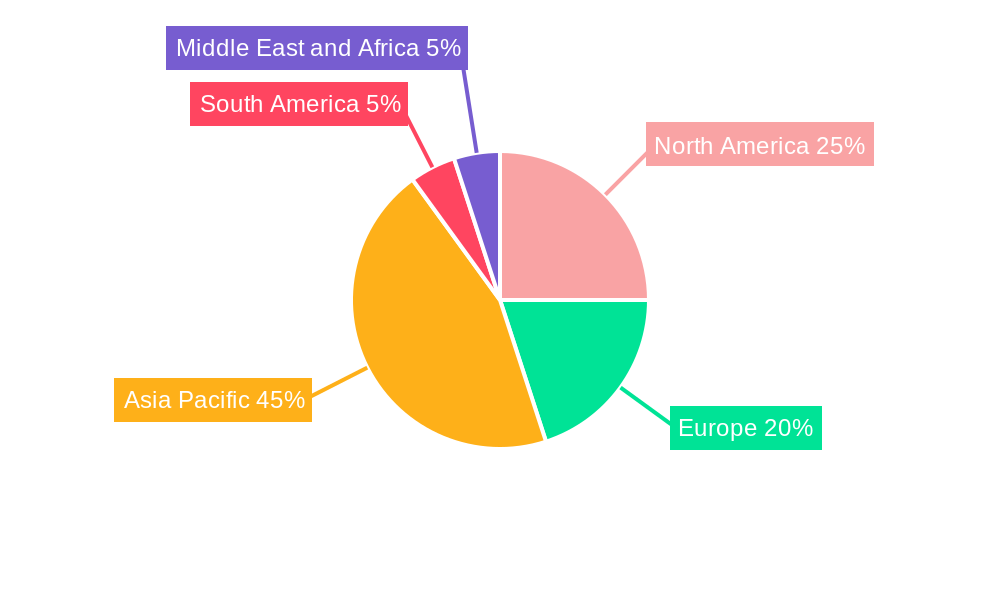
Kaolin Market Regional Market Share
Geographic Coverage of Kaolin Market
Kaolin Market REPORT HIGHLIGHTS
| Aspects | Details |
|---|---|
| Study Period | 2020-2034 |
| Base Year | 2025 |
| Estimated Year | 2026 |
| Forecast Period | 2026-2034 |
| Historical Period | 2020-2025 |
| Growth Rate | CAGR of 3.7% from 2020-2034 |
| Segmentation |
|
Table of Contents
- 1. Introduction
- 1.1. Research Scope
- 1.2. Market Segmentation
- 1.3. Research Objective
- 1.4. Definitions and Assumptions
- 2. Executive Summary
- 2.1. Market Snapshot
- 3. Market Dynamics
- 3.1. Market Drivers
- 3.2. Market Restrains
- 3.3. Market Trends
- 3.4. Market Opportunities
- 4. Market Factor Analysis
- 4.1. Porters Five Forces
- 4.1.1. Bargaining Power of Suppliers
- 4.1.2. Bargaining Power of Buyers
- 4.1.3. Threat of New Entrants
- 4.1.4. Threat of Substitutes
- 4.1.5. Competitive Rivalry
- 4.2. PESTEL analysis
- 4.3. BCG Analysis
- 4.3.1. Stars (High Growth, High Market Share)
- 4.3.2. Cash Cows (Low Growth, High Market Share)
- 4.3.3. Question Mark (High Growth, Low Market Share)
- 4.3.4. Dogs (Low Growth, Low Market Share)
- 4.4. Ansoff Matrix Analysis
- 4.5. Supply Chain Analysis
- 4.6. Regulatory Landscape
- 4.7. Current Market Potential and Opportunity Assessment (TAM–SAM–SOM Framework)
- 4.8. VDR Analyst Note
- 4.1. Porters Five Forces
- 5. Market Analysis, Insights and Forecast 2021-2033
- 5.1. Market Analysis, Insights and Forecast - by Application
- 5.1.1. Rubber
- 5.1.2. Ceramics
- 5.1.3. Paper
- 5.1.4. Plastics
- 5.1.5. Paintings
- 5.1.6. Other Applications
- 5.2. Market Analysis, Insights and Forecast - by Region
- 5.2.1. Asia Pacific
- 5.2.2. North America
- 5.2.3. Europe
- 5.2.4. South America
- 5.2.5. Middle East and Africa
- 5.1. Market Analysis, Insights and Forecast - by Application
- 6. Global Kaolin Market Analysis, Insights and Forecast, 2021-2033
- 6.1. Market Analysis, Insights and Forecast - by Application
- 6.1.1. Rubber
- 6.1.2. Ceramics
- 6.1.3. Paper
- 6.1.4. Plastics
- 6.1.5. Paintings
- 6.1.6. Other Applications
- 6.1. Market Analysis, Insights and Forecast - by Application
- 7. Asia Pacific Kaolin Market Analysis, Insights and Forecast, 2021-2033
- 7.1. Market Analysis, Insights and Forecast - by Application
- 7.1.1. Rubber
- 7.1.2. Ceramics
- 7.1.3. Paper
- 7.1.4. Plastics
- 7.1.5. Paintings
- 7.1.6. Other Applications
- 7.1. Market Analysis, Insights and Forecast - by Application
- 8. North America Kaolin Market Analysis, Insights and Forecast, 2021-2033
- 8.1. Market Analysis, Insights and Forecast - by Application
- 8.1.1. Rubber
- 8.1.2. Ceramics
- 8.1.3. Paper
- 8.1.4. Plastics
- 8.1.5. Paintings
- 8.1.6. Other Applications
- 8.1. Market Analysis, Insights and Forecast - by Application
- 9. Europe Kaolin Market Analysis, Insights and Forecast, 2021-2033
- 9.1. Market Analysis, Insights and Forecast - by Application
- 9.1.1. Rubber
- 9.1.2. Ceramics
- 9.1.3. Paper
- 9.1.4. Plastics
- 9.1.5. Paintings
- 9.1.6. Other Applications
- 9.1. Market Analysis, Insights and Forecast - by Application
- 10. South America Kaolin Market Analysis, Insights and Forecast, 2021-2033
- 10.1. Market Analysis, Insights and Forecast - by Application
- 10.1.1. Rubber
- 10.1.2. Ceramics
- 10.1.3. Paper
- 10.1.4. Plastics
- 10.1.5. Paintings
- 10.1.6. Other Applications
- 10.1. Market Analysis, Insights and Forecast - by Application
- 11. Middle East and Africa Kaolin Market Analysis, Insights and Forecast, 2021-2033
- 11.1. Market Analysis, Insights and Forecast - by Application
- 11.1.1. Rubber
- 11.1.2. Ceramics
- 11.1.3. Paper
- 11.1.4. Plastics
- 11.1.5. Paintings
- 11.1.6. Other Applications
- 11.1. Market Analysis, Insights and Forecast - by Application
- 12. Competitive Analysis
- 12.1. Company Profiles
- 12.1.1 Koalin AD
- 12.1.1.1. Company Overview
- 12.1.1.2. Products
- 12.1.1.3. Company Financials
- 12.1.1.4. SWOT Analysis
- 12.1.2 KaMin LLC
- 12.1.2.1. Company Overview
- 12.1.2.2. Products
- 12.1.2.3. Company Financials
- 12.1.2.4. SWOT Analysis
- 12.1.3 Thiele Kaolin Company
- 12.1.3.1. Company Overview
- 12.1.3.2. Products
- 12.1.3.3. Company Financials
- 12.1.3.4. SWOT Analysis
- 12.1.4 Quartz Works GmbH
- 12.1.4.1. Company Overview
- 12.1.4.2. Products
- 12.1.4.3. Company Financials
- 12.1.4.4. SWOT Analysis
- 12.1.5 Sibelco
- 12.1.5.1. Company Overview
- 12.1.5.2. Products
- 12.1.5.3. Company Financials
- 12.1.5.4. SWOT Analysis
- 12.1.6 Imerys
- 12.1.6.1. Company Overview
- 12.1.6.2. Products
- 12.1.6.3. Company Financials
- 12.1.6.4. SWOT Analysis
- 12.1.7 BASF SE
- 12.1.7.1. Company Overview
- 12.1.7.2. Products
- 12.1.7.3. Company Financials
- 12.1.7.4. SWOT Analysis
- 12.1.8 EICL
- 12.1.8.1. Company Overview
- 12.1.8.2. Products
- 12.1.8.3. Company Financials
- 12.1.8.4. SWOT Analysis
- 12.1.9 KERAMOST AS
- 12.1.9.1. Company Overview
- 12.1.9.2. Products
- 12.1.9.3. Company Financials
- 12.1.9.4. SWOT Analysis
- 12.1.1 Koalin AD
- 12.2. Market Entropy
- 12.2.1 Company's Key Areas Served
- 12.2.2 Recent Developments
- 12.3. Company Market Share Analysis 2025
- 12.3.1 Top 5 Companies Market Share Analysis
- 12.3.2 Top 3 Companies Market Share Analysis
- 12.4. List of Potential Customers
- 13. Research Methodology
List of Figures
- Figure 1: Global Kaolin Market Revenue Breakdown (billion, %) by Region 2025 & 2033
- Figure 2: Asia Pacific Kaolin Market Revenue (billion), by Application 2025 & 2033
- Figure 3: Asia Pacific Kaolin Market Revenue Share (%), by Application 2025 & 2033
- Figure 4: Asia Pacific Kaolin Market Revenue (billion), by Country 2025 & 2033
- Figure 5: Asia Pacific Kaolin Market Revenue Share (%), by Country 2025 & 2033
- Figure 6: North America Kaolin Market Revenue (billion), by Application 2025 & 2033
- Figure 7: North America Kaolin Market Revenue Share (%), by Application 2025 & 2033
- Figure 8: North America Kaolin Market Revenue (billion), by Country 2025 & 2033
- Figure 9: North America Kaolin Market Revenue Share (%), by Country 2025 & 2033
- Figure 10: Europe Kaolin Market Revenue (billion), by Application 2025 & 2033
- Figure 11: Europe Kaolin Market Revenue Share (%), by Application 2025 & 2033
- Figure 12: Europe Kaolin Market Revenue (billion), by Country 2025 & 2033
- Figure 13: Europe Kaolin Market Revenue Share (%), by Country 2025 & 2033
- Figure 14: South America Kaolin Market Revenue (billion), by Application 2025 & 2033
- Figure 15: South America Kaolin Market Revenue Share (%), by Application 2025 & 2033
- Figure 16: South America Kaolin Market Revenue (billion), by Country 2025 & 2033
- Figure 17: South America Kaolin Market Revenue Share (%), by Country 2025 & 2033
- Figure 18: Middle East and Africa Kaolin Market Revenue (billion), by Application 2025 & 2033
- Figure 19: Middle East and Africa Kaolin Market Revenue Share (%), by Application 2025 & 2033
- Figure 20: Middle East and Africa Kaolin Market Revenue (billion), by Country 2025 & 2033
- Figure 21: Middle East and Africa Kaolin Market Revenue Share (%), by Country 2025 & 2033
List of Tables
- Table 1: Global Kaolin Market Revenue billion Forecast, by Application 2020 & 2033
- Table 2: Global Kaolin Market Revenue billion Forecast, by Region 2020 & 2033
- Table 3: Global Kaolin Market Revenue billion Forecast, by Application 2020 & 2033
- Table 4: Global Kaolin Market Revenue billion Forecast, by Country 2020 & 2033
- Table 5: China Kaolin Market Revenue (billion) Forecast, by Application 2020 & 2033
- Table 6: India Kaolin Market Revenue (billion) Forecast, by Application 2020 & 2033
- Table 7: Japan Kaolin Market Revenue (billion) Forecast, by Application 2020 & 2033
- Table 8: South Korea Kaolin Market Revenue (billion) Forecast, by Application 2020 & 2033
- Table 9: Rest of Asia Pacific Kaolin Market Revenue (billion) Forecast, by Application 2020 & 2033
- Table 10: Global Kaolin Market Revenue billion Forecast, by Application 2020 & 2033
- Table 11: Global Kaolin Market Revenue billion Forecast, by Country 2020 & 2033
- Table 12: United States Kaolin Market Revenue (billion) Forecast, by Application 2020 & 2033
- Table 13: Canada Kaolin Market Revenue (billion) Forecast, by Application 2020 & 2033
- Table 14: Mexico Kaolin Market Revenue (billion) Forecast, by Application 2020 & 2033
- Table 15: Global Kaolin Market Revenue billion Forecast, by Application 2020 & 2033
- Table 16: Global Kaolin Market Revenue billion Forecast, by Country 2020 & 2033
- Table 17: Germany Kaolin Market Revenue (billion) Forecast, by Application 2020 & 2033
- Table 18: United Kingdom Kaolin Market Revenue (billion) Forecast, by Application 2020 & 2033
- Table 19: France Kaolin Market Revenue (billion) Forecast, by Application 2020 & 2033
- Table 20: Italy Kaolin Market Revenue (billion) Forecast, by Application 2020 & 2033
- Table 21: Rest of Europe Kaolin Market Revenue (billion) Forecast, by Application 2020 & 2033
- Table 22: Global Kaolin Market Revenue billion Forecast, by Application 2020 & 2033
- Table 23: Global Kaolin Market Revenue billion Forecast, by Country 2020 & 2033
- Table 24: Brazil Kaolin Market Revenue (billion) Forecast, by Application 2020 & 2033
- Table 25: Argentina Kaolin Market Revenue (billion) Forecast, by Application 2020 & 2033
- Table 26: Rest of South America Kaolin Market Revenue (billion) Forecast, by Application 2020 & 2033
- Table 27: Global Kaolin Market Revenue billion Forecast, by Application 2020 & 2033
- Table 28: Global Kaolin Market Revenue billion Forecast, by Country 2020 & 2033
- Table 29: Saudi Arabia Kaolin Market Revenue (billion) Forecast, by Application 2020 & 2033
- Table 30: South Africa Kaolin Market Revenue (billion) Forecast, by Application 2020 & 2033
- Table 31: Rest of Middle East and Africa Kaolin Market Revenue (billion) Forecast, by Application 2020 & 2033
Frequently Asked Questions
1. What is the projected Compound Annual Growth Rate (CAGR) of the Kaolin Market?
The projected CAGR is approximately 3.7%.
2. Which companies are prominent players in the Kaolin Market?
Key companies in the market include Koalin AD, KaMin LLC, Thiele Kaolin Company, Quartz Works GmbH, Sibelco, Imerys, BASF SE, EICL, KERAMOST AS.
3. What are the main segments of the Kaolin Market?
The market segments include Application.
4. Can you provide details about the market size?
The market size is estimated to be USD 4.26 billion as of 2022.
5. What are some drivers contributing to market growth?
Increasing Applications in Ceramics and Refractories; Growing Demand from Paper and Rubber Industries; Other Drivers.
6. What are the notable trends driving market growth?
Growing Demand from Paper and Ceramics Industries.
7. Are there any restraints impacting market growth?
Replacement by Other Subsitutes; Other Restraints.
8. Can you provide examples of recent developments in the market?
September 2022: KaMin acquired the Kaolin Minerals Division of BASF. The purchase includes two processing plants, linked mines, and four production locations across middle Georgia, United States.
9. What pricing options are available for accessing the report?
Pricing options include single-user, multi-user, and enterprise licenses priced at USD 4750, USD 5250, and USD 8750 respectively.
10. Is the market size provided in terms of value or volume?
The market size is provided in terms of value, measured in billion.
11. Are there any specific market keywords associated with the report?
Yes, the market keyword associated with the report is "Kaolin Market," which aids in identifying and referencing the specific market segment covered.
12. How do I determine which pricing option suits my needs best?
The pricing options vary based on user requirements and access needs. Individual users may opt for single-user licenses, while businesses requiring broader access may choose multi-user or enterprise licenses for cost-effective access to the report.
13. Are there any additional resources or data provided in the Kaolin Market report?
While the report offers comprehensive insights, it's advisable to review the specific contents or supplementary materials provided to ascertain if additional resources or data are available.
14. How can I stay updated on further developments or reports in the Kaolin Market?
To stay informed about further developments, trends, and reports in the Kaolin Market, consider subscribing to industry newsletters, following relevant companies and organizations, or regularly checking reputable industry news sources and publications.
Methodology
Step 1 - Identification of Relevant Samples Size from Population Database


Step 2 - Approaches for Defining Global Market Size (Value, Volume* & Price*)

Note*: In applicable scenarios
Step 3 - Data Sources
Primary Research
- Web Analytics
- Survey Reports
- Research Institute
- Latest Research Reports
- Opinion Leaders
Secondary Research
- Annual Reports
- White Paper
- Latest Press Release
- Industry Association
- Paid Database
- Investor Presentations

Step 4 - Data Triangulation
Involves using different sources of information in order to increase the validity of a study
These sources are likely to be stakeholders in a program - participants, other researchers, program staff, other community members, and so on.
Then we put all data in single framework & apply various statistical tools to find out the dynamic on the market.
During the analysis stage, feedback from the stakeholder groups would be compared to determine areas of agreement as well as areas of divergence