

Key Insights
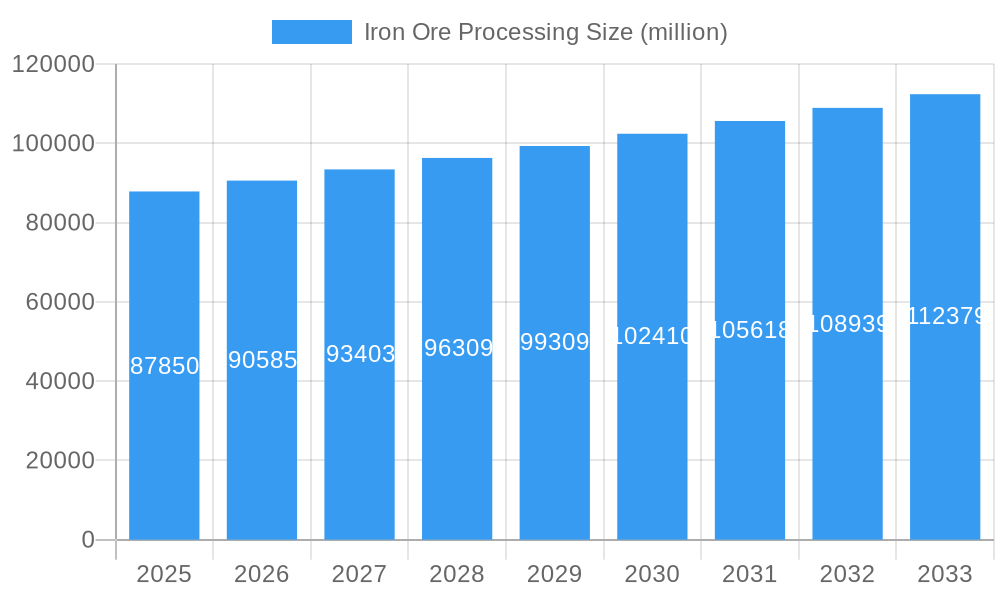
The global Iron Ore Processing market is poised for steady growth, projected to reach an estimated USD 87,850 million by 2025. This expansion is underpinned by a compound annual growth rate (CAGR) of 3.1%, indicating a robust and sustained demand for efficient iron ore processing solutions. The market is primarily driven by the increasing global demand for steel, a critical component in infrastructure development, automotive manufacturing, and various industrial applications. As major economies continue to invest in urbanization and industrialization, the need for high-quality iron ore, processed to specific particle sizes, remains paramount. Companies like Vale, Rio Tinto, and BHP are at the forefront of this market, continuously innovating and expanding their processing capabilities to meet these evolving demands. The market's segmentation by application into Metallurgical and Non-metallurgical uses highlights the diverse downstream applications of processed iron ore, while the categorization by particle size – Coarse, Fine, and Ultra-Fine – reflects the specialized processing techniques required for different end-use industries.
Iron Ore Processing Market Size (In Billion)
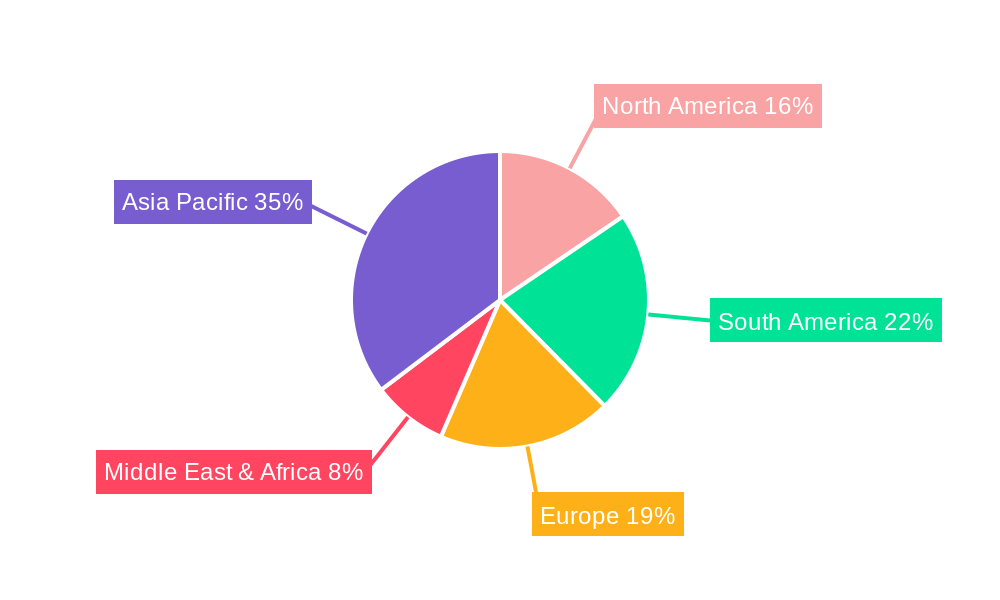
Further analysis reveals that the Asia Pacific region is expected to dominate the market share, driven by the significant industrial output and ongoing infrastructure projects in countries like China and India. North America and Europe also represent substantial markets, with established mining operations and a strong emphasis on advanced processing technologies. The market faces certain restraints, such as fluctuating commodity prices and the environmental impact associated with mining and processing activities. However, technological advancements in beneficiation, flotation, and magnetic separation are continuously being developed to improve efficiency, reduce waste, and enhance the recovery rates of iron ore. These innovations are crucial for overcoming operational challenges and ensuring the sustainable growth of the iron ore processing industry, particularly as the industry moves towards processing lower-grade ores and addressing stricter environmental regulations. The focus on ultra-fine particle processing, in particular, indicates a growing demand for specialized applications and higher purity iron concentrates.
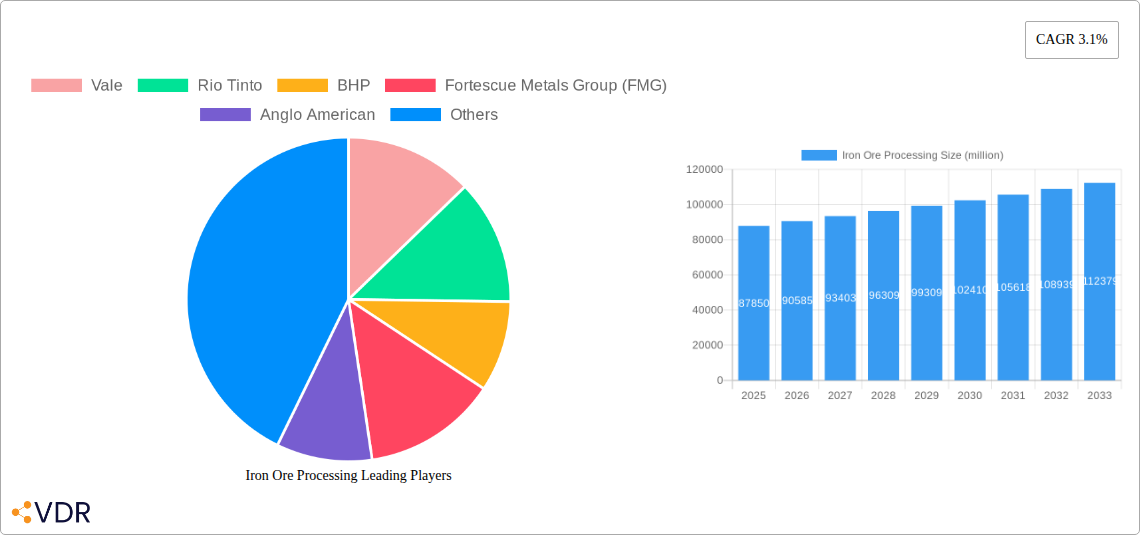
Iron Ore Processing Company Market Share
Comprehensive Iron Ore Processing Market Report: Analysis, Trends, and Future Outlook (2019-2033)
This in-depth report provides a comprehensive analysis of the global iron ore processing market, encompassing coarse particle processing, fine particle processing, and ultra-fine particle processing. We delve into the intricate dynamics, growth trends, dominant segments, product landscape, key drivers, challenges, emerging opportunities, and strategic insights shaping this vital industry. With a meticulous study period from 2019 to 2033, a base year of 2025, and a detailed forecast period of 2025–2033, this report offers unparalleled value to stakeholders in the mining, steel manufacturing, and heavy industry sectors. Gain critical intelligence on market concentration, technological innovations, regulatory frameworks, competitive landscapes, end-user demographics, and M&A activities that are defining the future of iron ore beneficiation and iron ore refining.
Iron Ore Processing Market Dynamics & Structure
The global iron ore processing market exhibits a moderately concentrated structure, with major players like Vale, Rio Tinto, BHP, Fortescue Metals Group (FMG), and Anglo American dominating a significant portion of the market share. Technological innovation is a primary driver, fueled by advancements in crushing, grinding, screening, flotation, and magnetic separation technologies aimed at enhancing recovery rates and reducing operational costs. Stringent environmental regulations, particularly concerning water usage and tailings management, are shaping regulatory frameworks and driving the adoption of sustainable processing methods.
- Market Concentration: A few key players hold substantial market share, leading to a competitive yet somewhat consolidated landscape.
- Technological Innovation Drivers: The pursuit of higher iron ore grades, energy efficiency, and reduced environmental impact are key catalysts for innovation in processing equipment and techniques.
- Regulatory Frameworks: Increasingly stringent environmental laws and sustainability mandates are influencing processing choices and investment in greener technologies.
- Competitive Product Substitutes: While direct substitutes for iron ore are limited in metallurgical applications, advancements in scrap metal recycling and alternative materials for certain construction uses represent indirect competitive pressures.
- End-User Demographics: The primary end-users are steel manufacturers and foundries, with a growing influence from emerging economies demanding higher volumes of processed iron ore.
- M&A Trends: Consolidation activities and strategic partnerships are observed as companies seek to optimize operations, expand their geographical reach, and acquire advanced processing capabilities. An estimated volume of 30-40 M&A deals occurred within the historical period (2019-2024) focused on acquiring processing technologies or expanding operational capacity.
Iron Ore Processing Growth Trends & Insights
The iron ore processing market is poised for significant expansion, driven by robust global demand for steel and infrastructure development. Leveraging advancements in beneficiation processes such as dense medium separation, flotation, and magnetic separation, the market is witnessing a surge in efficiency and product quality. The increasing adoption of digital technologies, including AI-powered analytics for process optimization and IoT sensors for real-time monitoring, is further accelerating growth. The shift towards processing lower-grade ores and the growing importance of sustainability in mining are also key trends influencing market evolution.
- Market Size Evolution: The global iron ore processing market is projected to grow from an estimated USD 25,000 million in 2025 to over USD 32,000 million by 2033, reflecting a compound annual growth rate (CAGR) of approximately 3.2%.
- Adoption Rates: The adoption of advanced ore dressing techniques and automation in processing plants is steadily increasing, with an estimated 45% of major processing facilities incorporating advanced automation in the base year.
- Technological Disruptions: Innovations in commutation technology and particle size reduction are leading to higher yields and reduced energy consumption, transforming traditional processing paradigms.
- Consumer Behavior Shifts: End-users are increasingly demanding higher-grade iron ore concentrates, pushing processors to invest in more sophisticated and efficient processing methods to meet purity standards. This has led to a 10% increase in demand for ultra-fine particle processing solutions.
Dominant Regions, Countries, or Segments in Iron Ore Processing
The global iron ore processing market is significantly influenced by regional demand and the specific processing techniques employed. Australia and Brazil are dominant countries in the coarse particle processing segment (particle size 6-75mm), owing to their vast reserves of high-grade direct shipping ore and established mining infrastructure. These regions benefit from government policies supporting mining exports and significant investments in port and logistics networks.
- Dominant Region: Asia-Pacific, particularly China, remains the largest consumer of processed iron ore due to its massive steel production capacity. However, in terms of processing technology adoption and innovation, Australia and Brazil lead the coarse particle processing segment.
- Dominant Country (by processing advancement): Australia leads in adopting advanced fine particle processing (particle size 0.1-6mm) and ultra-fine particle processing (particle size less than 0.1mm) technologies, driven by the need to process complex ore bodies and meet stringent environmental regulations.
- Dominant Segment (by market share contribution): Metallurgical Uses accounts for the largest share of the iron ore processing market, estimated at over 90%, as the vast majority of processed iron ore is used in the production of steel.
- Key Drivers for Dominance:
- Economic Policies: Favorable mining policies and trade agreements in Australia and Brazil boost their dominance in raw material extraction and primary processing.
- Infrastructure: Extensive port facilities, railway networks, and skilled labor availability in these regions facilitate efficient large-scale iron ore handling.
- Technological Adoption: Early and widespread adoption of advanced mineral processing equipment in Australia and Brazil ensures their leadership in efficient and high-yield processing.
- Market Share: Australia and Brazil collectively hold over 60% of the global iron ore export market, directly translating to their significant influence in the processing stages.
- Growth Potential: The ongoing development of new, complex ore bodies in these regions, alongside advancements in processing technology, indicates continued strong growth potential in the processing sector.
- Non-metallurgical Uses: While a smaller segment, the growth in non-metallurgical uses such as in cement production, fertilizers, and water treatment, presents an emerging opportunity, with North America and Europe showing increasing interest in these applications.
Iron Ore Processing Product Landscape
The iron ore processing product landscape is characterized by continuous innovation in crushing, grinding, and separation technologies. Manufacturers are focusing on developing equipment that offers higher throughput, lower energy consumption, and enhanced ore beneficiation efficiency. Advanced flotation cells, high-efficiency mills, and sophisticated magnetic separators are key product innovations. The performance metrics revolve around improved recovery rates, higher concentrate grades, reduced water usage, and a smaller environmental footprint. Companies like Danieli and China Liming Heavy Industry Science and Technology are at the forefront of introducing more efficient and sustainable processing solutions.
Key Drivers, Barriers & Challenges in Iron Ore Processing
The iron ore processing market is propelled by strong global demand for steel, driven by infrastructure development and industrialization, particularly in emerging economies. Technological advancements in mineral processing techniques that enhance recovery rates and reduce costs are also significant drivers. Furthermore, stricter environmental regulations are paradoxically driving innovation in cleaner processing technologies.
Key Drivers:
- Global Steel Demand: Increased infrastructure projects and automotive manufacturing drive demand.
- Technological Advancements: Improved efficiency and yield from new processing equipment.
- Focus on Higher Grades: Demand for premium iron ore concentrates.
Key Barriers & Challenges:
- Volatile Commodity Prices: Fluctuations in iron ore prices impact investment decisions.
- Environmental Regulations: Compliance with water usage, tailings management, and emissions standards.
- Operating Costs: Energy consumption and maintenance of complex machinery.
- Supply Chain Disruptions: Geopolitical factors and logistical challenges can impact raw material availability and processed ore distribution. An estimated 15% increase in operational costs due to energy price volatility was observed during the historical period.
Emerging Opportunities in Iron Ore Processing
Emerging opportunities in iron ore processing lie in the development and adoption of advanced digitalization and automation solutions, including AI-driven process optimization and predictive maintenance. The growing demand for environmentally friendly mining practices presents an opportunity for companies offering solutions for water recycling and tailings dewatering. Furthermore, the increasing focus on processing complex and low-grade ore bodies necessitates innovative beneficiation techniques, creating a market for specialized processing equipment and services.
Growth Accelerators in the Iron Ore Processing Industry
Key growth accelerators in the iron ore processing industry include significant investments in infrastructure development in developing nations, particularly in Asia and Africa, which directly fuels steel demand. Strategic partnerships and mergers & acquisitions aimed at consolidating expertise and expanding operational capacities are also key drivers. Furthermore, technological breakthroughs in energy-efficient grinding and separation technologies are enhancing profitability and sustainability, making the processing of more challenging ore bodies economically viable.
Key Players Shaping the Iron Ore Processing Market
- Vale
- Rio Tinto
- BHP
- Fortescue Metals Group (FMG)
- Anglo American
- Danieli
- China Liming Heavy Industry Science and Technology
Notable Milestones in Iron Ore Processing Sector
- 2019: Vale announces significant investments in advanced tailings management technologies following dam incidents.
- 2020: Rio Tinto commissions a new, highly automated processing plant in Western Australia, showcasing advancements in operational efficiency.
- 2021: BHP expands its focus on sustainable mining practices, including water conservation in its processing operations.
- 2022: Fortescue Metals Group (FMG) invests in green hydrogen technology, indirectly impacting future energy costs for processing.
- 2023: Danieli unveils a new generation of high-efficiency grinding mills designed to reduce energy consumption by 15%.
- 2024: China Liming Heavy Industry Science and Technology introduces a new range of modular processing plants for enhanced flexibility.
- 2025 (Estimated): Increased adoption of AI-driven predictive maintenance in processing plants across major mining regions.
In-Depth Iron Ore Processing Market Outlook
The future outlook for the iron ore processing market remains exceptionally positive, underpinned by sustained global demand for steel and the ongoing expansion of infrastructure projects worldwide. Growth accelerators will continue to be driven by technological advancements in ore beneficiation and the increasing necessity to process lower-grade and more complex ore bodies efficiently and sustainably. Strategic partnerships, combined with a robust commitment to environmental stewardship, will be crucial for market leaders. The market is projected to see continued innovation in fine and ultra-fine particle processing, addressing the evolving needs of the steel industry and offering lucrative opportunities for stakeholders prepared to invest in cutting-edge mineral processing solutions.
Iron Ore Processing Segmentation
-
1. Application
- 1.1. Metallurgical Uses
- 1.2. Non-metallurgical Uses
-
2. Type
- 2.1. Coarse Particle Processing (particle size 6-75mm)
- 2.2. Fine Particle Processing (particle size 0.1-6mm)
- 2.3. Ultra-Fine Particle Processing (particle size less than 0.1mm)
Iron Ore Processing Segmentation By Geography
-
1. North America
- 1.1. United States
- 1.2. Canada
- 1.3. Mexico
-
2. South America
- 2.1. Brazil
- 2.2. Argentina
- 2.3. Rest of South America
-
3. Europe
- 3.1. United Kingdom
- 3.2. Germany
- 3.3. France
- 3.4. Italy
- 3.5. Spain
- 3.6. Russia
- 3.7. Benelux
- 3.8. Nordics
- 3.9. Rest of Europe
-
4. Middle East & Africa
- 4.1. Turkey
- 4.2. Israel
- 4.3. GCC
- 4.4. North Africa
- 4.5. South Africa
- 4.6. Rest of Middle East & Africa
-
5. Asia Pacific
- 5.1. China
- 5.2. India
- 5.3. Japan
- 5.4. South Korea
- 5.5. ASEAN
- 5.6. Oceania
- 5.7. Rest of Asia Pacific
Iron Ore Processing Regional Market Share
Geographic Coverage of Iron Ore Processing
Iron Ore Processing REPORT HIGHLIGHTS
| Aspects | Details |
|---|---|
| Study Period | 2020-2034 |
| Base Year | 2025 |
| Estimated Year | 2026 |
| Forecast Period | 2026-2034 |
| Historical Period | 2020-2025 |
| Growth Rate | CAGR of 3.1% from 2020-2034 |
| Segmentation |
|
Table of Contents
- 1. Introduction
- 1.1. Research Scope
- 1.2. Market Segmentation
- 1.3. Research Objective
- 1.4. Definitions and Assumptions
- 2. Executive Summary
- 2.1. Market Snapshot
- 3. Market Dynamics
- 3.1. Market Drivers
- 3.2. Market Restrains
- 3.3. Market Trends
- 3.4. Market Opportunities
- 4. Market Factor Analysis
- 4.1. Porters Five Forces
- 4.1.1. Bargaining Power of Suppliers
- 4.1.2. Bargaining Power of Buyers
- 4.1.3. Threat of New Entrants
- 4.1.4. Threat of Substitutes
- 4.1.5. Competitive Rivalry
- 4.2. PESTEL analysis
- 4.3. BCG Analysis
- 4.3.1. Stars (High Growth, High Market Share)
- 4.3.2. Cash Cows (Low Growth, High Market Share)
- 4.3.3. Question Mark (High Growth, Low Market Share)
- 4.3.4. Dogs (Low Growth, Low Market Share)
- 4.4. Ansoff Matrix Analysis
- 4.5. Supply Chain Analysis
- 4.6. Regulatory Landscape
- 4.7. Current Market Potential and Opportunity Assessment (TAM–SAM–SOM Framework)
- 4.8. VDR Analyst Note
- 4.1. Porters Five Forces
- 5. Market Analysis, Insights and Forecast 2021-2033
- 5.1. Market Analysis, Insights and Forecast - by Application
- 5.1.1. Metallurgical Uses
- 5.1.2. Non-metallurgical Uses
- 5.2. Market Analysis, Insights and Forecast - by Type
- 5.2.1. Coarse Particle Processing (particle size 6-75mm)
- 5.2.2. Fine Particle Processing (particle size 0.1-6mm)
- 5.2.3. Ultra-Fine Particle Processing (particle size less than 0.1mm)
- 5.3. Market Analysis, Insights and Forecast - by Region
- 5.3.1. North America
- 5.3.2. South America
- 5.3.3. Europe
- 5.3.4. Middle East & Africa
- 5.3.5. Asia Pacific
- 5.1. Market Analysis, Insights and Forecast - by Application
- 6. Global Iron Ore Processing Analysis, Insights and Forecast, 2021-2033
- 6.1. Market Analysis, Insights and Forecast - by Application
- 6.1.1. Metallurgical Uses
- 6.1.2. Non-metallurgical Uses
- 6.2. Market Analysis, Insights and Forecast - by Type
- 6.2.1. Coarse Particle Processing (particle size 6-75mm)
- 6.2.2. Fine Particle Processing (particle size 0.1-6mm)
- 6.2.3. Ultra-Fine Particle Processing (particle size less than 0.1mm)
- 6.1. Market Analysis, Insights and Forecast - by Application
- 7. North America Iron Ore Processing Analysis, Insights and Forecast, 2021-2033
- 7.1. Market Analysis, Insights and Forecast - by Application
- 7.1.1. Metallurgical Uses
- 7.1.2. Non-metallurgical Uses
- 7.2. Market Analysis, Insights and Forecast - by Type
- 7.2.1. Coarse Particle Processing (particle size 6-75mm)
- 7.2.2. Fine Particle Processing (particle size 0.1-6mm)
- 7.2.3. Ultra-Fine Particle Processing (particle size less than 0.1mm)
- 7.1. Market Analysis, Insights and Forecast - by Application
- 8. South America Iron Ore Processing Analysis, Insights and Forecast, 2021-2033
- 8.1. Market Analysis, Insights and Forecast - by Application
- 8.1.1. Metallurgical Uses
- 8.1.2. Non-metallurgical Uses
- 8.2. Market Analysis, Insights and Forecast - by Type
- 8.2.1. Coarse Particle Processing (particle size 6-75mm)
- 8.2.2. Fine Particle Processing (particle size 0.1-6mm)
- 8.2.3. Ultra-Fine Particle Processing (particle size less than 0.1mm)
- 8.1. Market Analysis, Insights and Forecast - by Application
- 9. Europe Iron Ore Processing Analysis, Insights and Forecast, 2021-2033
- 9.1. Market Analysis, Insights and Forecast - by Application
- 9.1.1. Metallurgical Uses
- 9.1.2. Non-metallurgical Uses
- 9.2. Market Analysis, Insights and Forecast - by Type
- 9.2.1. Coarse Particle Processing (particle size 6-75mm)
- 9.2.2. Fine Particle Processing (particle size 0.1-6mm)
- 9.2.3. Ultra-Fine Particle Processing (particle size less than 0.1mm)
- 9.1. Market Analysis, Insights and Forecast - by Application
- 10. Middle East & Africa Iron Ore Processing Analysis, Insights and Forecast, 2021-2033
- 10.1. Market Analysis, Insights and Forecast - by Application
- 10.1.1. Metallurgical Uses
- 10.1.2. Non-metallurgical Uses
- 10.2. Market Analysis, Insights and Forecast - by Type
- 10.2.1. Coarse Particle Processing (particle size 6-75mm)
- 10.2.2. Fine Particle Processing (particle size 0.1-6mm)
- 10.2.3. Ultra-Fine Particle Processing (particle size less than 0.1mm)
- 10.1. Market Analysis, Insights and Forecast - by Application
- 11. Asia Pacific Iron Ore Processing Analysis, Insights and Forecast, 2021-2033
- 11.1. Market Analysis, Insights and Forecast - by Application
- 11.1.1. Metallurgical Uses
- 11.1.2. Non-metallurgical Uses
- 11.2. Market Analysis, Insights and Forecast - by Type
- 11.2.1. Coarse Particle Processing (particle size 6-75mm)
- 11.2.2. Fine Particle Processing (particle size 0.1-6mm)
- 11.2.3. Ultra-Fine Particle Processing (particle size less than 0.1mm)
- 11.1. Market Analysis, Insights and Forecast - by Application
- 12. Competitive Analysis
- 12.1. Company Profiles
- 12.1.1 Vale
- 12.1.1.1. Company Overview
- 12.1.1.2. Products
- 12.1.1.3. Company Financials
- 12.1.1.4. SWOT Analysis
- 12.1.2 Rio Tinto
- 12.1.2.1. Company Overview
- 12.1.2.2. Products
- 12.1.2.3. Company Financials
- 12.1.2.4. SWOT Analysis
- 12.1.3 BHP
- 12.1.3.1. Company Overview
- 12.1.3.2. Products
- 12.1.3.3. Company Financials
- 12.1.3.4. SWOT Analysis
- 12.1.4 Fortescue Metals Group (FMG)
- 12.1.4.1. Company Overview
- 12.1.4.2. Products
- 12.1.4.3. Company Financials
- 12.1.4.4. SWOT Analysis
- 12.1.5 Anglo American
- 12.1.5.1. Company Overview
- 12.1.5.2. Products
- 12.1.5.3. Company Financials
- 12.1.5.4. SWOT Analysis
- 12.1.6 Danieli
- 12.1.6.1. Company Overview
- 12.1.6.2. Products
- 12.1.6.3. Company Financials
- 12.1.6.4. SWOT Analysis
- 12.1.7 China Liming Heavy Industry Science and Technology
- 12.1.7.1. Company Overview
- 12.1.7.2. Products
- 12.1.7.3. Company Financials
- 12.1.7.4. SWOT Analysis
- 12.1.1 Vale
- 12.2. Market Entropy
- 12.2.1 Company's Key Areas Served
- 12.2.2 Recent Developments
- 12.3. Company Market Share Analysis 2025
- 12.3.1 Top 5 Companies Market Share Analysis
- 12.3.2 Top 3 Companies Market Share Analysis
- 12.4. List of Potential Customers
- 13. Research Methodology
List of Figures
- Figure 1: Global Iron Ore Processing Revenue Breakdown (million, %) by Region 2025 & 2033
- Figure 2: North America Iron Ore Processing Revenue (million), by Application 2025 & 2033
- Figure 3: North America Iron Ore Processing Revenue Share (%), by Application 2025 & 2033
- Figure 4: North America Iron Ore Processing Revenue (million), by Type 2025 & 2033
- Figure 5: North America Iron Ore Processing Revenue Share (%), by Type 2025 & 2033
- Figure 6: North America Iron Ore Processing Revenue (million), by Country 2025 & 2033
- Figure 7: North America Iron Ore Processing Revenue Share (%), by Country 2025 & 2033
- Figure 8: South America Iron Ore Processing Revenue (million), by Application 2025 & 2033
- Figure 9: South America Iron Ore Processing Revenue Share (%), by Application 2025 & 2033
- Figure 10: South America Iron Ore Processing Revenue (million), by Type 2025 & 2033
- Figure 11: South America Iron Ore Processing Revenue Share (%), by Type 2025 & 2033
- Figure 12: South America Iron Ore Processing Revenue (million), by Country 2025 & 2033
- Figure 13: South America Iron Ore Processing Revenue Share (%), by Country 2025 & 2033
- Figure 14: Europe Iron Ore Processing Revenue (million), by Application 2025 & 2033
- Figure 15: Europe Iron Ore Processing Revenue Share (%), by Application 2025 & 2033
- Figure 16: Europe Iron Ore Processing Revenue (million), by Type 2025 & 2033
- Figure 17: Europe Iron Ore Processing Revenue Share (%), by Type 2025 & 2033
- Figure 18: Europe Iron Ore Processing Revenue (million), by Country 2025 & 2033
- Figure 19: Europe Iron Ore Processing Revenue Share (%), by Country 2025 & 2033
- Figure 20: Middle East & Africa Iron Ore Processing Revenue (million), by Application 2025 & 2033
- Figure 21: Middle East & Africa Iron Ore Processing Revenue Share (%), by Application 2025 & 2033
- Figure 22: Middle East & Africa Iron Ore Processing Revenue (million), by Type 2025 & 2033
- Figure 23: Middle East & Africa Iron Ore Processing Revenue Share (%), by Type 2025 & 2033
- Figure 24: Middle East & Africa Iron Ore Processing Revenue (million), by Country 2025 & 2033
- Figure 25: Middle East & Africa Iron Ore Processing Revenue Share (%), by Country 2025 & 2033
- Figure 26: Asia Pacific Iron Ore Processing Revenue (million), by Application 2025 & 2033
- Figure 27: Asia Pacific Iron Ore Processing Revenue Share (%), by Application 2025 & 2033
- Figure 28: Asia Pacific Iron Ore Processing Revenue (million), by Type 2025 & 2033
- Figure 29: Asia Pacific Iron Ore Processing Revenue Share (%), by Type 2025 & 2033
- Figure 30: Asia Pacific Iron Ore Processing Revenue (million), by Country 2025 & 2033
- Figure 31: Asia Pacific Iron Ore Processing Revenue Share (%), by Country 2025 & 2033
List of Tables
- Table 1: Global Iron Ore Processing Revenue million Forecast, by Application 2020 & 2033
- Table 2: Global Iron Ore Processing Revenue million Forecast, by Type 2020 & 2033
- Table 3: Global Iron Ore Processing Revenue million Forecast, by Region 2020 & 2033
- Table 4: Global Iron Ore Processing Revenue million Forecast, by Application 2020 & 2033
- Table 5: Global Iron Ore Processing Revenue million Forecast, by Type 2020 & 2033
- Table 6: Global Iron Ore Processing Revenue million Forecast, by Country 2020 & 2033
- Table 7: United States Iron Ore Processing Revenue (million) Forecast, by Application 2020 & 2033
- Table 8: Canada Iron Ore Processing Revenue (million) Forecast, by Application 2020 & 2033
- Table 9: Mexico Iron Ore Processing Revenue (million) Forecast, by Application 2020 & 2033
- Table 10: Global Iron Ore Processing Revenue million Forecast, by Application 2020 & 2033
- Table 11: Global Iron Ore Processing Revenue million Forecast, by Type 2020 & 2033
- Table 12: Global Iron Ore Processing Revenue million Forecast, by Country 2020 & 2033
- Table 13: Brazil Iron Ore Processing Revenue (million) Forecast, by Application 2020 & 2033
- Table 14: Argentina Iron Ore Processing Revenue (million) Forecast, by Application 2020 & 2033
- Table 15: Rest of South America Iron Ore Processing Revenue (million) Forecast, by Application 2020 & 2033
- Table 16: Global Iron Ore Processing Revenue million Forecast, by Application 2020 & 2033
- Table 17: Global Iron Ore Processing Revenue million Forecast, by Type 2020 & 2033
- Table 18: Global Iron Ore Processing Revenue million Forecast, by Country 2020 & 2033
- Table 19: United Kingdom Iron Ore Processing Revenue (million) Forecast, by Application 2020 & 2033
- Table 20: Germany Iron Ore Processing Revenue (million) Forecast, by Application 2020 & 2033
- Table 21: France Iron Ore Processing Revenue (million) Forecast, by Application 2020 & 2033
- Table 22: Italy Iron Ore Processing Revenue (million) Forecast, by Application 2020 & 2033
- Table 23: Spain Iron Ore Processing Revenue (million) Forecast, by Application 2020 & 2033
- Table 24: Russia Iron Ore Processing Revenue (million) Forecast, by Application 2020 & 2033
- Table 25: Benelux Iron Ore Processing Revenue (million) Forecast, by Application 2020 & 2033
- Table 26: Nordics Iron Ore Processing Revenue (million) Forecast, by Application 2020 & 2033
- Table 27: Rest of Europe Iron Ore Processing Revenue (million) Forecast, by Application 2020 & 2033
- Table 28: Global Iron Ore Processing Revenue million Forecast, by Application 2020 & 2033
- Table 29: Global Iron Ore Processing Revenue million Forecast, by Type 2020 & 2033
- Table 30: Global Iron Ore Processing Revenue million Forecast, by Country 2020 & 2033
- Table 31: Turkey Iron Ore Processing Revenue (million) Forecast, by Application 2020 & 2033
- Table 32: Israel Iron Ore Processing Revenue (million) Forecast, by Application 2020 & 2033
- Table 33: GCC Iron Ore Processing Revenue (million) Forecast, by Application 2020 & 2033
- Table 34: North Africa Iron Ore Processing Revenue (million) Forecast, by Application 2020 & 2033
- Table 35: South Africa Iron Ore Processing Revenue (million) Forecast, by Application 2020 & 2033
- Table 36: Rest of Middle East & Africa Iron Ore Processing Revenue (million) Forecast, by Application 2020 & 2033
- Table 37: Global Iron Ore Processing Revenue million Forecast, by Application 2020 & 2033
- Table 38: Global Iron Ore Processing Revenue million Forecast, by Type 2020 & 2033
- Table 39: Global Iron Ore Processing Revenue million Forecast, by Country 2020 & 2033
- Table 40: China Iron Ore Processing Revenue (million) Forecast, by Application 2020 & 2033
- Table 41: India Iron Ore Processing Revenue (million) Forecast, by Application 2020 & 2033
- Table 42: Japan Iron Ore Processing Revenue (million) Forecast, by Application 2020 & 2033
- Table 43: South Korea Iron Ore Processing Revenue (million) Forecast, by Application 2020 & 2033
- Table 44: ASEAN Iron Ore Processing Revenue (million) Forecast, by Application 2020 & 2033
- Table 45: Oceania Iron Ore Processing Revenue (million) Forecast, by Application 2020 & 2033
- Table 46: Rest of Asia Pacific Iron Ore Processing Revenue (million) Forecast, by Application 2020 & 2033
Frequently Asked Questions
1. What is the projected Compound Annual Growth Rate (CAGR) of the Iron Ore Processing?
The projected CAGR is approximately 3.1%.
2. Which companies are prominent players in the Iron Ore Processing?
Key companies in the market include Vale, Rio Tinto, BHP, Fortescue Metals Group (FMG), Anglo American, Danieli, China Liming Heavy Industry Science and Technology.
3. What are the main segments of the Iron Ore Processing?
The market segments include Application, Type.
4. Can you provide details about the market size?
The market size is estimated to be USD 87850 million as of 2022.
5. What are some drivers contributing to market growth?
N/A
6. What are the notable trends driving market growth?
N/A
7. Are there any restraints impacting market growth?
N/A
8. Can you provide examples of recent developments in the market?
N/A
9. What pricing options are available for accessing the report?
Pricing options include single-user, multi-user, and enterprise licenses priced at USD 3950.00, USD 5925.00, and USD 7900.00 respectively.
10. Is the market size provided in terms of value or volume?
The market size is provided in terms of value, measured in million.
11. Are there any specific market keywords associated with the report?
Yes, the market keyword associated with the report is "Iron Ore Processing," which aids in identifying and referencing the specific market segment covered.
12. How do I determine which pricing option suits my needs best?
The pricing options vary based on user requirements and access needs. Individual users may opt for single-user licenses, while businesses requiring broader access may choose multi-user or enterprise licenses for cost-effective access to the report.
13. Are there any additional resources or data provided in the Iron Ore Processing report?
While the report offers comprehensive insights, it's advisable to review the specific contents or supplementary materials provided to ascertain if additional resources or data are available.
14. How can I stay updated on further developments or reports in the Iron Ore Processing?
To stay informed about further developments, trends, and reports in the Iron Ore Processing, consider subscribing to industry newsletters, following relevant companies and organizations, or regularly checking reputable industry news sources and publications.
Methodology
Step 1 - Identification of Relevant Samples Size from Population Database


Step 2 - Approaches for Defining Global Market Size (Value, Volume* & Price*)

Note*: In applicable scenarios
Step 3 - Data Sources
Primary Research
- Web Analytics
- Survey Reports
- Research Institute
- Latest Research Reports
- Opinion Leaders
Secondary Research
- Annual Reports
- White Paper
- Latest Press Release
- Industry Association
- Paid Database
- Investor Presentations

Step 4 - Data Triangulation
Involves using different sources of information in order to increase the validity of a study
These sources are likely to be stakeholders in a program - participants, other researchers, program staff, other community members, and so on.
Then we put all data in single framework & apply various statistical tools to find out the dynamic on the market.
During the analysis stage, feedback from the stakeholder groups would be compared to determine areas of agreement as well as areas of divergence