
Key Insights
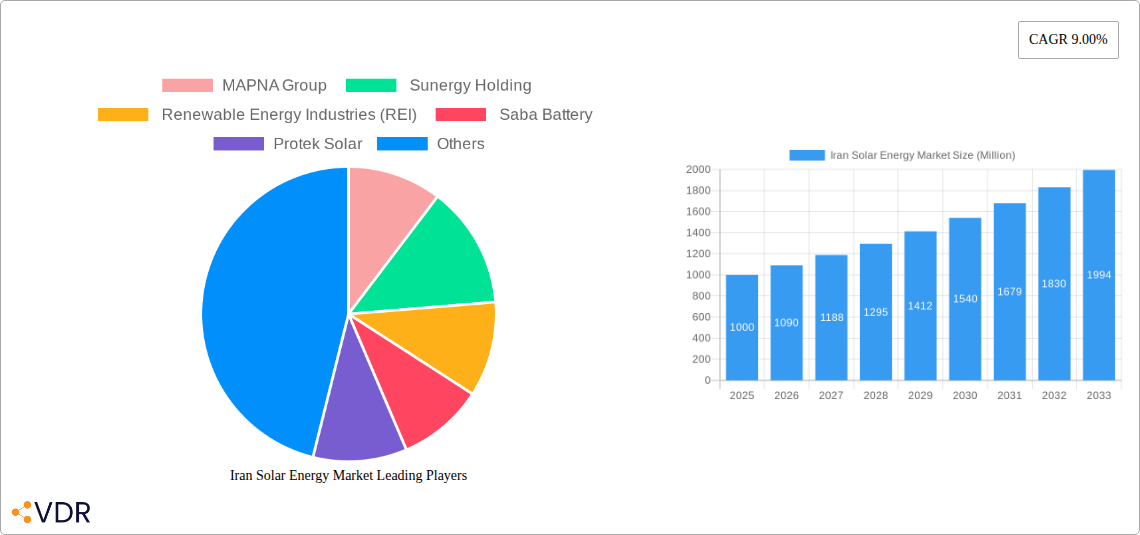
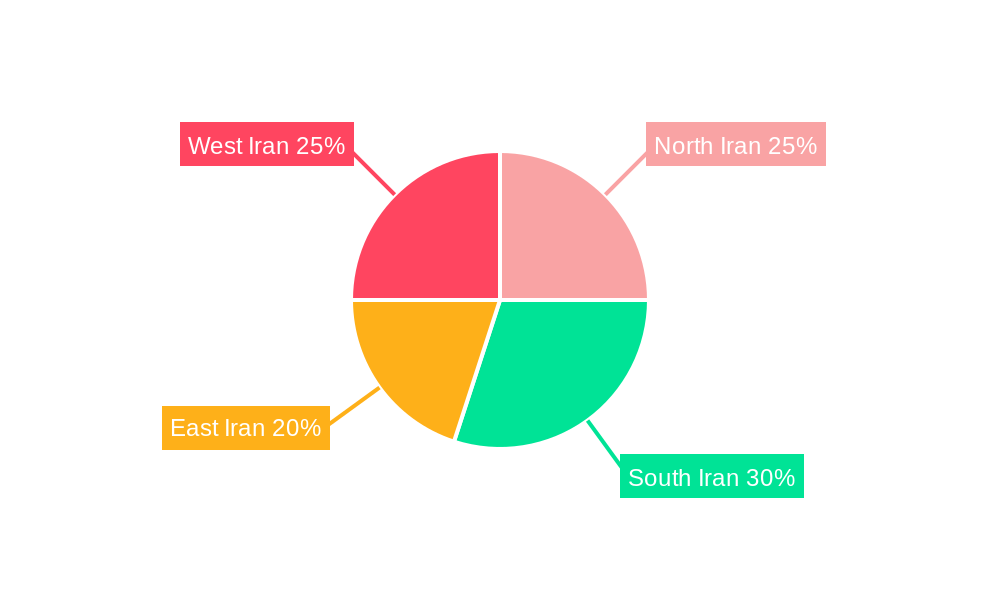
The Iran solar energy market, exhibiting a robust Compound Annual Growth Rate (CAGR) of 9%, presents a compelling investment opportunity. Driven by increasing electricity demand, government initiatives promoting renewable energy adoption to mitigate reliance on fossil fuels, and decreasing solar panel costs, the market is poised for significant expansion between 2025 and 2033. The automotive, industrial, and portable segments are key application areas, fueling market growth. While geographical variations exist across Iran's regions (North, South, East, West), the overall market shows substantial promise. Key players like MAPNA Group, Sunergy Holding, Renewable Energy Industries (REI), Saba Battery, and Protek Solar are driving innovation and competition, leading to technological advancements and improved efficiency within the sector. Despite potential restraints such as initial investment costs and grid integration challenges, the long-term growth outlook remains positive, fueled by supportive government policies and a growing awareness of the environmental and economic benefits of solar energy.
The market's historical performance (2019-2024) indicates a steadily increasing adoption of solar energy solutions, laying a solid foundation for future growth. The forecast period (2025-2033) projects a sustained expansion, with a particular focus on large-scale solar power projects to meet the nation's growing energy demands. The segmental breakdown reveals the automotive and industrial sectors as significant contributors, reflecting the increasing electrification of vehicles and the adoption of solar solutions in industrial processes. Further growth will be influenced by advancements in energy storage technologies and improved grid infrastructure, which are likely to ease current restraints and unlock new market opportunities. Government incentives and policies aimed at promoting renewable energy will further stimulate market growth, making Iran's solar energy sector an attractive prospect for both domestic and international players.
Iran Solar Energy Market: A Comprehensive Report (2019-2033)
This comprehensive report provides an in-depth analysis of the Iranian solar energy market, encompassing historical data (2019-2024), current estimates (2025), and future projections (2025-2033). It examines market dynamics, growth trends, dominant segments, key players, and emerging opportunities within this rapidly evolving sector. The report is crucial for investors, industry professionals, and policymakers seeking a complete understanding of the Iranian solar energy landscape. The parent market is the broader Iranian renewable energy sector, while the child market focuses specifically on solar power generation and its applications.
Iran Solar Energy Market Dynamics & Structure
This section analyzes the market's competitive landscape, technological advancements, regulatory environment, and market forces. The Iranian solar energy market is characterized by a mix of established players and emerging companies. Market concentration is currently [xx]% with the top 3 players holding approximately [xx]% market share. Key factors influencing market dynamics include:
- Technological Innovation: Continuous advancements in solar panel efficiency, energy storage solutions, and smart grid technologies are driving market growth. However, barriers to innovation include access to advanced materials and technology transfer restrictions.
- Regulatory Framework: Government policies and incentives play a significant role. Recent legislation supporting renewable energy integration and the pursuit of International Solar Alliance (ISA) membership are positive indicators. However, bureaucratic hurdles and inconsistent policy implementation remain challenges.
- Competitive Landscape: The market exhibits both domestic and international competition. The entry of new players, particularly in manufacturing, is intensifying competition. M&A activity is relatively low, with [xx] deals recorded between 2019 and 2024.
- End-User Demographics: The industrial sector currently dominates, but growth is anticipated in the automotive and portable segments. Government initiatives promoting rooftop solar installations are also expanding the residential user base.
- Substitute Products: While solar energy is a relatively strong contender, traditional fossil fuels still compete for market share, particularly given concerns about grid stability and intermittent renewable generation.
Iran Solar Energy Market Growth Trends & Insights
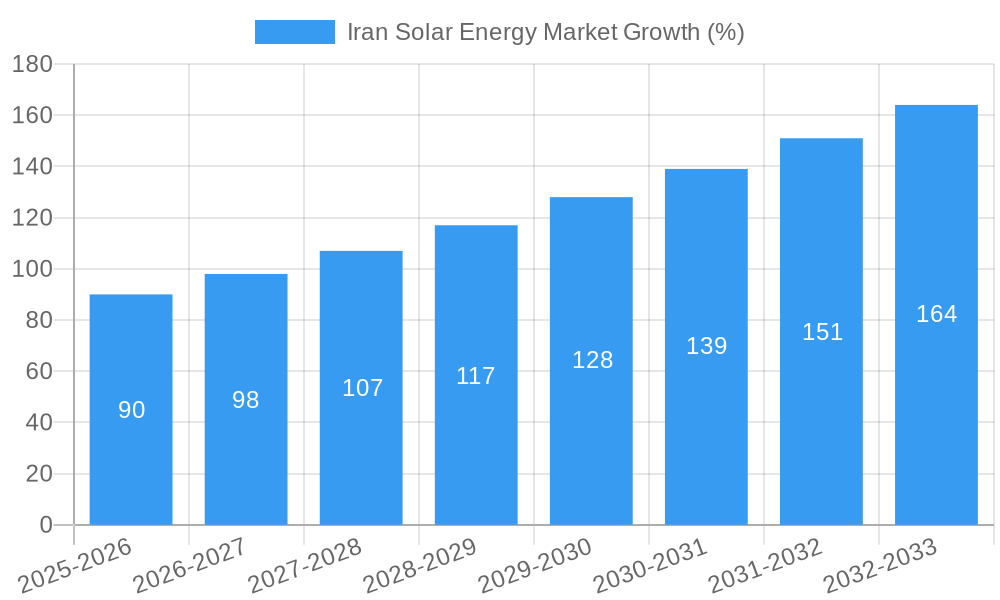
The Iranian solar energy market is experiencing significant growth, driven by increasing energy demand, government support for renewable energy, and decreasing solar energy costs. The market size expanded from [xx] Million USD in 2019 to [xx] Million USD in 2024, with a CAGR of [xx]%. We project the market to reach [xx] Million USD by 2025 and [xx] Million USD by 2033, driven by a [xx]% CAGR during the forecast period. This growth is fueled by increasing adoption rates across various sectors, including a projected [xx]% market penetration in the industrial segment by 2033. Technological disruptions, such as improvements in solar cell efficiency and battery storage technologies, are accelerating market adoption. Shifts in consumer behavior towards sustainable energy solutions are also impacting growth.
Dominant Regions, Countries, or Segments in Iran Solar Energy Market
The industrial sector is currently the dominant segment in the Iranian solar energy market, holding [xx]% market share in 2024. This dominance is attributed to:
- High Energy Consumption: Industrial facilities have a high energy demand making solar energy an attractive alternative.
- Government Incentives: Targeted incentives and subsidies directed towards industrial solar energy projects.
- Infrastructure Development: Existing industrial infrastructure facilitates easier solar energy integration.
- Economies of Scale: Large-scale projects in industrial settings offer economies of scale, reducing costs.
However, the portable and automotive segments are poised for significant growth in the coming years, driven by advancements in battery technology and government policies supporting electric vehicles. We project the Industrial segment to maintain dominance but with other segments rapidly increasing their market share. Key growth drivers are: favorable government policies, improvements in grid infrastructure, and falling solar technology costs.
Iran Solar Energy Market Product Landscape
The Iranian solar energy market features a range of products, including photovoltaic (PV) panels, solar inverters, solar trackers, and energy storage systems. Recent advancements focus on improving PV panel efficiency, developing more durable and reliable components, and enhancing energy storage capabilities. Key product innovations include [mention specific innovations, if available, otherwise use placeholders like "high-efficiency monocrystalline PV modules" and "advanced battery storage solutions"]. These advancements are leading to improved performance metrics, such as increased power output, longer lifespan, and greater energy storage capacity.
Key Drivers, Barriers & Challenges in Iran Solar Energy Market
Key Drivers:
- Government Support: Policies promoting renewable energy adoption, including financial incentives and feed-in tariffs, are major drivers.
- Falling Costs: The declining cost of solar technology is making it more economically viable.
- Energy Security Concerns: Reducing reliance on imported fossil fuels and improving energy independence.
Key Barriers & Challenges:
- Financial Constraints: Access to funding remains a hurdle for many projects. This includes both access to capital for companies and individuals seeking solar systems.
- Grid Integration Issues: Integrating large amounts of intermittent renewable energy into the existing grid requires significant infrastructure upgrades.
- Import Restrictions and Sanctions: Sanctions imposed on Iran have affected access to some essential technologies and equipment. [Quantify the impact, e.g., "leading to a [xx]% increase in project costs"].
Emerging Opportunities in Iran Solar Energy Market
Significant opportunities exist in untapped markets, including residential and agricultural sectors. Growth is projected in off-grid solar solutions for rural areas and the integration of solar power into smart grids. The burgeoning electric vehicle market presents a considerable opportunity for solar-powered charging stations. The development of hybrid systems that combine solar energy with other renewable sources also shows promise.
Growth Accelerators in the Iran Solar Energy Market Industry
Technological advancements in solar cell efficiency and energy storage are key growth accelerators. Strategic partnerships between domestic and international companies are vital for technology transfer and market development. Government policies supporting renewable energy integration and large-scale solar projects are critical drivers of long-term market growth. The expansion of the electric vehicle market significantly boosts demand for solar-powered charging infrastructure.
Key Players Shaping the Iran Solar Energy Market Market
- MAPNA Group
- Sunergy Holding
- Renewable Energy Industries (REI)
- Saba Battery
- Protek Solar
Notable Milestones in Iran Solar Energy Market Sector
- July 2022: Inauguration of Iran's first solar panel manufacturing plant (Mana Energy Pak Private Limited) with an initial capacity of 500 MW, expandable to 1.5 GW. This significantly boosts domestic manufacturing capabilities and reduces reliance on imports.
- January 2023: Submission of a bill to parliament seeking approval for joining the International Solar Alliance (ISA). This signifies a strong commitment to international collaboration and the acceleration of solar energy deployment.
In-Depth Iran Solar Energy Market Market Outlook
The Iranian solar energy market holds immense potential for growth driven by supportive government policies, decreasing technology costs, and increasing energy demand. Strategic investments in research and development, grid infrastructure upgrades, and capacity building are essential to unlock this potential fully. The market's future success hinges on overcoming challenges related to financing, sanctions, and grid integration. Focus on developing domestic manufacturing capabilities and fostering public-private partnerships will be key for sustainable long-term growth.
Iran Solar Energy Market Segmentation
- 1. Production Analysis
- 2. Consumption Analysis
- 3. Import Market Analysis (Value & Volume)
- 4. Export Market Analysis (Value & Volume)
- 5. Price Trend Analysis
Iran Solar Energy Market Segmentation By Geography
- 1. Iran
Iran Solar Energy Market REPORT HIGHLIGHTS
| Aspects | Details |
|---|---|
| Study Period | 2019-2033 |
| Base Year | 2024 |
| Estimated Year | 2025 |
| Forecast Period | 2025-2033 |
| Historical Period | 2019-2024 |
| Growth Rate | CAGR of 9.00% from 2019-2033 |
| Segmentation |
|
Table of Contents
- 1. Introduction
- 1.1. Research Scope
- 1.2. Market Segmentation
- 1.3. Research Methodology
- 1.4. Definitions and Assumptions
- 2. Executive Summary
- 2.1. Introduction
- 3. Market Dynamics
- 3.1. Introduction
- 3.2. Market Drivers
- 3.2.1. 4.; Growing Power Demand4.; Growth of Renewables
- 3.3. Market Restrains
- 3.3.1. 4.; Unstable Political Scenario of the Country
- 3.4. Market Trends
- 3.4.1. Solar Photovoltaic (PV) to Dominate the Market
- 4. Market Factor Analysis
- 4.1. Porters Five Forces
- 4.2. Supply/Value Chain
- 4.3. PESTEL analysis
- 4.4. Market Entropy
- 4.5. Patent/Trademark Analysis
- 5. Iran Solar Energy Market Analysis, Insights and Forecast, 2019-2031
- 5.1. Market Analysis, Insights and Forecast - by Production Analysis
- 5.2. Market Analysis, Insights and Forecast - by Consumption Analysis
- 5.3. Market Analysis, Insights and Forecast - by Import Market Analysis (Value & Volume)
- 5.4. Market Analysis, Insights and Forecast - by Export Market Analysis (Value & Volume)
- 5.5. Market Analysis, Insights and Forecast - by Price Trend Analysis
- 5.6. Market Analysis, Insights and Forecast - by Region
- 5.6.1. Iran
- 5.1. Market Analysis, Insights and Forecast - by Production Analysis
- 6. North Iran Solar Energy Market Analysis, Insights and Forecast, 2019-2031
- 7. South Iran Solar Energy Market Analysis, Insights and Forecast, 2019-2031
- 8. East Iran Solar Energy Market Analysis, Insights and Forecast, 2019-2031
- 9. West Iran Solar Energy Market Analysis, Insights and Forecast, 2019-2031
- 10. Competitive Analysis
- 10.1. Market Share Analysis 2024
- 10.2. Company Profiles
- 10.2.1 MAPNA Group
- 10.2.1.1. Overview
- 10.2.1.2. Products
- 10.2.1.3. SWOT Analysis
- 10.2.1.4. Recent Developments
- 10.2.1.5. Financials (Based on Availability)
- 10.2.2 Sunergy Holding
- 10.2.2.1. Overview
- 10.2.2.2. Products
- 10.2.2.3. SWOT Analysis
- 10.2.2.4. Recent Developments
- 10.2.2.5. Financials (Based on Availability)
- 10.2.3 Renewable Energy Industries (REI)
- 10.2.3.1. Overview
- 10.2.3.2. Products
- 10.2.3.3. SWOT Analysis
- 10.2.3.4. Recent Developments
- 10.2.3.5. Financials (Based on Availability)
- 10.2.4 Saba Battery
- 10.2.4.1. Overview
- 10.2.4.2. Products
- 10.2.4.3. SWOT Analysis
- 10.2.4.4. Recent Developments
- 10.2.4.5. Financials (Based on Availability)
- 10.2.5 Protek Solar
- 10.2.5.1. Overview
- 10.2.5.2. Products
- 10.2.5.3. SWOT Analysis
- 10.2.5.4. Recent Developments
- 10.2.5.5. Financials (Based on Availability)
- 10.2.1 MAPNA Group
List of Figures
- Figure 1: Iran Solar Energy Market Revenue Breakdown (Million, %) by Product 2024 & 2032
- Figure 2: Iran Solar Energy Market Share (%) by Company 2024
List of Tables
- Table 1: Iran Solar Energy Market Revenue Million Forecast, by Region 2019 & 2032
- Table 2: Iran Solar Energy Market Volume watts per unit volume Forecast, by Region 2019 & 2032
- Table 3: Iran Solar Energy Market Revenue Million Forecast, by Production Analysis 2019 & 2032
- Table 4: Iran Solar Energy Market Volume watts per unit volume Forecast, by Production Analysis 2019 & 2032
- Table 5: Iran Solar Energy Market Revenue Million Forecast, by Consumption Analysis 2019 & 2032
- Table 6: Iran Solar Energy Market Volume watts per unit volume Forecast, by Consumption Analysis 2019 & 2032
- Table 7: Iran Solar Energy Market Revenue Million Forecast, by Import Market Analysis (Value & Volume) 2019 & 2032
- Table 8: Iran Solar Energy Market Volume watts per unit volume Forecast, by Import Market Analysis (Value & Volume) 2019 & 2032
- Table 9: Iran Solar Energy Market Revenue Million Forecast, by Export Market Analysis (Value & Volume) 2019 & 2032
- Table 10: Iran Solar Energy Market Volume watts per unit volume Forecast, by Export Market Analysis (Value & Volume) 2019 & 2032
- Table 11: Iran Solar Energy Market Revenue Million Forecast, by Price Trend Analysis 2019 & 2032
- Table 12: Iran Solar Energy Market Volume watts per unit volume Forecast, by Price Trend Analysis 2019 & 2032
- Table 13: Iran Solar Energy Market Revenue Million Forecast, by Region 2019 & 2032
- Table 14: Iran Solar Energy Market Volume watts per unit volume Forecast, by Region 2019 & 2032
- Table 15: Iran Solar Energy Market Revenue Million Forecast, by Country 2019 & 2032
- Table 16: Iran Solar Energy Market Volume watts per unit volume Forecast, by Country 2019 & 2032
- Table 17: North Iran Solar Energy Market Revenue (Million) Forecast, by Application 2019 & 2032
- Table 18: North Iran Solar Energy Market Volume (watts per unit volume) Forecast, by Application 2019 & 2032
- Table 19: South Iran Solar Energy Market Revenue (Million) Forecast, by Application 2019 & 2032
- Table 20: South Iran Solar Energy Market Volume (watts per unit volume) Forecast, by Application 2019 & 2032
- Table 21: East Iran Solar Energy Market Revenue (Million) Forecast, by Application 2019 & 2032
- Table 22: East Iran Solar Energy Market Volume (watts per unit volume) Forecast, by Application 2019 & 2032
- Table 23: West Iran Solar Energy Market Revenue (Million) Forecast, by Application 2019 & 2032
- Table 24: West Iran Solar Energy Market Volume (watts per unit volume) Forecast, by Application 2019 & 2032
- Table 25: Iran Solar Energy Market Revenue Million Forecast, by Production Analysis 2019 & 2032
- Table 26: Iran Solar Energy Market Volume watts per unit volume Forecast, by Production Analysis 2019 & 2032
- Table 27: Iran Solar Energy Market Revenue Million Forecast, by Consumption Analysis 2019 & 2032
- Table 28: Iran Solar Energy Market Volume watts per unit volume Forecast, by Consumption Analysis 2019 & 2032
- Table 29: Iran Solar Energy Market Revenue Million Forecast, by Import Market Analysis (Value & Volume) 2019 & 2032
- Table 30: Iran Solar Energy Market Volume watts per unit volume Forecast, by Import Market Analysis (Value & Volume) 2019 & 2032
- Table 31: Iran Solar Energy Market Revenue Million Forecast, by Export Market Analysis (Value & Volume) 2019 & 2032
- Table 32: Iran Solar Energy Market Volume watts per unit volume Forecast, by Export Market Analysis (Value & Volume) 2019 & 2032
- Table 33: Iran Solar Energy Market Revenue Million Forecast, by Price Trend Analysis 2019 & 2032
- Table 34: Iran Solar Energy Market Volume watts per unit volume Forecast, by Price Trend Analysis 2019 & 2032
- Table 35: Iran Solar Energy Market Revenue Million Forecast, by Country 2019 & 2032
- Table 36: Iran Solar Energy Market Volume watts per unit volume Forecast, by Country 2019 & 2032
Frequently Asked Questions
1. What is the projected Compound Annual Growth Rate (CAGR) of the Iran Solar Energy Market?
The projected CAGR is approximately 9.00%.
2. Which companies are prominent players in the Iran Solar Energy Market?
Key companies in the market include MAPNA Group , Sunergy Holding , Renewable Energy Industries (REI) , Saba Battery , Protek Solar.
3. What are the main segments of the Iran Solar Energy Market?
The market segments include Production Analysis, Consumption Analysis, Import Market Analysis (Value & Volume), Export Market Analysis (Value & Volume), Price Trend Analysis.
4. Can you provide details about the market size?
The market size is estimated to be USD XX Million as of 2022.
5. What are some drivers contributing to market growth?
4.; Growing Power Demand4.; Growth of Renewables.
6. What are the notable trends driving market growth?
Solar Photovoltaic (PV) to Dominate the Market.
7. Are there any restraints impacting market growth?
4.; Unstable Political Scenario of the Country.
8. Can you provide examples of recent developments in the market?
January 2023: Iranian authorities submitted a bill to parliament seeking approval for the International Solar Alliance. The International Solar Alliance (ISA) is an action-oriented platform that members drive and that promotes increased deployment of solar energy technologies, in addition to ensuring energy accessibility and security.
9. What pricing options are available for accessing the report?
Pricing options include single-user, multi-user, and enterprise licenses priced at USD 3800, USD 4500, and USD 5800 respectively.
10. Is the market size provided in terms of value or volume?
The market size is provided in terms of value, measured in Million and volume, measured in watts per unit volume.
11. Are there any specific market keywords associated with the report?
Yes, the market keyword associated with the report is "Iran Solar Energy Market," which aids in identifying and referencing the specific market segment covered.
12. How do I determine which pricing option suits my needs best?
The pricing options vary based on user requirements and access needs. Individual users may opt for single-user licenses, while businesses requiring broader access may choose multi-user or enterprise licenses for cost-effective access to the report.
13. Are there any additional resources or data provided in the Iran Solar Energy Market report?
While the report offers comprehensive insights, it's advisable to review the specific contents or supplementary materials provided to ascertain if additional resources or data are available.
14. How can I stay updated on further developments or reports in the Iran Solar Energy Market?
To stay informed about further developments, trends, and reports in the Iran Solar Energy Market, consider subscribing to industry newsletters, following relevant companies and organizations, or regularly checking reputable industry news sources and publications.
Methodology
Step 1 - Identification of Relevant Samples Size from Population Database


Step 2 - Approaches for Defining Global Market Size (Value, Volume* & Price*)

Note*: In applicable scenarios
Step 3 - Data Sources
Primary Research
- Web Analytics
- Survey Reports
- Research Institute
- Latest Research Reports
- Opinion Leaders
Secondary Research
- Annual Reports
- White Paper
- Latest Press Release
- Industry Association
- Paid Database
- Investor Presentations

Step 4 - Data Triangulation
Involves using different sources of information in order to increase the validity of a study
These sources are likely to be stakeholders in a program - participants, other researchers, program staff, other community members, and so on.
Then we put all data in single framework & apply various statistical tools to find out the dynamic on the market.
During the analysis stage, feedback from the stakeholder groups would be compared to determine areas of agreement as well as areas of divergence


