Regional Insights into IPM Pheromone Products Industry Market Growth

IPM Pheromone Products Industry by Production Analysis, by Consumption Analysis, by Import Market Analysis (Value & Volume), by Export Market Analysis (Value & Volume), by Price Trend Analysis, by North America (United States, Canada, Mexico), by South America (Brazil, Argentina, Rest of South America), by Europe (United Kingdom, Germany, France, Italy, Spain, Russia, Benelux, Nordics, Rest of Europe), by Middle East & Africa (Turkey, Israel, GCC, North Africa, South Africa, Rest of Middle East & Africa), by Asia Pacific (China, India, Japan, South Korea, ASEAN, Oceania, Rest of Asia Pacific) Forecast 2025-2033

Jul 11 2025
Base Year: 2024

197 Pages
Main Logo

Regional Insights into IPM Pheromone Products Industry Market Growth


Home
Industries
Agriculture
sponsor image

Tailored for you

  • In-depth Analysis Tailored to Specified Regions or Segments
  • Company Profiles Customized to User Preferences
  • Comprehensive Insights Focused on Specific Segments or Regions
  • Customized Evaluation of Competitive Landscape to Meet Your Needs
  • Tailored Customization to Address Other Specific Requirements
Ask for customization


Key Insights

The Integrated Pest Management (IPM) pheromone products market is experiencing robust growth, projected to reach a substantial size driven by increasing demand for environmentally friendly pest control solutions. The market's Compound Annual Growth Rate (CAGR) of 10.50% from 2019 to 2024 indicates a significant upward trajectory. This growth is fueled by several key factors. Firstly, the rising awareness of the negative environmental impacts of traditional pesticides is driving a shift towards sustainable alternatives like pheromone-based IPM. Secondly, the increasing prevalence of pest resistance to conventional pesticides necessitates the adoption of innovative pest control strategies, making pheromone-based solutions increasingly attractive. Furthermore, the growing adoption of precision agriculture and the increasing demand for high-quality agricultural produce are also contributing to market expansion. The market is segmented by type (pheromones, aggregation pheromones, others), function (mating disruption, detection and monitoring, mass trapping), mode of application (traps, lures, dispensers), and crops (field crops, vegetable crops, other crops). The major players in this market – including Russell IPM, Sutter, Syngenta Bioline, and others – are continuously investing in research and development to improve the efficacy and cost-effectiveness of their products, further boosting market growth. Geographical segmentation reveals strong growth potential across North America, Europe, and the Asia-Pacific region, driven by factors like stringent regulations on pesticide use and rising agricultural output in these areas.
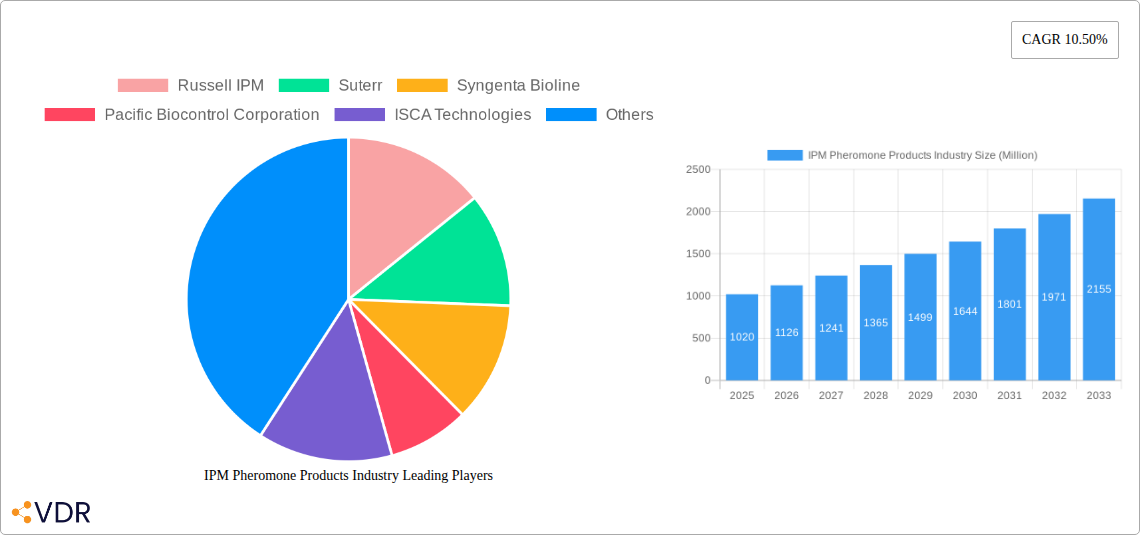
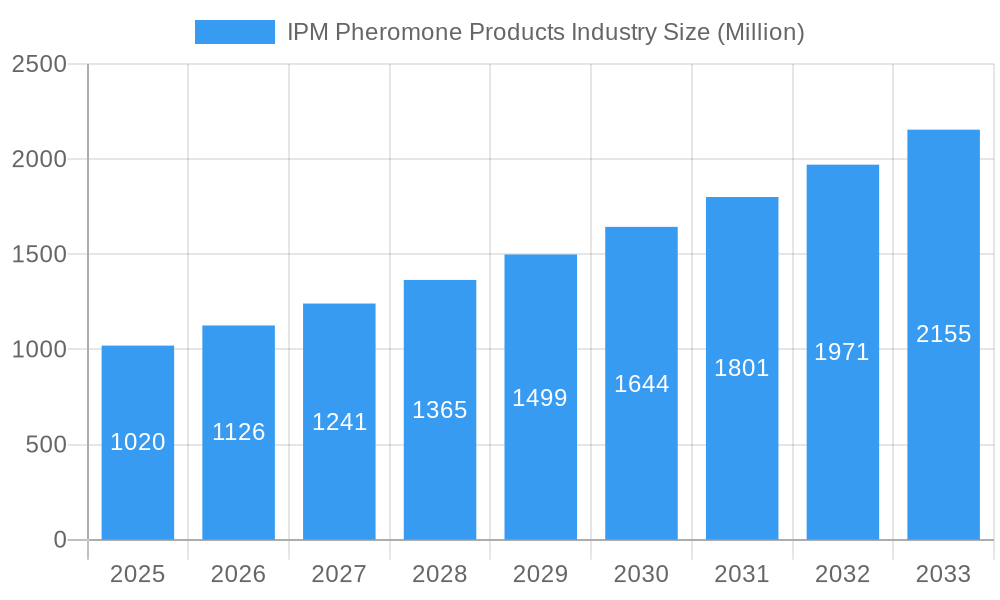
The continued expansion of the IPM pheromone products market is anticipated throughout the forecast period (2025-2033). Market segmentation offers lucrative opportunities for specialized product development. For instance, the demand for pheromones targeting specific pests in high-value crops such as vegetables is expected to remain strong. The development of advanced dispensing technologies and improved pheromone formulations is likely to drive further market growth. Moreover, government initiatives promoting sustainable agriculture and supporting the adoption of IPM strategies will play a vital role in shaping the market's trajectory. However, factors like the relatively high cost of pheromone-based products compared to conventional pesticides and potential challenges in the widespread adoption of these technologies in developing countries could present some limitations to market expansion. Nevertheless, the overall outlook for the IPM pheromone products market remains positive, driven by the increasing need for effective, sustainable, and environmentally responsible pest management solutions.

IPM Pheromone Products Industry Research Report - Market Size, Growth & Forecast

IPM Pheromone Products Industry Market Report: 2019-2033

This comprehensive report provides a detailed analysis of the IPM (Integrated Pest Management) Pheromone Products industry, encompassing market dynamics, growth trends, regional analysis, product landscape, key players, and future outlook. The study period covers 2019-2033, with a base year of 2025 and a forecast period of 2025-2033. The report analyzes the parent market of pest control and the child market of pheromone-based pest management solutions, offering invaluable insights for industry professionals, investors, and researchers. Market values are presented in Million units.

IPM Pheromone Products Industry Market Dynamics & Structure

The IPM Pheromone Products market is characterized by moderate concentration, with key players like Russell IPM, Suterr, Syngenta Bioline, Pacific Biocontrol Corporation, ISCA Technologies, Shin-Etsu, Hercon Environmental, Sumi Agro France, Isagro, and BASF SE holding significant market share. Technological innovation, particularly in pheromone formulation and delivery systems, is a major driver. Regulatory frameworks vary across regions, influencing product approvals and market access. Biopesticides and other IPM techniques represent competitive substitutes. The end-user demographic includes agricultural producers, government agencies, and pest management professionals. M&A activity has been relatively moderate in recent years, with approximately xx deals recorded between 2019 and 2024, resulting in a market share shift of approximately xx%.

  • Market Concentration: Moderately concentrated, with top 5 players holding approximately xx% of the market share in 2024.
  • Technological Innovation: Focus on improved pheromone efficacy, longer-lasting formulations, and environmentally friendly delivery systems.
  • Regulatory Landscape: Varying regulations across geographies impact market entry and product approvals.
  • Competitive Substitutes: Biopesticides and other IPM strategies compete with pheromone products.
  • M&A Activity: Approximately xx M&A deals between 2019-2024, leading to a xx% shift in market share.
  • Innovation Barriers: High R&D costs and lengthy regulatory approval processes hinder innovation.

IPM Pheromone Products Industry Growth Trends & Insights

The global IPM Pheromone Products market experienced substantial growth during the historical period (2019-2024), exhibiting a CAGR of xx%. This growth is attributed to the increasing adoption of sustainable pest management practices, driven by growing consumer awareness of environmental concerns and stricter regulations on synthetic pesticides. The market is projected to maintain a robust growth trajectory during the forecast period (2025-2033), with a projected CAGR of xx%, reaching a market size of xx Million units by 2033. Technological advancements, such as the development of more effective and longer-lasting pheromone formulations, are further fueling market expansion. Consumer behavior shifts towards environmentally friendly products and increasing demand for higher-quality produce also contribute to the market growth. Market penetration is expected to increase from xx% in 2024 to xx% by 2033.

IPM Pheromone Products Industry Growth

Dominant Regions, Countries, or Segments in IPM Pheromone Products Industry

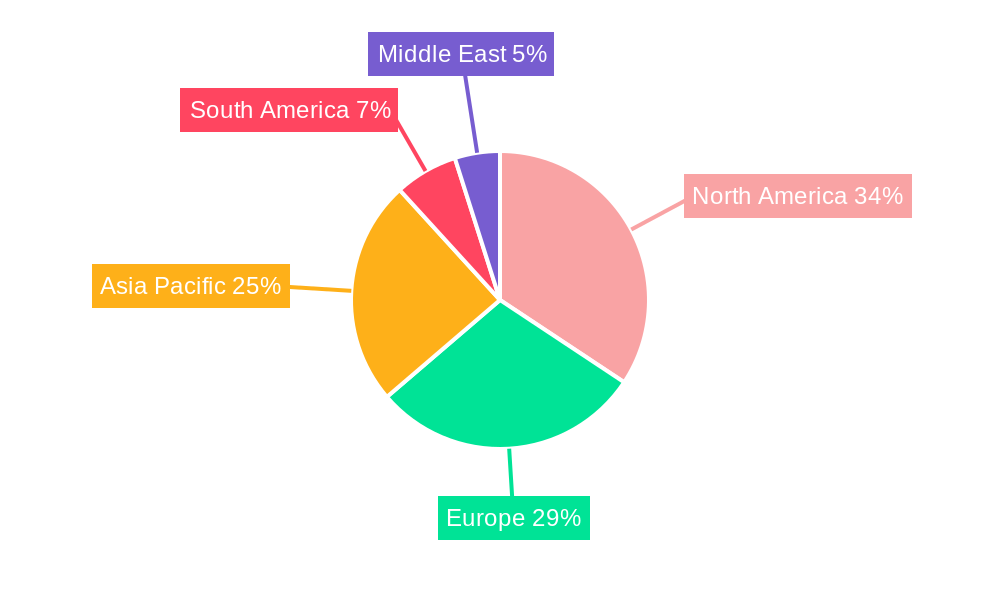
North America and Europe currently dominate the IPM Pheromone Products market, driven by stringent environmental regulations and high adoption rates of sustainable pest management practices. However, Asia-Pacific is projected to experience the fastest growth during the forecast period due to expanding agricultural lands, increasing pest pressure, and rising awareness of the benefits of IPM. Within the segments, mating disruption is the largest application function, followed by detection and monitoring. Field crops represent the largest share of crop applications, with significant growth potential expected in vegetable and other crops.

  • By Type: Mating pheromones hold the largest market share, followed by aggregation pheromones and other types.
  • By Function: Mating disruption is the dominant application, with detection and monitoring, and mass trapping following.
  • By Mode of Application: Traps dominate the market, followed by dispensers and lures.
  • By Crops: Field crops represent the largest segment, followed by vegetable and other crops.
  • Key Drivers (Regional): Stringent regulations (North America & Europe), expanding agricultural land (Asia-Pacific), government initiatives promoting IPM (various regions).

IPM Pheromone Products Industry Product Landscape

The IPM pheromone product landscape is characterized by continuous innovation in pheromone formulations, delivery systems, and application technologies. Recent advancements include the development of longer-lasting formulations, more effective attractants, and environmentally friendly dispensers. Companies are focusing on developing unique selling propositions (USPs) by offering customized solutions tailored to specific pests and crops. Technological advancements include incorporating microencapsulation techniques for improved efficacy and using biodegradable materials for sustainable production.

Key Drivers, Barriers & Challenges in IPM Pheromone Products Industry

Key Drivers: Growing awareness of environmental concerns, stringent regulations on synthetic pesticides, rising demand for organically produced crops, increased pest resistance to conventional insecticides, and advancements in pheromone technology.

Challenges: High R&D costs, complex regulatory approval processes, potential for pheromone resistance development, competition from other IPM methods, and fluctuating raw material prices. The average cost of regulatory approval can delay product launch by xx months, leading to a xx% loss in potential revenue.

Emerging Opportunities in IPM Pheromone Products Industry

Emerging opportunities lie in the development of novel pheromone blends for specific pest targets, expansion into new geographical markets, particularly in developing countries, and the integration of pheromone technology with other IPM strategies. The untapped potential of using pheromones in urban pest management and the growing interest in precision agriculture offer further avenues for growth.

Growth Accelerators in the IPM Pheromone Products Industry Industry

Long-term growth is driven by technological advancements leading to more effective and sustainable pheromone-based pest management solutions. Strategic partnerships between pheromone manufacturers and agricultural companies are further accelerating market expansion. Government initiatives promoting the adoption of IPM strategies in various regions will continue to drive market growth in the long term.

Key Players Shaping the IPM Pheromone Products Industry Market

  • Russell IPM
  • Suterr
  • Syngenta Bioline
  • Pacific Biocontrol Corporation
  • ISCA Technologies
  • Shin-Etsu
  • Hercon Environmental
  • Sumi Agro France
  • Isagro
  • BASF SE

Notable Milestones in IPM Pheromone Products Industry Sector

  • 2021: Launch of a new, long-lasting pheromone formulation by Syngenta Bioline.
  • 2022: Acquisition of a smaller pheromone producer by BASF SE.
  • 2023: Introduction of a novel pheromone dispenser using biodegradable materials by ISCA Technologies.
  • 2024: Publication of a major research study confirming the efficacy of pheromone-based pest management.

In-Depth IPM Pheromone Products Industry Market Outlook

The IPM Pheromone Products market presents significant growth potential in the coming years, driven by ongoing technological innovation, rising consumer demand for sustainable pest management practices, and supportive government policies. Strategic opportunities exist in developing innovative products, expanding into untapped markets, and forging strategic partnerships to capture a larger market share. The market’s long-term outlook is positive, fueled by the increasing global acceptance of IPM as a crucial strategy for sustainable agriculture.

IPM Pheromone Products Industry Segmentation

  • 1. Production Analysis
  • 2. Consumption Analysis
  • 3. Import Market Analysis (Value & Volume)
  • 4. Export Market Analysis (Value & Volume)
  • 5. Price Trend Analysis

IPM Pheromone Products Industry Segmentation By Geography

  • 1. North America
    • 1.1. United States
    • 1.2. Canada
    • 1.3. Mexico
  • 2. South America
    • 2.1. Brazil
    • 2.2. Argentina
    • 2.3. Rest of South America
  • 3. Europe
    • 3.1. United Kingdom
    • 3.2. Germany
    • 3.3. France
    • 3.4. Italy
    • 3.5. Spain
    • 3.6. Russia
    • 3.7. Benelux
    • 3.8. Nordics
    • 3.9. Rest of Europe
  • 4. Middle East & Africa
    • 4.1. Turkey
    • 4.2. Israel
    • 4.3. GCC
    • 4.4. North Africa
    • 4.5. South Africa
    • 4.6. Rest of Middle East & Africa
  • 5. Asia Pacific
    • 5.1. China
    • 5.2. India
    • 5.3. Japan
    • 5.4. South Korea
    • 5.5. ASEAN
    • 5.6. Oceania
    • 5.7. Rest of Asia Pacific
IPM Pheromone Products Industry Regional Share


IPM Pheromone Products Industry REPORT HIGHLIGHTS

AspectsDetails
Study Period 2019-2033
Base Year 2024
Estimated Year 2025
Forecast Period2025-2033
Historical Period2019-2024
Growth RateCAGR of 10.50% from 2019-2033
Segmentation
    • By Production Analysis
    • By Consumption Analysis
    • By Import Market Analysis (Value & Volume)
    • By Export Market Analysis (Value & Volume)
    • By Price Trend Analysis
  • By Geography
    • North America
      • United States
      • Canada
      • Mexico
    • South America
      • Brazil
      • Argentina
      • Rest of South America
    • Europe
      • United Kingdom
      • Germany
      • France
      • Italy
      • Spain
      • Russia
      • Benelux
      • Nordics
      • Rest of Europe
    • Middle East & Africa
      • Turkey
      • Israel
      • GCC
      • North Africa
      • South Africa
      • Rest of Middle East & Africa
    • Asia Pacific
      • China
      • India
      • Japan
      • South Korea
      • ASEAN
      • Oceania
      • Rest of Asia Pacific


Table of Contents

  1. 1. Introduction
    • 1.1. Research Scope
    • 1.2. Market Segmentation
    • 1.3. Research Methodology
    • 1.4. Definitions and Assumptions
  2. 2. Executive Summary
    • 2.1. Introduction
  3. 3. Market Dynamics
    • 3.1. Introduction
      • 3.2. Market Drivers
        • 3.2.1. Decreasing Per Capita Arable Land; Increased Demand for Food
      • 3.3. Market Restrains
        • 3.3.1. High Initial Investments; Requirement of Precision Agriculture
      • 3.4. Market Trends
        • 3.4.1. Strong Demand for High-Value Crops
  4. 4. Market Factor Analysis
    • 4.1. Porters Five Forces
    • 4.2. Supply/Value Chain
    • 4.3. PESTEL analysis
    • 4.4. Market Entropy
    • 4.5. Patent/Trademark Analysis
  5. 5. Global IPM Pheromone Products Industry Analysis, Insights and Forecast, 2019-2031
    • 5.1. Market Analysis, Insights and Forecast - by Production Analysis
      • 5.2. Market Analysis, Insights and Forecast - by Consumption Analysis
        • 5.3. Market Analysis, Insights and Forecast - by Import Market Analysis (Value & Volume)
          • 5.4. Market Analysis, Insights and Forecast - by Export Market Analysis (Value & Volume)
            • 5.5. Market Analysis, Insights and Forecast - by Price Trend Analysis
              • 5.6. Market Analysis, Insights and Forecast - by Region
                • 5.6.1. North America
                • 5.6.2. South America
                • 5.6.3. Europe
                • 5.6.4. Middle East & Africa
                • 5.6.5. Asia Pacific
            • 6. North America IPM Pheromone Products Industry Analysis, Insights and Forecast, 2019-2031
              • 6.1. Market Analysis, Insights and Forecast - by Production Analysis
                • 6.2. Market Analysis, Insights and Forecast - by Consumption Analysis
                  • 6.3. Market Analysis, Insights and Forecast - by Import Market Analysis (Value & Volume)
                    • 6.4. Market Analysis, Insights and Forecast - by Export Market Analysis (Value & Volume)
                      • 6.5. Market Analysis, Insights and Forecast - by Price Trend Analysis
                      • 7. South America IPM Pheromone Products Industry Analysis, Insights and Forecast, 2019-2031
                        • 7.1. Market Analysis, Insights and Forecast - by Production Analysis
                          • 7.2. Market Analysis, Insights and Forecast - by Consumption Analysis
                            • 7.3. Market Analysis, Insights and Forecast - by Import Market Analysis (Value & Volume)
                              • 7.4. Market Analysis, Insights and Forecast - by Export Market Analysis (Value & Volume)
                                • 7.5. Market Analysis, Insights and Forecast - by Price Trend Analysis
                                • 8. Europe IPM Pheromone Products Industry Analysis, Insights and Forecast, 2019-2031
                                  • 8.1. Market Analysis, Insights and Forecast - by Production Analysis
                                    • 8.2. Market Analysis, Insights and Forecast - by Consumption Analysis
                                      • 8.3. Market Analysis, Insights and Forecast - by Import Market Analysis (Value & Volume)
                                        • 8.4. Market Analysis, Insights and Forecast - by Export Market Analysis (Value & Volume)
                                          • 8.5. Market Analysis, Insights and Forecast - by Price Trend Analysis
                                          • 9. Middle East & Africa IPM Pheromone Products Industry Analysis, Insights and Forecast, 2019-2031
                                            • 9.1. Market Analysis, Insights and Forecast - by Production Analysis
                                              • 9.2. Market Analysis, Insights and Forecast - by Consumption Analysis
                                                • 9.3. Market Analysis, Insights and Forecast - by Import Market Analysis (Value & Volume)
                                                  • 9.4. Market Analysis, Insights and Forecast - by Export Market Analysis (Value & Volume)
                                                    • 9.5. Market Analysis, Insights and Forecast - by Price Trend Analysis
                                                    • 10. Asia Pacific IPM Pheromone Products Industry Analysis, Insights and Forecast, 2019-2031
                                                      • 10.1. Market Analysis, Insights and Forecast - by Production Analysis
                                                        • 10.2. Market Analysis, Insights and Forecast - by Consumption Analysis
                                                          • 10.3. Market Analysis, Insights and Forecast - by Import Market Analysis (Value & Volume)
                                                            • 10.4. Market Analysis, Insights and Forecast - by Export Market Analysis (Value & Volume)
                                                              • 10.5. Market Analysis, Insights and Forecast - by Price Trend Analysis
                                                              • 11. North America IPM Pheromone Products Industry Analysis, Insights and Forecast, 2019-2031
                                                                  • 11.1. Market Analysis, Insights and Forecast - By Country/Sub-region
                                                                    • 11.1.1 United States
                                                                    • 11.1.2 Canada
                                                                    • 11.1.3 Mexico
                                                                    • 11.1.4 Rest of North America
                                                              • 12. Europe IPM Pheromone Products Industry Analysis, Insights and Forecast, 2019-2031
                                                                  • 12.1. Market Analysis, Insights and Forecast - By Country/Sub-region
                                                                    • 12.1.1 Germany
                                                                    • 12.1.2 United Kingdom
                                                                    • 12.1.3 France
                                                                    • 12.1.4 Russia
                                                                    • 12.1.5 Spain
                                                                    • 12.1.6 Rest of Europe
                                                              • 13. Asia Pacific IPM Pheromone Products Industry Analysis, Insights and Forecast, 2019-2031
                                                                  • 13.1. Market Analysis, Insights and Forecast - By Country/Sub-region
                                                                    • 13.1.1 India
                                                                    • 13.1.2 China
                                                                    • 13.1.3 Japan
                                                                    • 13.1.4 Rest of the Asia Pacific
                                                              • 14. South America IPM Pheromone Products Industry Analysis, Insights and Forecast, 2019-2031
                                                                  • 14.1. Market Analysis, Insights and Forecast - By Country/Sub-region
                                                                    • 14.1.1 Brazil
                                                                    • 14.1.2 Argentina
                                                                    • 14.1.3 Rest of South America
                                                              • 15. Middle East IPM Pheromone Products Industry Analysis, Insights and Forecast, 2019-2031
                                                                  • 15.1. Market Analysis, Insights and Forecast - By Country/Sub-region
                                                                    • 15.1.1.
                                                              • 16. United Arab Emirates IPM Pheromone Products Industry Analysis, Insights and Forecast, 2019-2031
                                                                  • 16.1. Market Analysis, Insights and Forecast - By Country/Sub-region
                                                                    • 16.1.1 Saudi Arabia
                                                                    • 16.1.2 Rest of the Middle East
                                                              • 17. Competitive Analysis
                                                                • 17.1. Global Market Share Analysis 2024
                                                                  • 17.2. Company Profiles
                                                                    • 17.2.1 Russell IPM
                                                                      • 17.2.1.1. Overview
                                                                      • 17.2.1.2. Products
                                                                      • 17.2.1.3. SWOT Analysis
                                                                      • 17.2.1.4. Recent Developments
                                                                      • 17.2.1.5. Financials (Based on Availability)
                                                                    • 17.2.2 Suterr
                                                                      • 17.2.2.1. Overview
                                                                      • 17.2.2.2. Products
                                                                      • 17.2.2.3. SWOT Analysis
                                                                      • 17.2.2.4. Recent Developments
                                                                      • 17.2.2.5. Financials (Based on Availability)
                                                                    • 17.2.3 Syngenta Bioline
                                                                      • 17.2.3.1. Overview
                                                                      • 17.2.3.2. Products
                                                                      • 17.2.3.3. SWOT Analysis
                                                                      • 17.2.3.4. Recent Developments
                                                                      • 17.2.3.5. Financials (Based on Availability)
                                                                    • 17.2.4 Pacific Biocontrol Corporation
                                                                      • 17.2.4.1. Overview
                                                                      • 17.2.4.2. Products
                                                                      • 17.2.4.3. SWOT Analysis
                                                                      • 17.2.4.4. Recent Developments
                                                                      • 17.2.4.5. Financials (Based on Availability)
                                                                    • 17.2.5 ISCA Technologies
                                                                      • 17.2.5.1. Overview
                                                                      • 17.2.5.2. Products
                                                                      • 17.2.5.3. SWOT Analysis
                                                                      • 17.2.5.4. Recent Developments
                                                                      • 17.2.5.5. Financials (Based on Availability)
                                                                    • 17.2.6 Shin-Etsu
                                                                      • 17.2.6.1. Overview
                                                                      • 17.2.6.2. Products
                                                                      • 17.2.6.3. SWOT Analysis
                                                                      • 17.2.6.4. Recent Developments
                                                                      • 17.2.6.5. Financials (Based on Availability)
                                                                    • 17.2.7 Hercon Environmental
                                                                      • 17.2.7.1. Overview
                                                                      • 17.2.7.2. Products
                                                                      • 17.2.7.3. SWOT Analysis
                                                                      • 17.2.7.4. Recent Developments
                                                                      • 17.2.7.5. Financials (Based on Availability)
                                                                    • 17.2.8 Sumi Agro France
                                                                      • 17.2.8.1. Overview
                                                                      • 17.2.8.2. Products
                                                                      • 17.2.8.3. SWOT Analysis
                                                                      • 17.2.8.4. Recent Developments
                                                                      • 17.2.8.5. Financials (Based on Availability)
                                                                    • 17.2.9 Isagro
                                                                      • 17.2.9.1. Overview
                                                                      • 17.2.9.2. Products
                                                                      • 17.2.9.3. SWOT Analysis
                                                                      • 17.2.9.4. Recent Developments
                                                                      • 17.2.9.5. Financials (Based on Availability)
                                                                    • 17.2.10 BASF SE
                                                                      • 17.2.10.1. Overview
                                                                      • 17.2.10.2. Products
                                                                      • 17.2.10.3. SWOT Analysis
                                                                      • 17.2.10.4. Recent Developments
                                                                      • 17.2.10.5. Financials (Based on Availability)

                                                              List of Figures

                                                              1. Figure 1: Global IPM Pheromone Products Industry Revenue Breakdown (Million, %) by Region 2024 & 2032
                                                              2. Figure 2: North America IPM Pheromone Products Industry Revenue (Million), by Country 2024 & 2032
                                                              3. Figure 3: North America IPM Pheromone Products Industry Revenue Share (%), by Country 2024 & 2032
                                                              4. Figure 4: Europe IPM Pheromone Products Industry Revenue (Million), by Country 2024 & 2032
                                                              5. Figure 5: Europe IPM Pheromone Products Industry Revenue Share (%), by Country 2024 & 2032
                                                              6. Figure 6: Asia Pacific IPM Pheromone Products Industry Revenue (Million), by Country 2024 & 2032
                                                              7. Figure 7: Asia Pacific IPM Pheromone Products Industry Revenue Share (%), by Country 2024 & 2032
                                                              8. Figure 8: South America IPM Pheromone Products Industry Revenue (Million), by Country 2024 & 2032
                                                              9. Figure 9: South America IPM Pheromone Products Industry Revenue Share (%), by Country 2024 & 2032
                                                              10. Figure 10: Middle East IPM Pheromone Products Industry Revenue (Million), by Country 2024 & 2032
                                                              11. Figure 11: Middle East IPM Pheromone Products Industry Revenue Share (%), by Country 2024 & 2032
                                                              12. Figure 12: United Arab Emirates IPM Pheromone Products Industry Revenue (Million), by Country 2024 & 2032
                                                              13. Figure 13: United Arab Emirates IPM Pheromone Products Industry Revenue Share (%), by Country 2024 & 2032
                                                              14. Figure 14: North America IPM Pheromone Products Industry Revenue (Million), by Production Analysis 2024 & 2032
                                                              15. Figure 15: North America IPM Pheromone Products Industry Revenue Share (%), by Production Analysis 2024 & 2032
                                                              16. Figure 16: North America IPM Pheromone Products Industry Revenue (Million), by Consumption Analysis 2024 & 2032
                                                              17. Figure 17: North America IPM Pheromone Products Industry Revenue Share (%), by Consumption Analysis 2024 & 2032
                                                              18. Figure 18: North America IPM Pheromone Products Industry Revenue (Million), by Import Market Analysis (Value & Volume) 2024 & 2032
                                                              19. Figure 19: North America IPM Pheromone Products Industry Revenue Share (%), by Import Market Analysis (Value & Volume) 2024 & 2032
                                                              20. Figure 20: North America IPM Pheromone Products Industry Revenue (Million), by Export Market Analysis (Value & Volume) 2024 & 2032
                                                              21. Figure 21: North America IPM Pheromone Products Industry Revenue Share (%), by Export Market Analysis (Value & Volume) 2024 & 2032
                                                              22. Figure 22: North America IPM Pheromone Products Industry Revenue (Million), by Price Trend Analysis 2024 & 2032
                                                              23. Figure 23: North America IPM Pheromone Products Industry Revenue Share (%), by Price Trend Analysis 2024 & 2032
                                                              24. Figure 24: North America IPM Pheromone Products Industry Revenue (Million), by Country 2024 & 2032
                                                              25. Figure 25: North America IPM Pheromone Products Industry Revenue Share (%), by Country 2024 & 2032
                                                              26. Figure 26: South America IPM Pheromone Products Industry Revenue (Million), by Production Analysis 2024 & 2032
                                                              27. Figure 27: South America IPM Pheromone Products Industry Revenue Share (%), by Production Analysis 2024 & 2032
                                                              28. Figure 28: South America IPM Pheromone Products Industry Revenue (Million), by Consumption Analysis 2024 & 2032
                                                              29. Figure 29: South America IPM Pheromone Products Industry Revenue Share (%), by Consumption Analysis 2024 & 2032
                                                              30. Figure 30: South America IPM Pheromone Products Industry Revenue (Million), by Import Market Analysis (Value & Volume) 2024 & 2032
                                                              31. Figure 31: South America IPM Pheromone Products Industry Revenue Share (%), by Import Market Analysis (Value & Volume) 2024 & 2032
                                                              32. Figure 32: South America IPM Pheromone Products Industry Revenue (Million), by Export Market Analysis (Value & Volume) 2024 & 2032
                                                              33. Figure 33: South America IPM Pheromone Products Industry Revenue Share (%), by Export Market Analysis (Value & Volume) 2024 & 2032
                                                              34. Figure 34: South America IPM Pheromone Products Industry Revenue (Million), by Price Trend Analysis 2024 & 2032
                                                              35. Figure 35: South America IPM Pheromone Products Industry Revenue Share (%), by Price Trend Analysis 2024 & 2032
                                                              36. Figure 36: South America IPM Pheromone Products Industry Revenue (Million), by Country 2024 & 2032
                                                              37. Figure 37: South America IPM Pheromone Products Industry Revenue Share (%), by Country 2024 & 2032
                                                              38. Figure 38: Europe IPM Pheromone Products Industry Revenue (Million), by Production Analysis 2024 & 2032
                                                              39. Figure 39: Europe IPM Pheromone Products Industry Revenue Share (%), by Production Analysis 2024 & 2032
                                                              40. Figure 40: Europe IPM Pheromone Products Industry Revenue (Million), by Consumption Analysis 2024 & 2032
                                                              41. Figure 41: Europe IPM Pheromone Products Industry Revenue Share (%), by Consumption Analysis 2024 & 2032
                                                              42. Figure 42: Europe IPM Pheromone Products Industry Revenue (Million), by Import Market Analysis (Value & Volume) 2024 & 2032
                                                              43. Figure 43: Europe IPM Pheromone Products Industry Revenue Share (%), by Import Market Analysis (Value & Volume) 2024 & 2032
                                                              44. Figure 44: Europe IPM Pheromone Products Industry Revenue (Million), by Export Market Analysis (Value & Volume) 2024 & 2032
                                                              45. Figure 45: Europe IPM Pheromone Products Industry Revenue Share (%), by Export Market Analysis (Value & Volume) 2024 & 2032
                                                              46. Figure 46: Europe IPM Pheromone Products Industry Revenue (Million), by Price Trend Analysis 2024 & 2032
                                                              47. Figure 47: Europe IPM Pheromone Products Industry Revenue Share (%), by Price Trend Analysis 2024 & 2032
                                                              48. Figure 48: Europe IPM Pheromone Products Industry Revenue (Million), by Country 2024 & 2032
                                                              49. Figure 49: Europe IPM Pheromone Products Industry Revenue Share (%), by Country 2024 & 2032
                                                              50. Figure 50: Middle East & Africa IPM Pheromone Products Industry Revenue (Million), by Production Analysis 2024 & 2032
                                                              51. Figure 51: Middle East & Africa IPM Pheromone Products Industry Revenue Share (%), by Production Analysis 2024 & 2032
                                                              52. Figure 52: Middle East & Africa IPM Pheromone Products Industry Revenue (Million), by Consumption Analysis 2024 & 2032
                                                              53. Figure 53: Middle East & Africa IPM Pheromone Products Industry Revenue Share (%), by Consumption Analysis 2024 & 2032
                                                              54. Figure 54: Middle East & Africa IPM Pheromone Products Industry Revenue (Million), by Import Market Analysis (Value & Volume) 2024 & 2032
                                                              55. Figure 55: Middle East & Africa IPM Pheromone Products Industry Revenue Share (%), by Import Market Analysis (Value & Volume) 2024 & 2032
                                                              56. Figure 56: Middle East & Africa IPM Pheromone Products Industry Revenue (Million), by Export Market Analysis (Value & Volume) 2024 & 2032
                                                              57. Figure 57: Middle East & Africa IPM Pheromone Products Industry Revenue Share (%), by Export Market Analysis (Value & Volume) 2024 & 2032
                                                              58. Figure 58: Middle East & Africa IPM Pheromone Products Industry Revenue (Million), by Price Trend Analysis 2024 & 2032
                                                              59. Figure 59: Middle East & Africa IPM Pheromone Products Industry Revenue Share (%), by Price Trend Analysis 2024 & 2032
                                                              60. Figure 60: Middle East & Africa IPM Pheromone Products Industry Revenue (Million), by Country 2024 & 2032
                                                              61. Figure 61: Middle East & Africa IPM Pheromone Products Industry Revenue Share (%), by Country 2024 & 2032
                                                              62. Figure 62: Asia Pacific IPM Pheromone Products Industry Revenue (Million), by Production Analysis 2024 & 2032
                                                              63. Figure 63: Asia Pacific IPM Pheromone Products Industry Revenue Share (%), by Production Analysis 2024 & 2032
                                                              64. Figure 64: Asia Pacific IPM Pheromone Products Industry Revenue (Million), by Consumption Analysis 2024 & 2032
                                                              65. Figure 65: Asia Pacific IPM Pheromone Products Industry Revenue Share (%), by Consumption Analysis 2024 & 2032
                                                              66. Figure 66: Asia Pacific IPM Pheromone Products Industry Revenue (Million), by Import Market Analysis (Value & Volume) 2024 & 2032
                                                              67. Figure 67: Asia Pacific IPM Pheromone Products Industry Revenue Share (%), by Import Market Analysis (Value & Volume) 2024 & 2032
                                                              68. Figure 68: Asia Pacific IPM Pheromone Products Industry Revenue (Million), by Export Market Analysis (Value & Volume) 2024 & 2032
                                                              69. Figure 69: Asia Pacific IPM Pheromone Products Industry Revenue Share (%), by Export Market Analysis (Value & Volume) 2024 & 2032
                                                              70. Figure 70: Asia Pacific IPM Pheromone Products Industry Revenue (Million), by Price Trend Analysis 2024 & 2032
                                                              71. Figure 71: Asia Pacific IPM Pheromone Products Industry Revenue Share (%), by Price Trend Analysis 2024 & 2032
                                                              72. Figure 72: Asia Pacific IPM Pheromone Products Industry Revenue (Million), by Country 2024 & 2032
                                                              73. Figure 73: Asia Pacific IPM Pheromone Products Industry Revenue Share (%), by Country 2024 & 2032

                                                              List of Tables

                                                              1. Table 1: Global IPM Pheromone Products Industry Revenue Million Forecast, by Region 2019 & 2032
                                                              2. Table 2: Global IPM Pheromone Products Industry Revenue Million Forecast, by Production Analysis 2019 & 2032
                                                              3. Table 3: Global IPM Pheromone Products Industry Revenue Million Forecast, by Consumption Analysis 2019 & 2032
                                                              4. Table 4: Global IPM Pheromone Products Industry Revenue Million Forecast, by Import Market Analysis (Value & Volume) 2019 & 2032
                                                              5. Table 5: Global IPM Pheromone Products Industry Revenue Million Forecast, by Export Market Analysis (Value & Volume) 2019 & 2032
                                                              6. Table 6: Global IPM Pheromone Products Industry Revenue Million Forecast, by Price Trend Analysis 2019 & 2032
                                                              7. Table 7: Global IPM Pheromone Products Industry Revenue Million Forecast, by Region 2019 & 2032
                                                              8. Table 8: Global IPM Pheromone Products Industry Revenue Million Forecast, by Country 2019 & 2032
                                                              9. Table 9: United States IPM Pheromone Products Industry Revenue (Million) Forecast, by Application 2019 & 2032
                                                              10. Table 10: Canada IPM Pheromone Products Industry Revenue (Million) Forecast, by Application 2019 & 2032
                                                              11. Table 11: Mexico IPM Pheromone Products Industry Revenue (Million) Forecast, by Application 2019 & 2032
                                                              12. Table 12: Rest of North America IPM Pheromone Products Industry Revenue (Million) Forecast, by Application 2019 & 2032
                                                              13. Table 13: Global IPM Pheromone Products Industry Revenue Million Forecast, by Country 2019 & 2032
                                                              14. Table 14: Germany IPM Pheromone Products Industry Revenue (Million) Forecast, by Application 2019 & 2032
                                                              15. Table 15: United Kingdom IPM Pheromone Products Industry Revenue (Million) Forecast, by Application 2019 & 2032
                                                              16. Table 16: France IPM Pheromone Products Industry Revenue (Million) Forecast, by Application 2019 & 2032
                                                              17. Table 17: Russia IPM Pheromone Products Industry Revenue (Million) Forecast, by Application 2019 & 2032
                                                              18. Table 18: Spain IPM Pheromone Products Industry Revenue (Million) Forecast, by Application 2019 & 2032
                                                              19. Table 19: Rest of Europe IPM Pheromone Products Industry Revenue (Million) Forecast, by Application 2019 & 2032
                                                              20. Table 20: Global IPM Pheromone Products Industry Revenue Million Forecast, by Country 2019 & 2032
                                                              21. Table 21: India IPM Pheromone Products Industry Revenue (Million) Forecast, by Application 2019 & 2032
                                                              22. Table 22: China IPM Pheromone Products Industry Revenue (Million) Forecast, by Application 2019 & 2032
                                                              23. Table 23: Japan IPM Pheromone Products Industry Revenue (Million) Forecast, by Application 2019 & 2032
                                                              24. Table 24: Rest of the Asia Pacific IPM Pheromone Products Industry Revenue (Million) Forecast, by Application 2019 & 2032
                                                              25. Table 25: Global IPM Pheromone Products Industry Revenue Million Forecast, by Country 2019 & 2032
                                                              26. Table 26: Brazil IPM Pheromone Products Industry Revenue (Million) Forecast, by Application 2019 & 2032
                                                              27. Table 27: Argentina IPM Pheromone Products Industry Revenue (Million) Forecast, by Application 2019 & 2032
                                                              28. Table 28: Rest of South America IPM Pheromone Products Industry Revenue (Million) Forecast, by Application 2019 & 2032
                                                              29. Table 29: Global IPM Pheromone Products Industry Revenue Million Forecast, by Country 2019 & 2032
                                                              30. Table 30: IPM Pheromone Products Industry Revenue (Million) Forecast, by Application 2019 & 2032
                                                              31. Table 31: Global IPM Pheromone Products Industry Revenue Million Forecast, by Country 2019 & 2032
                                                              32. Table 32: Saudi Arabia IPM Pheromone Products Industry Revenue (Million) Forecast, by Application 2019 & 2032
                                                              33. Table 33: Rest of the Middle East IPM Pheromone Products Industry Revenue (Million) Forecast, by Application 2019 & 2032
                                                              34. Table 34: Global IPM Pheromone Products Industry Revenue Million Forecast, by Production Analysis 2019 & 2032
                                                              35. Table 35: Global IPM Pheromone Products Industry Revenue Million Forecast, by Consumption Analysis 2019 & 2032
                                                              36. Table 36: Global IPM Pheromone Products Industry Revenue Million Forecast, by Import Market Analysis (Value & Volume) 2019 & 2032
                                                              37. Table 37: Global IPM Pheromone Products Industry Revenue Million Forecast, by Export Market Analysis (Value & Volume) 2019 & 2032
                                                              38. Table 38: Global IPM Pheromone Products Industry Revenue Million Forecast, by Price Trend Analysis 2019 & 2032
                                                              39. Table 39: Global IPM Pheromone Products Industry Revenue Million Forecast, by Country 2019 & 2032
                                                              40. Table 40: United States IPM Pheromone Products Industry Revenue (Million) Forecast, by Application 2019 & 2032
                                                              41. Table 41: Canada IPM Pheromone Products Industry Revenue (Million) Forecast, by Application 2019 & 2032
                                                              42. Table 42: Mexico IPM Pheromone Products Industry Revenue (Million) Forecast, by Application 2019 & 2032
                                                              43. Table 43: Global IPM Pheromone Products Industry Revenue Million Forecast, by Production Analysis 2019 & 2032
                                                              44. Table 44: Global IPM Pheromone Products Industry Revenue Million Forecast, by Consumption Analysis 2019 & 2032
                                                              45. Table 45: Global IPM Pheromone Products Industry Revenue Million Forecast, by Import Market Analysis (Value & Volume) 2019 & 2032
                                                              46. Table 46: Global IPM Pheromone Products Industry Revenue Million Forecast, by Export Market Analysis (Value & Volume) 2019 & 2032
                                                              47. Table 47: Global IPM Pheromone Products Industry Revenue Million Forecast, by Price Trend Analysis 2019 & 2032
                                                              48. Table 48: Global IPM Pheromone Products Industry Revenue Million Forecast, by Country 2019 & 2032
                                                              49. Table 49: Brazil IPM Pheromone Products Industry Revenue (Million) Forecast, by Application 2019 & 2032
                                                              50. Table 50: Argentina IPM Pheromone Products Industry Revenue (Million) Forecast, by Application 2019 & 2032
                                                              51. Table 51: Rest of South America IPM Pheromone Products Industry Revenue (Million) Forecast, by Application 2019 & 2032
                                                              52. Table 52: Global IPM Pheromone Products Industry Revenue Million Forecast, by Production Analysis 2019 & 2032
                                                              53. Table 53: Global IPM Pheromone Products Industry Revenue Million Forecast, by Consumption Analysis 2019 & 2032
                                                              54. Table 54: Global IPM Pheromone Products Industry Revenue Million Forecast, by Import Market Analysis (Value & Volume) 2019 & 2032
                                                              55. Table 55: Global IPM Pheromone Products Industry Revenue Million Forecast, by Export Market Analysis (Value & Volume) 2019 & 2032
                                                              56. Table 56: Global IPM Pheromone Products Industry Revenue Million Forecast, by Price Trend Analysis 2019 & 2032
                                                              57. Table 57: Global IPM Pheromone Products Industry Revenue Million Forecast, by Country 2019 & 2032
                                                              58. Table 58: United Kingdom IPM Pheromone Products Industry Revenue (Million) Forecast, by Application 2019 & 2032
                                                              59. Table 59: Germany IPM Pheromone Products Industry Revenue (Million) Forecast, by Application 2019 & 2032
                                                              60. Table 60: France IPM Pheromone Products Industry Revenue (Million) Forecast, by Application 2019 & 2032
                                                              61. Table 61: Italy IPM Pheromone Products Industry Revenue (Million) Forecast, by Application 2019 & 2032
                                                              62. Table 62: Spain IPM Pheromone Products Industry Revenue (Million) Forecast, by Application 2019 & 2032
                                                              63. Table 63: Russia IPM Pheromone Products Industry Revenue (Million) Forecast, by Application 2019 & 2032
                                                              64. Table 64: Benelux IPM Pheromone Products Industry Revenue (Million) Forecast, by Application 2019 & 2032
                                                              65. Table 65: Nordics IPM Pheromone Products Industry Revenue (Million) Forecast, by Application 2019 & 2032
                                                              66. Table 66: Rest of Europe IPM Pheromone Products Industry Revenue (Million) Forecast, by Application 2019 & 2032
                                                              67. Table 67: Global IPM Pheromone Products Industry Revenue Million Forecast, by Production Analysis 2019 & 2032
                                                              68. Table 68: Global IPM Pheromone Products Industry Revenue Million Forecast, by Consumption Analysis 2019 & 2032
                                                              69. Table 69: Global IPM Pheromone Products Industry Revenue Million Forecast, by Import Market Analysis (Value & Volume) 2019 & 2032
                                                              70. Table 70: Global IPM Pheromone Products Industry Revenue Million Forecast, by Export Market Analysis (Value & Volume) 2019 & 2032
                                                              71. Table 71: Global IPM Pheromone Products Industry Revenue Million Forecast, by Price Trend Analysis 2019 & 2032
                                                              72. Table 72: Global IPM Pheromone Products Industry Revenue Million Forecast, by Country 2019 & 2032
                                                              73. Table 73: Turkey IPM Pheromone Products Industry Revenue (Million) Forecast, by Application 2019 & 2032
                                                              74. Table 74: Israel IPM Pheromone Products Industry Revenue (Million) Forecast, by Application 2019 & 2032
                                                              75. Table 75: GCC IPM Pheromone Products Industry Revenue (Million) Forecast, by Application 2019 & 2032
                                                              76. Table 76: North Africa IPM Pheromone Products Industry Revenue (Million) Forecast, by Application 2019 & 2032
                                                              77. Table 77: South Africa IPM Pheromone Products Industry Revenue (Million) Forecast, by Application 2019 & 2032
                                                              78. Table 78: Rest of Middle East & Africa IPM Pheromone Products Industry Revenue (Million) Forecast, by Application 2019 & 2032
                                                              79. Table 79: Global IPM Pheromone Products Industry Revenue Million Forecast, by Production Analysis 2019 & 2032
                                                              80. Table 80: Global IPM Pheromone Products Industry Revenue Million Forecast, by Consumption Analysis 2019 & 2032
                                                              81. Table 81: Global IPM Pheromone Products Industry Revenue Million Forecast, by Import Market Analysis (Value & Volume) 2019 & 2032
                                                              82. Table 82: Global IPM Pheromone Products Industry Revenue Million Forecast, by Export Market Analysis (Value & Volume) 2019 & 2032
                                                              83. Table 83: Global IPM Pheromone Products Industry Revenue Million Forecast, by Price Trend Analysis 2019 & 2032
                                                              84. Table 84: Global IPM Pheromone Products Industry Revenue Million Forecast, by Country 2019 & 2032
                                                              85. Table 85: China IPM Pheromone Products Industry Revenue (Million) Forecast, by Application 2019 & 2032
                                                              86. Table 86: India IPM Pheromone Products Industry Revenue (Million) Forecast, by Application 2019 & 2032
                                                              87. Table 87: Japan IPM Pheromone Products Industry Revenue (Million) Forecast, by Application 2019 & 2032
                                                              88. Table 88: South Korea IPM Pheromone Products Industry Revenue (Million) Forecast, by Application 2019 & 2032
                                                              89. Table 89: ASEAN IPM Pheromone Products Industry Revenue (Million) Forecast, by Application 2019 & 2032
                                                              90. Table 90: Oceania IPM Pheromone Products Industry Revenue (Million) Forecast, by Application 2019 & 2032
                                                              91. Table 91: Rest of Asia Pacific IPM Pheromone Products Industry Revenue (Million) Forecast, by Application 2019 & 2032


                                                              Frequently Asked Questions

                                                              1. What is the projected Compound Annual Growth Rate (CAGR) of the IPM Pheromone Products Industry?

                                                              The projected CAGR is approximately 10.50%.

                                                              2. Which companies are prominent players in the IPM Pheromone Products Industry?

                                                              Key companies in the market include Russell IPM, Suterr, Syngenta Bioline, Pacific Biocontrol Corporation, ISCA Technologies, Shin-Etsu, Hercon Environmental, Sumi Agro France, Isagro, BASF SE.

                                                              3. What are the main segments of the IPM Pheromone Products Industry?

                                                              The market segments include Production Analysis, Consumption Analysis, Import Market Analysis (Value & Volume), Export Market Analysis (Value & Volume), Price Trend Analysis.

                                                              4. Can you provide details about the market size?

                                                              The market size is estimated to be USD 1.02 Million as of 2022.

                                                              5. What are some drivers contributing to market growth?

                                                              Decreasing Per Capita Arable Land; Increased Demand for Food.

                                                              6. What are the notable trends driving market growth?

                                                              Strong Demand for High-Value Crops.

                                                              7. Are there any restraints impacting market growth?

                                                              High Initial Investments; Requirement of Precision Agriculture.

                                                              8. Can you provide examples of recent developments in the market?

                                                              N/A

                                                              9. What pricing options are available for accessing the report?

                                                              Pricing options include single-user, multi-user, and enterprise licenses priced at USD 3800, USD 4500, and USD 5800 respectively.

                                                              10. Is the market size provided in terms of value or volume?

                                                              The market size is provided in terms of value, measured in Million.

                                                              11. Are there any specific market keywords associated with the report?

                                                              Yes, the market keyword associated with the report is "IPM Pheromone Products Industry," which aids in identifying and referencing the specific market segment covered.

                                                              12. How do I determine which pricing option suits my needs best?

                                                              The pricing options vary based on user requirements and access needs. Individual users may opt for single-user licenses, while businesses requiring broader access may choose multi-user or enterprise licenses for cost-effective access to the report.

                                                              13. Are there any additional resources or data provided in the IPM Pheromone Products Industry report?

                                                              While the report offers comprehensive insights, it's advisable to review the specific contents or supplementary materials provided to ascertain if additional resources or data are available.

                                                              14. How can I stay updated on further developments or reports in the IPM Pheromone Products Industry?

                                                              To stay informed about further developments, trends, and reports in the IPM Pheromone Products Industry, consider subscribing to industry newsletters, following relevant companies and organizations, or regularly checking reputable industry news sources and publications.


                                                              Methodology

                                                              Step 1 - Identification of Relevant Samples Size from Population Database

                                                              Step Chart
                                                              Bar Chart
                                                              Method Chart

                                                              Step 2 - Approaches for Defining Global Market Size (Value, Volume* & Price*)

                                                              Approach Chart
                                                              Top-down and bottom-up approaches are used to validate the global market size and estimate the market size for manufactures, regional segments, product, and application.

                                                              Note*: In applicable scenarios

                                                              Step 3 - Data Sources

                                                              Primary Research

                                                              • Web Analytics
                                                              • Survey Reports
                                                              • Research Institute
                                                              • Latest Research Reports
                                                              • Opinion Leaders

                                                              Secondary Research

                                                              • Annual Reports
                                                              • White Paper
                                                              • Latest Press Release
                                                              • Industry Association
                                                              • Paid Database
                                                              • Investor Presentations
                                                              Analyst Chart

                                                              Step 4 - Data Triangulation

                                                              Involves using different sources of information in order to increase the validity of a study

                                                              These sources are likely to be stakeholders in a program - participants, other researchers, program staff, other community members, and so on.

                                                              Then we put all data in single framework & apply various statistical tools to find out the dynamic on the market.

                                                              During the analysis stage, feedback from the stakeholder groups would be compared to determine areas of agreement as well as areas of divergence

                                                              Additionally, after gathering mixed and scattered data from a wide range of sources, data is triangulated and correlated to come up with estimated figures which are further validated through primary mediums or industry experts, opinion leaders.

                                                              About Visionary Data Reports

                                                              Visionary Data Reports provides future-focused market research, advanced analytics, and strategic insights for technology, healthcare, green energy, and finance. Our reports help you anticipate trends, innovate, and lead in your industry. Our expert team combines primary research, data science, and industry knowledge to deliver actionable intelligence. We offer syndicated reports, custom analytics, and consulting services tailored to your business needs. At Visionary Data Reports, we are committed to quality, transparency, and client satisfaction. Every report is rigorously validated to ensure accuracy and relevance. Our global perspective and forward-thinking approach help you understand both current and emerging market dynamics.

                                                              Stay ahead with Visionary Data Reports. Subscribe to our newsletter for the latest insights and research highlights, and follow us on social media for real-time updates. Visionary Data Reports – Your Guide to Tomorrow’s Opportunities.

                                                              artwork spiralartwork spiralRelated Reports
                                                              artwork underline

                                                              Cameroon Grains Industry Industry Analysis and Consumer Behavior

                                                              Discover the booming Cameroon grains industry! Explore market size, growth trends (4.80% CAGR), key players (Sodecoton, CDC, etc.), and challenges impacting cereals, pulses, and oilseeds in Cameroon from 2019-2033. Invest wisely in this promising African market.

                                                              July 2025
                                                              Base Year: 2024
                                                              No Of Pages: 180
                                                              Price: $3800

                                                              Analyzing Consumer Behavior in Agriculture Market in Tanzania Market

                                                              Discover the booming Tanzanian agriculture market! Projected to reach $17.44 billion in 2025, with a 5.63% CAGR, this report analyzes market size, key players (Syngenta, Rijk Zwaan), growth drivers, and future trends in Tanzania's agricultural sector. Explore market segments, including food crops and investment opportunities.

                                                              July 2025
                                                              Base Year: 2024
                                                              No Of Pages: 150
                                                              Price: $3800

                                                              Analyzing Consumer Behavior in Artificial Intelligence in Agriculture Industry Market

                                                              Discover the booming AI in Agriculture market! This comprehensive analysis reveals a 4.20% CAGR, key drivers, trends, restraints, and regional insights from 2019-2033. Learn about leading companies and applications like precision farming, drone analytics, and weather tracking. Explore market size projections and future growth potential.

                                                              July 2025
                                                              Base Year: 2024
                                                              No Of Pages: 150
                                                              Price: $4750

                                                              Exploring Forestry Machinery Market’s Market Size Dynamics 2025-2033

                                                              The global forestry machinery market is booming, projected to reach $15 billion by 2033, driven by rising timber demand and technological advancements. Explore market trends, key players (Deere, Komatsu, etc.), and regional growth in our comprehensive analysis.

                                                              July 2025
                                                              Base Year: 2024
                                                              No Of Pages: 150
                                                              Price: $4750

                                                              Nutrition Canary Seed Market Competitive Strategies: Trends and Forecasts 2025-2033

                                                              Discover the booming nutrition canary seed market! Explore key trends, growth drivers, and regional market share projections for 2025-2033. Learn about leading companies and the increasing demand driven by health-conscious consumers and the birdseed industry.

                                                              July 2025
                                                              Base Year: 2024
                                                              No Of Pages: 234
                                                              Price: $4750

                                                              Consumer Behavior and Cashews Market in South America Trends

                                                              Discover the booming South American cashew market! This comprehensive analysis reveals a $582.24 million market in 2025, projected to grow at a 5.20% CAGR through 2033. Explore key trends, drivers, and leading companies shaping this lucrative industry.

                                                              July 2025
                                                              Base Year: 2024
                                                              No Of Pages: 180
                                                              Price: $3800

                                                              Strategic Growth Drivers for Rye Industry Market

                                                              Discover the latest market analysis of the global rye industry, projecting a steady CAGR of 2.20% to 2033. Explore key drivers, restraints, and regional trends impacting the growth of rye in food, feed, and beverage applications. Learn about leading companies and future market opportunities.

                                                              July 2025
                                                              Base Year: 2024
                                                              No Of Pages: 234
                                                              Price: $4750

                                                              Comprehensive Overview of Water Soluble Fertilizer Industry Trends: 2025-2033

                                                              Discover the booming water-soluble fertilizer market! Explore its $XX million valuation in 2025, projected 3.80% CAGR growth to 2033, key drivers, trends, and regional insights. Learn about top players and lucrative segments like fertigation and horticultural crops.

                                                              July 2025
                                                              Base Year: 2024
                                                              No Of Pages: 150
                                                              Price: $3800

                                                              Asia-Pacific Agricultural Tractors Market Market Expansion: Growth Outlook 2025-2033

                                                              Discover the booming Asia-Pacific Agricultural Tractors market! Our analysis reveals a $15 billion USD market in 2025, projected to grow at a 6% CAGR through 2033. Explore market size, growth trends, and regional breakdowns for India, China, and other key countries. Learn how technological advancements and government initiatives are shaping the future of farming.

                                                              July 2025
                                                              Base Year: 2024
                                                              No Of Pages: 197
                                                              Price: $3800

                                                              Asia-Pacific Agricultural Enzymes Market Market’s Consumer Preferences: Trends and Analysis 2025-2033

                                                              The Asia-Pacific agricultural enzymes market is booming, projected to reach $XX million by 2025, with a CAGR of 10.30%. This report analyzes market drivers, trends, restraints, and key players like Novozymes and BASF, covering segments like carbohydrases and applications in crop protection. Discover regional insights and forecast data for 2025-2033.

                                                              July 2025
                                                              Base Year: 2024
                                                              No Of Pages: 197
                                                              Price: $3800

                                                              Strategic Vision for USA Agricultural Irrigation Machinery Market Industry Trends

                                                              Discover the booming US agricultural irrigation machinery market! This in-depth analysis reveals projected growth to $3.8B by 2033, driven by water scarcity, precision agriculture, and smart irrigation technology. Explore key players, regional trends, and market segmentation in drip, sprinkler, and pivot irrigation.

                                                              July 2025
                                                              Base Year: 2024
                                                              No Of Pages: 150
                                                              Price: $3800

                                                              Electric Lawn Mowers Market Insightful Market Analysis: Trends and Opportunities 2025-2033

                                                              Discover the booming electric lawn mower market! This comprehensive analysis reveals a CAGR of 6.50%, driven by eco-consciousness and technological advancements. Explore market size, key players (Toro, Husqvarna, etc.), regional trends, and future projections (2025-2033) for residential, professional, and golf course applications.

                                                              July 2025
                                                              Base Year: 2024
                                                              No Of Pages: 150
                                                              Price: $4750

                                                              Asia-pacific Forage Seed Market Report 2025: Growth Driven by Government Incentives and Partnerships

                                                              Discover the booming Asia-Pacific forage seed market! Explore key trends, growth drivers (including increasing livestock & adoption of hybrid seeds), and challenges impacting alfalfa, forage corn, and other crops. Learn about leading companies and regional market shares. Projected CAGR of 4.70% to 2033.

                                                              July 2025
                                                              Base Year: 2024
                                                              No Of Pages: 150
                                                              Price: $3800

                                                              USA Lawn Care Market Planning for the Future: Key Trends 2025-2033

                                                              The US lawn care market is booming, projected to reach $89.53 billion by 2033, with a 5.20% CAGR. Discover key trends, driving factors, and top companies shaping this lucrative industry. Learn about regional variations and the impact of sustainable practices.

                                                              July 2025
                                                              Base Year: 2024
                                                              No Of Pages: 197
                                                              Price: $3800

                                                              Canadian Agricultural Machinery Industry Analysis Report 2025: Market to Grow by a CAGR of XX to 2033, Driven by Government Incentives, Popularity of Virtual Assistants, and Strategic Partnerships

                                                              Discover the booming Canadian agricultural machinery market! Learn about its projected growth (7.6% CAGR), key players, driving trends (precision agriculture, sustainable farming), and challenges. Explore market segments and future forecasts.

                                                              July 2025
                                                              Base Year: 2024
                                                              No Of Pages: 197
                                                              Price: $3800

                                                              Regional Insights into IPM Pheromone Products Industry Market Growth

                                                              The IPM Pheromone Products market is booming, projected to reach [Value] million by 2033 with a CAGR of 10.5%. Discover key trends, market segmentation, leading companies, and regional growth insights in this comprehensive market analysis. Explore sustainable pest control solutions and the future of agriculture.

                                                              July 2025
                                                              Base Year: 2024
                                                              No Of Pages: 197
                                                              Price: $3800

                                                              China Specialty Fertilizer Market Market Dynamics: Drivers and Barriers to Growth 2025-2033

                                                              Discover the booming China specialty fertilizer market! This comprehensive analysis reveals a CAGR of 6.70%, driven by precision farming, government initiatives, and growing demand for high-yield crops. Explore market segments, key players, and future trends in this lucrative sector.

                                                              July 2025
                                                              Base Year: 2024
                                                              No Of Pages: 150
                                                              Price: $3800

                                                              South American Olives Market Charting Growth Trajectories: Analysis and Forecasts 2025-2033

                                                              Discover the booming South American olives market! This comprehensive analysis reveals a $665.46M market in 2025, projected to reach over $900M by 2033 with a 4.20% CAGR. Learn about key drivers, trends, restraints, leading companies (Aceitunas del Sur, Finca la Esmeralda, etc.), and regional market share in Brazil, Argentina, and more.

                                                              July 2025
                                                              Base Year: 2024
                                                              No Of Pages: 180
                                                              Price: $3800

                                                              Fertilizers Market in South America Decoded: Comprehensive Analysis and Forecasts 2025-2033

                                                              Discover the booming South American fertilizer market! This comprehensive analysis reveals a CAGR of 9.02% driven by rising food demand and agricultural intensification. Explore market segmentation, key players, and future trends in Brazil, Argentina, and beyond. Learn how this dynamic market is shaping the future of agriculture.

                                                              July 2025
                                                              Base Year: 2024
                                                              No Of Pages: 150
                                                              Price: $3800

                                                              South America Crop Protection Chemicals Market 2025 Trends and Forecasts 2033: Analyzing Growth Opportunities

                                                              The South American Crop Protection Chemicals market is booming, projected to reach $XX million by 2025 and grow at a CAGR of 16.50% through 2033. Driven by rising pest & disease prevalence and increasing adoption of advanced application methods, this market offers lucrative opportunities for key players like Bayer, Syngenta, and BASF. Learn more about market trends, segmentation, and regional analysis.

                                                              July 2025
                                                              Base Year: 2024
                                                              No Of Pages: 197
                                                              Price: $3800
                                                              • Home
                                                              • About Us
                                                              • Industries
                                                                • Aerospace & Defense
                                                                • Agriculture
                                                                • Animal Nutrition & Wellness
                                                                • Automotive
                                                                • Chemicals & Materials
                                                                • Consumer Goods and Services
                                                                • Energy & Power
                                                                • Financial Services and Investment Intelligence
                                                                • Food & Beverage
                                                                • Home and Property Improvement
                                                                • Hospitality and Tourism
                                                                • Logistics
                                                                • Manufacturing Products and Services
                                                                • Packaging
                                                                • Professional and Commercial Services
                                                                • Real Estate and Construction
                                                                • Retail
                                                                • Technology, Media and Telecom
                                                                • Healthcare
                                                              • Services
                                                              • Contact
                                                              Main Logo
                                                              • Home
                                                              • About Us
                                                              • Industries
                                                                • Aerospace & Defense
                                                                • Agriculture
                                                                • Animal Nutrition & Wellness
                                                                • Automotive
                                                                • Chemicals & Materials
                                                                • Consumer Goods and Services
                                                                • Energy & Power
                                                                • Financial Services and Investment Intelligence
                                                                • Food & Beverage
                                                                • Home and Property Improvement
                                                                • Hospitality and Tourism
                                                                • Logistics
                                                                • Manufacturing Products and Services
                                                                • Packaging
                                                                • Professional and Commercial Services
                                                                • Real Estate and Construction
                                                                • Retail
                                                                • Technology, Media and Telecom
                                                                • Healthcare
                                                              • Services
                                                              • Contact
                                                              +17162654855
                                                              [email protected]

                                                              +17162654855

                                                              [email protected]

                                                              Business Address

                                                              Head Office

                                                              Office no. A 5010, fifth floor, Solitaire Business Hub, Near Phoenix mall, Pune, Maharashtra 411014

                                                              Contact Information

                                                              Craig Francis

                                                              Business Development Head

                                                              +17162654855

                                                              [email protected]

                                                              Connect With Us

                                                              Secure Payment Partners

                                                              payment image
                                                              RetailLogisticsPackagingAutomotiveHealthcareAgricultureEnergy & PowerFood & BeverageAerospace & DefenseChemicals & MaterialsHospitality and TourismAnimal Nutrition & WellnessConsumer Goods and ServicesReal Estate and ConstructionHome and Property ImprovementTechnology, Media and TelecomManufacturing Products and ServicesFinancial Services and Investment Intelligence

                                                              © 2025 All rights reserved


                                                              Privacy Policy
                                                              Terms and Conditions
                                                              FAQ