

Key Insights
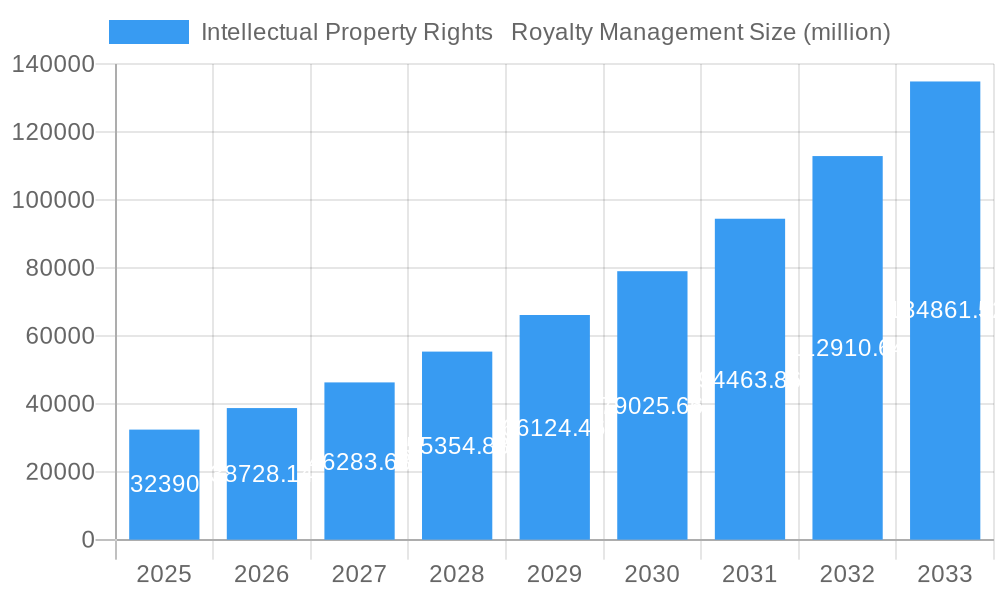
The Intellectual Property Rights (IPR) Royalty Management market is experiencing robust growth, projected to reach \$32.39 billion in 2025 and maintain a Compound Annual Growth Rate (CAGR) of 19.6% from 2025 to 2033. This expansion is fueled by several key factors. Firstly, the increasing complexity of global intellectual property portfolios necessitates sophisticated management systems capable of tracking royalties, licensing agreements, and revenue streams across multiple jurisdictions. Secondly, the rise of digital content and technologies, along with a growing emphasis on enforcing intellectual property rights, contributes significantly to market demand. Furthermore, the adoption of cloud-based solutions and advanced analytics within IPR management is streamlining operations and improving efficiency, accelerating market growth. Key players like FADEL, Vistex, Klopotek, Filmtrack, IBM, Dependable Solutions, Anaqua, Lecorpio, Ipfolio, Capgemini, and Oracle are actively shaping this market through innovation and strategic partnerships. The market is likely segmented by software type (cloud-based vs. on-premise), industry vertical (media & entertainment, technology, pharmaceuticals, etc.), and geography, though specific segment data is not provided. Future growth will likely be influenced by factors like regulatory changes impacting IPR enforcement, technological advancements in data analytics and AI for royalty management, and increasing awareness of the importance of robust IPR management practices across various businesses.
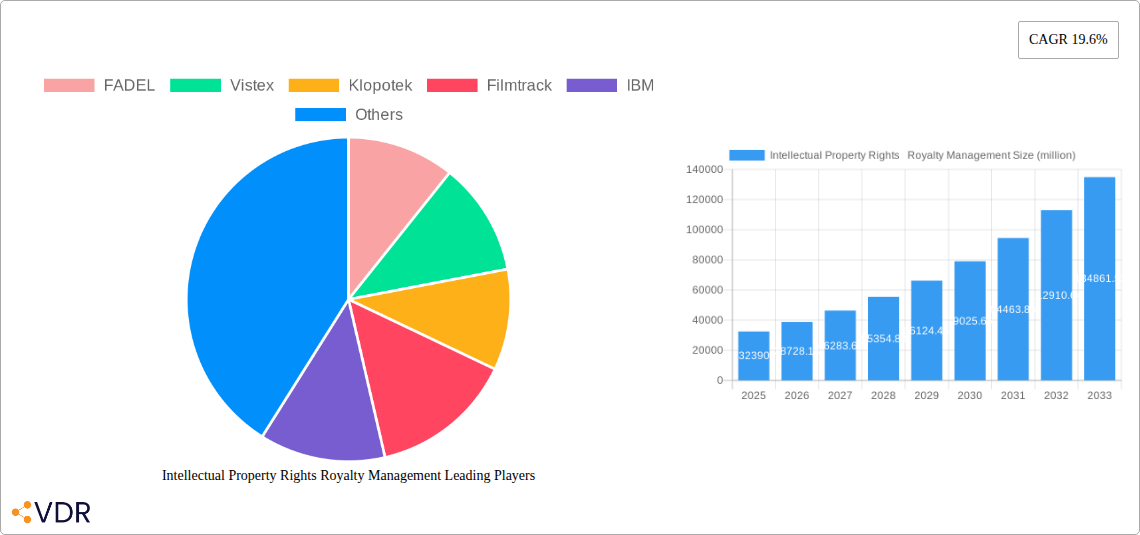
Intellectual Property Rights Royalty Management Market Size (In Billion)
The historical period (2019-2024) likely saw a similar, albeit possibly lower, growth trajectory given the projected CAGR. The market's consistent expansion suggests a strong future outlook, driven by increasing globalization, the digital transformation across diverse sectors, and the persistent need for efficient and transparent royalty management. The continued emergence of specialized software solutions catering to niche industries within the IPR landscape further enhances the market's growth potential. While potential restraints could include the initial investment costs associated with implementing new IPR management systems and the complexities of integrating these systems with existing infrastructure, the overall market trajectory points to a promising future for providers of IPR royalty management solutions.
Intellectual Property Rights Royalty Management Company Market Share
Intellectual Property Rights Royalty Management Market Report: 2019-2033
This comprehensive report provides a detailed analysis of the Intellectual Property Rights (IPR) Royalty Management market, offering invaluable insights for industry professionals, investors, and strategic decision-makers. With a study period spanning 2019-2033, a base year of 2025, and a forecast period of 2025-2033, this report leverages extensive primary and secondary research to deliver an in-depth understanding of market dynamics, growth trends, and future opportunities. The report's parent market is the broader Intellectual Property Management market, while the child market focuses specifically on royalty management solutions and services. The market size in 2025 is estimated at xx million.
Intellectual Property Rights Royalty Management Market Dynamics & Structure
The IPR Royalty Management market is characterized by a moderately concentrated landscape, with key players like FADEL, Vistex, Klopotek, and Anaqua holding significant market share. Technological advancements, particularly in AI and automation, are driving innovation, while regulatory changes impacting data privacy and compliance are shaping market strategies. The market witnesses continuous M&A activity, with xx deals recorded in the historical period (2019-2024), resulting in a consolidation trend among players. Competitive substitutes include manual royalty tracking and management systems, but these lack the scalability and efficiency of specialized software solutions. End-user demographics include diverse industries like entertainment, technology, pharmaceuticals, and manufacturing.
- Market Concentration: Moderately concentrated, with top 5 players holding approximately xx% market share in 2025.
- Technological Drivers: AI-powered analytics, blockchain for secure royalty tracking, automated workflows.
- Regulatory Frameworks: GDPR, CCPA, and other data privacy regulations influence software development and data handling.
- M&A Activity: xx deals between 2019-2024, signaling consolidation and increased competition.
- Innovation Barriers: High initial investment costs for software implementation and integration challenges.
Intellectual Property Rights Royalty Management Growth Trends & Insights
The global IPR Royalty Management market is experiencing robust growth, driven by increasing IP licensing agreements and the need for efficient royalty accounting and tracking. The market size exhibited a CAGR of xx% during the historical period (2019-2024) and is projected to reach xx million by 2033, with a CAGR of xx% during the forecast period (2025-2033). This growth is fueled by rising adoption rates across various industries, particularly in sectors with high IP value and complex licensing agreements. Technological disruptions, such as the rise of cloud-based solutions and AI-driven analytics, are further accelerating market expansion. Changing consumer behavior, favoring digital solutions and increased demand for transparency, are contributing to the market's upward trajectory. Market penetration in 2025 is estimated to be xx%.
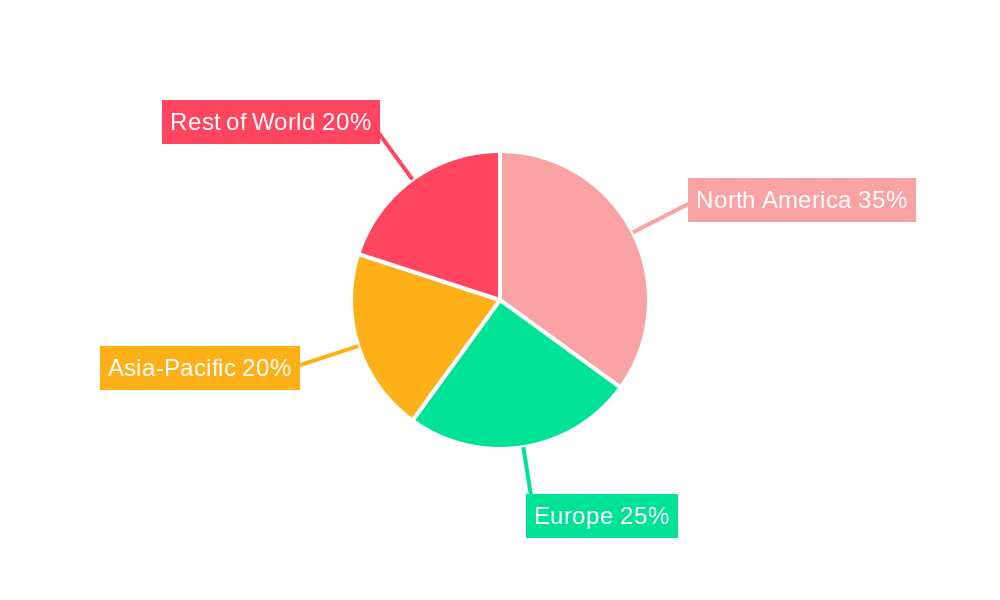
Dominant Regions, Countries, or Segments in Intellectual Property Rights Royalty Management
North America currently holds the largest market share, driven by the presence of major technology companies and a robust IP ecosystem. Europe is witnessing significant growth, fueled by increasing regulatory scrutiny and adoption of advanced royalty management solutions. Asia-Pacific is expected to exhibit high growth potential in the coming years, driven by increasing IP generation and licensing activities in emerging economies.
- North America: High market share due to established IP industries and early adoption of advanced technologies.
- Europe: Strong growth driven by stringent regulations and rising awareness of IP management best practices.
- Asia-Pacific: High growth potential driven by emerging economies and increasing IP generation.
- Key Drivers: Government initiatives supporting IP protection, technological advancements, and growing awareness of efficient royalty management.
Intellectual Property Rights Royalty Management Product Landscape
The market offers a range of solutions, from standalone software to integrated platforms offering comprehensive royalty management capabilities. These solutions incorporate advanced features such as automated reconciliation, real-time reporting, and advanced analytics. Unique selling propositions include ease of use, scalability, and integration with other enterprise systems. Technological advancements are focused on improving accuracy, efficiency, and security, with increasing emphasis on AI-driven automation.
Key Drivers, Barriers & Challenges in Intellectual Property Rights Royalty Management
Key Drivers: Increasing IP licensing deals, rising complexity of royalty calculations, need for improved accuracy and efficiency, and growing regulatory compliance requirements are major drivers.
Key Challenges: High implementation costs, integration complexities with existing systems, data security concerns, and lack of skilled professionals to manage the systems pose significant challenges. These challenges can lead to delays in implementation and potentially impact the ROI of implementing such systems.
Emerging Opportunities in Intellectual Property Rights Royalty Management
The increasing use of blockchain technology for secure and transparent royalty tracking presents significant opportunities. Expansion into untapped markets, particularly in emerging economies, offers further growth potential. Furthermore, innovative applications of AI and machine learning for predictive analytics and fraud detection are expected to shape the market.
Growth Accelerators in the Intellectual Property Rights Royalty Management Industry
Strategic partnerships between software providers and IP licensing agencies are driving market expansion. Technological breakthroughs, such as AI-powered analytics, are enhancing the efficiency and accuracy of royalty management processes. Market expansion strategies, focusing on developing economies and underserved industries, are vital for sustained growth.
Notable Milestones in Intellectual Property Rights Royalty Management Sector
- 2021 Q3: Anaqua launched its integrated IP management platform with enhanced royalty management features.
- 2022 Q1: Vistex acquired a smaller royalty management software company, expanding its market reach.
- 2023 Q2: IBM announced a new AI-powered royalty calculation tool.
- 2024 Q4: Several significant partnerships formed between royalty management software companies and major licensing agencies.
In-Depth Intellectual Property Rights Royalty Management Market Outlook
The IPR Royalty Management market is poised for continued strong growth, driven by technological advancements, increasing IP licensing activities, and a growing need for efficient and transparent royalty management solutions. Strategic partnerships and market expansion into emerging economies will play a crucial role in shaping future market dynamics. The market is expected to witness significant innovation in AI and blockchain applications, further enhancing the capabilities of existing solutions. Companies focusing on enhancing user experience and scalability will be best positioned to capitalize on future growth opportunities.
Intellectual Property Rights Royalty Management Segmentation
-
1. Application
- 1.1. Retail & Consumer Goods
- 1.2. IT & Telecommunication
- 1.3. Healthcare & Life Sciences
- 1.4. Travel & Hospitality
- 1.5. Media & Entertainment
- 1.6. Government
- 1.7. Publishing
- 1.8. Education
- 1.9. Manufacturing
-
2. Type
- 2.1. On-premise
- 2.2. Cloud/Hosted
Intellectual Property Rights Royalty Management Segmentation By Geography
-
1. North America
- 1.1. United States
- 1.2. Canada
- 1.3. Mexico
-
2. South America
- 2.1. Brazil
- 2.2. Argentina
- 2.3. Rest of South America
-
3. Europe
- 3.1. United Kingdom
- 3.2. Germany
- 3.3. France
- 3.4. Italy
- 3.5. Spain
- 3.6. Russia
- 3.7. Benelux
- 3.8. Nordics
- 3.9. Rest of Europe
-
4. Middle East & Africa
- 4.1. Turkey
- 4.2. Israel
- 4.3. GCC
- 4.4. North Africa
- 4.5. South Africa
- 4.6. Rest of Middle East & Africa
-
5. Asia Pacific
- 5.1. China
- 5.2. India
- 5.3. Japan
- 5.4. South Korea
- 5.5. ASEAN
- 5.6. Oceania
- 5.7. Rest of Asia Pacific
Intellectual Property Rights Royalty Management Regional Market Share
Geographic Coverage of Intellectual Property Rights Royalty Management
Intellectual Property Rights Royalty Management REPORT HIGHLIGHTS
| Aspects | Details |
|---|---|
| Study Period | 2020-2034 |
| Base Year | 2025 |
| Estimated Year | 2026 |
| Forecast Period | 2026-2034 |
| Historical Period | 2020-2025 |
| Growth Rate | CAGR of 19.6% from 2020-2034 |
| Segmentation |
|
Table of Contents
- 1. Introduction
- 1.1. Research Scope
- 1.2. Market Segmentation
- 1.3. Research Objective
- 1.4. Definitions and Assumptions
- 2. Executive Summary
- 2.1. Market Snapshot
- 3. Market Dynamics
- 3.1. Market Drivers
- 3.2. Market Restrains
- 3.3. Market Trends
- 3.4. Market Opportunities
- 4. Market Factor Analysis
- 4.1. Porters Five Forces
- 4.1.1. Bargaining Power of Suppliers
- 4.1.2. Bargaining Power of Buyers
- 4.1.3. Threat of New Entrants
- 4.1.4. Threat of Substitutes
- 4.1.5. Competitive Rivalry
- 4.2. PESTEL analysis
- 4.3. BCG Analysis
- 4.3.1. Stars (High Growth, High Market Share)
- 4.3.2. Cash Cows (Low Growth, High Market Share)
- 4.3.3. Question Mark (High Growth, Low Market Share)
- 4.3.4. Dogs (Low Growth, Low Market Share)
- 4.4. Ansoff Matrix Analysis
- 4.5. Supply Chain Analysis
- 4.6. Regulatory Landscape
- 4.7. Current Market Potential and Opportunity Assessment (TAM–SAM–SOM Framework)
- 4.8. VDR Analyst Note
- 4.1. Porters Five Forces
- 5. Market Analysis, Insights and Forecast 2021-2033
- 5.1. Market Analysis, Insights and Forecast - by Application
- 5.1.1. Retail & Consumer Goods
- 5.1.2. IT & Telecommunication
- 5.1.3. Healthcare & Life Sciences
- 5.1.4. Travel & Hospitality
- 5.1.5. Media & Entertainment
- 5.1.6. Government
- 5.1.7. Publishing
- 5.1.8. Education
- 5.1.9. Manufacturing
- 5.2. Market Analysis, Insights and Forecast - by Type
- 5.2.1. On-premise
- 5.2.2. Cloud/Hosted
- 5.3. Market Analysis, Insights and Forecast - by Region
- 5.3.1. North America
- 5.3.2. South America
- 5.3.3. Europe
- 5.3.4. Middle East & Africa
- 5.3.5. Asia Pacific
- 5.1. Market Analysis, Insights and Forecast - by Application
- 6. Global Intellectual Property Rights Royalty Management Analysis, Insights and Forecast, 2021-2033
- 6.1. Market Analysis, Insights and Forecast - by Application
- 6.1.1. Retail & Consumer Goods
- 6.1.2. IT & Telecommunication
- 6.1.3. Healthcare & Life Sciences
- 6.1.4. Travel & Hospitality
- 6.1.5. Media & Entertainment
- 6.1.6. Government
- 6.1.7. Publishing
- 6.1.8. Education
- 6.1.9. Manufacturing
- 6.2. Market Analysis, Insights and Forecast - by Type
- 6.2.1. On-premise
- 6.2.2. Cloud/Hosted
- 6.1. Market Analysis, Insights and Forecast - by Application
- 7. North America Intellectual Property Rights Royalty Management Analysis, Insights and Forecast, 2021-2033
- 7.1. Market Analysis, Insights and Forecast - by Application
- 7.1.1. Retail & Consumer Goods
- 7.1.2. IT & Telecommunication
- 7.1.3. Healthcare & Life Sciences
- 7.1.4. Travel & Hospitality
- 7.1.5. Media & Entertainment
- 7.1.6. Government
- 7.1.7. Publishing
- 7.1.8. Education
- 7.1.9. Manufacturing
- 7.2. Market Analysis, Insights and Forecast - by Type
- 7.2.1. On-premise
- 7.2.2. Cloud/Hosted
- 7.1. Market Analysis, Insights and Forecast - by Application
- 8. South America Intellectual Property Rights Royalty Management Analysis, Insights and Forecast, 2021-2033
- 8.1. Market Analysis, Insights and Forecast - by Application
- 8.1.1. Retail & Consumer Goods
- 8.1.2. IT & Telecommunication
- 8.1.3. Healthcare & Life Sciences
- 8.1.4. Travel & Hospitality
- 8.1.5. Media & Entertainment
- 8.1.6. Government
- 8.1.7. Publishing
- 8.1.8. Education
- 8.1.9. Manufacturing
- 8.2. Market Analysis, Insights and Forecast - by Type
- 8.2.1. On-premise
- 8.2.2. Cloud/Hosted
- 8.1. Market Analysis, Insights and Forecast - by Application
- 9. Europe Intellectual Property Rights Royalty Management Analysis, Insights and Forecast, 2021-2033
- 9.1. Market Analysis, Insights and Forecast - by Application
- 9.1.1. Retail & Consumer Goods
- 9.1.2. IT & Telecommunication
- 9.1.3. Healthcare & Life Sciences
- 9.1.4. Travel & Hospitality
- 9.1.5. Media & Entertainment
- 9.1.6. Government
- 9.1.7. Publishing
- 9.1.8. Education
- 9.1.9. Manufacturing
- 9.2. Market Analysis, Insights and Forecast - by Type
- 9.2.1. On-premise
- 9.2.2. Cloud/Hosted
- 9.1. Market Analysis, Insights and Forecast - by Application
- 10. Middle East & Africa Intellectual Property Rights Royalty Management Analysis, Insights and Forecast, 2021-2033
- 10.1. Market Analysis, Insights and Forecast - by Application
- 10.1.1. Retail & Consumer Goods
- 10.1.2. IT & Telecommunication
- 10.1.3. Healthcare & Life Sciences
- 10.1.4. Travel & Hospitality
- 10.1.5. Media & Entertainment
- 10.1.6. Government
- 10.1.7. Publishing
- 10.1.8. Education
- 10.1.9. Manufacturing
- 10.2. Market Analysis, Insights and Forecast - by Type
- 10.2.1. On-premise
- 10.2.2. Cloud/Hosted
- 10.1. Market Analysis, Insights and Forecast - by Application
- 11. Asia Pacific Intellectual Property Rights Royalty Management Analysis, Insights and Forecast, 2021-2033
- 11.1. Market Analysis, Insights and Forecast - by Application
- 11.1.1. Retail & Consumer Goods
- 11.1.2. IT & Telecommunication
- 11.1.3. Healthcare & Life Sciences
- 11.1.4. Travel & Hospitality
- 11.1.5. Media & Entertainment
- 11.1.6. Government
- 11.1.7. Publishing
- 11.1.8. Education
- 11.1.9. Manufacturing
- 11.2. Market Analysis, Insights and Forecast - by Type
- 11.2.1. On-premise
- 11.2.2. Cloud/Hosted
- 11.1. Market Analysis, Insights and Forecast - by Application
- 12. Competitive Analysis
- 12.1. Company Profiles
- 12.1.1 FADEL
- 12.1.1.1. Company Overview
- 12.1.1.2. Products
- 12.1.1.3. Company Financials
- 12.1.1.4. SWOT Analysis
- 12.1.2 Vistex
- 12.1.2.1. Company Overview
- 12.1.2.2. Products
- 12.1.2.3. Company Financials
- 12.1.2.4. SWOT Analysis
- 12.1.3 Klopotek
- 12.1.3.1. Company Overview
- 12.1.3.2. Products
- 12.1.3.3. Company Financials
- 12.1.3.4. SWOT Analysis
- 12.1.4 Filmtrack
- 12.1.4.1. Company Overview
- 12.1.4.2. Products
- 12.1.4.3. Company Financials
- 12.1.4.4. SWOT Analysis
- 12.1.5 IBM
- 12.1.5.1. Company Overview
- 12.1.5.2. Products
- 12.1.5.3. Company Financials
- 12.1.5.4. SWOT Analysis
- 12.1.6 Dependable Solutions
- 12.1.6.1. Company Overview
- 12.1.6.2. Products
- 12.1.6.3. Company Financials
- 12.1.6.4. SWOT Analysis
- 12.1.7 Anaqua
- 12.1.7.1. Company Overview
- 12.1.7.2. Products
- 12.1.7.3. Company Financials
- 12.1.7.4. SWOT Analysis
- 12.1.8 Lecorpio
- 12.1.8.1. Company Overview
- 12.1.8.2. Products
- 12.1.8.3. Company Financials
- 12.1.8.4. SWOT Analysis
- 12.1.9 Ipfolio
- 12.1.9.1. Company Overview
- 12.1.9.2. Products
- 12.1.9.3. Company Financials
- 12.1.9.4. SWOT Analysis
- 12.1.10 Capgemini
- 12.1.10.1. Company Overview
- 12.1.10.2. Products
- 12.1.10.3. Company Financials
- 12.1.10.4. SWOT Analysis
- 12.1.11 Oracle
- 12.1.11.1. Company Overview
- 12.1.11.2. Products
- 12.1.11.3. Company Financials
- 12.1.11.4. SWOT Analysis
- 12.1.1 FADEL
- 12.2. Market Entropy
- 12.2.1 Company's Key Areas Served
- 12.2.2 Recent Developments
- 12.3. Company Market Share Analysis 2025
- 12.3.1 Top 5 Companies Market Share Analysis
- 12.3.2 Top 3 Companies Market Share Analysis
- 12.4. List of Potential Customers
- 13. Research Methodology
List of Figures
- Figure 1: Global Intellectual Property Rights Royalty Management Revenue Breakdown (million, %) by Region 2025 & 2033
- Figure 2: North America Intellectual Property Rights Royalty Management Revenue (million), by Application 2025 & 2033
- Figure 3: North America Intellectual Property Rights Royalty Management Revenue Share (%), by Application 2025 & 2033
- Figure 4: North America Intellectual Property Rights Royalty Management Revenue (million), by Type 2025 & 2033
- Figure 5: North America Intellectual Property Rights Royalty Management Revenue Share (%), by Type 2025 & 2033
- Figure 6: North America Intellectual Property Rights Royalty Management Revenue (million), by Country 2025 & 2033
- Figure 7: North America Intellectual Property Rights Royalty Management Revenue Share (%), by Country 2025 & 2033
- Figure 8: South America Intellectual Property Rights Royalty Management Revenue (million), by Application 2025 & 2033
- Figure 9: South America Intellectual Property Rights Royalty Management Revenue Share (%), by Application 2025 & 2033
- Figure 10: South America Intellectual Property Rights Royalty Management Revenue (million), by Type 2025 & 2033
- Figure 11: South America Intellectual Property Rights Royalty Management Revenue Share (%), by Type 2025 & 2033
- Figure 12: South America Intellectual Property Rights Royalty Management Revenue (million), by Country 2025 & 2033
- Figure 13: South America Intellectual Property Rights Royalty Management Revenue Share (%), by Country 2025 & 2033
- Figure 14: Europe Intellectual Property Rights Royalty Management Revenue (million), by Application 2025 & 2033
- Figure 15: Europe Intellectual Property Rights Royalty Management Revenue Share (%), by Application 2025 & 2033
- Figure 16: Europe Intellectual Property Rights Royalty Management Revenue (million), by Type 2025 & 2033
- Figure 17: Europe Intellectual Property Rights Royalty Management Revenue Share (%), by Type 2025 & 2033
- Figure 18: Europe Intellectual Property Rights Royalty Management Revenue (million), by Country 2025 & 2033
- Figure 19: Europe Intellectual Property Rights Royalty Management Revenue Share (%), by Country 2025 & 2033
- Figure 20: Middle East & Africa Intellectual Property Rights Royalty Management Revenue (million), by Application 2025 & 2033
- Figure 21: Middle East & Africa Intellectual Property Rights Royalty Management Revenue Share (%), by Application 2025 & 2033
- Figure 22: Middle East & Africa Intellectual Property Rights Royalty Management Revenue (million), by Type 2025 & 2033
- Figure 23: Middle East & Africa Intellectual Property Rights Royalty Management Revenue Share (%), by Type 2025 & 2033
- Figure 24: Middle East & Africa Intellectual Property Rights Royalty Management Revenue (million), by Country 2025 & 2033
- Figure 25: Middle East & Africa Intellectual Property Rights Royalty Management Revenue Share (%), by Country 2025 & 2033
- Figure 26: Asia Pacific Intellectual Property Rights Royalty Management Revenue (million), by Application 2025 & 2033
- Figure 27: Asia Pacific Intellectual Property Rights Royalty Management Revenue Share (%), by Application 2025 & 2033
- Figure 28: Asia Pacific Intellectual Property Rights Royalty Management Revenue (million), by Type 2025 & 2033
- Figure 29: Asia Pacific Intellectual Property Rights Royalty Management Revenue Share (%), by Type 2025 & 2033
- Figure 30: Asia Pacific Intellectual Property Rights Royalty Management Revenue (million), by Country 2025 & 2033
- Figure 31: Asia Pacific Intellectual Property Rights Royalty Management Revenue Share (%), by Country 2025 & 2033
List of Tables
- Table 1: Global Intellectual Property Rights Royalty Management Revenue million Forecast, by Application 2020 & 2033
- Table 2: Global Intellectual Property Rights Royalty Management Revenue million Forecast, by Type 2020 & 2033
- Table 3: Global Intellectual Property Rights Royalty Management Revenue million Forecast, by Region 2020 & 2033
- Table 4: Global Intellectual Property Rights Royalty Management Revenue million Forecast, by Application 2020 & 2033
- Table 5: Global Intellectual Property Rights Royalty Management Revenue million Forecast, by Type 2020 & 2033
- Table 6: Global Intellectual Property Rights Royalty Management Revenue million Forecast, by Country 2020 & 2033
- Table 7: United States Intellectual Property Rights Royalty Management Revenue (million) Forecast, by Application 2020 & 2033
- Table 8: Canada Intellectual Property Rights Royalty Management Revenue (million) Forecast, by Application 2020 & 2033
- Table 9: Mexico Intellectual Property Rights Royalty Management Revenue (million) Forecast, by Application 2020 & 2033
- Table 10: Global Intellectual Property Rights Royalty Management Revenue million Forecast, by Application 2020 & 2033
- Table 11: Global Intellectual Property Rights Royalty Management Revenue million Forecast, by Type 2020 & 2033
- Table 12: Global Intellectual Property Rights Royalty Management Revenue million Forecast, by Country 2020 & 2033
- Table 13: Brazil Intellectual Property Rights Royalty Management Revenue (million) Forecast, by Application 2020 & 2033
- Table 14: Argentina Intellectual Property Rights Royalty Management Revenue (million) Forecast, by Application 2020 & 2033
- Table 15: Rest of South America Intellectual Property Rights Royalty Management Revenue (million) Forecast, by Application 2020 & 2033
- Table 16: Global Intellectual Property Rights Royalty Management Revenue million Forecast, by Application 2020 & 2033
- Table 17: Global Intellectual Property Rights Royalty Management Revenue million Forecast, by Type 2020 & 2033
- Table 18: Global Intellectual Property Rights Royalty Management Revenue million Forecast, by Country 2020 & 2033
- Table 19: United Kingdom Intellectual Property Rights Royalty Management Revenue (million) Forecast, by Application 2020 & 2033
- Table 20: Germany Intellectual Property Rights Royalty Management Revenue (million) Forecast, by Application 2020 & 2033
- Table 21: France Intellectual Property Rights Royalty Management Revenue (million) Forecast, by Application 2020 & 2033
- Table 22: Italy Intellectual Property Rights Royalty Management Revenue (million) Forecast, by Application 2020 & 2033
- Table 23: Spain Intellectual Property Rights Royalty Management Revenue (million) Forecast, by Application 2020 & 2033
- Table 24: Russia Intellectual Property Rights Royalty Management Revenue (million) Forecast, by Application 2020 & 2033
- Table 25: Benelux Intellectual Property Rights Royalty Management Revenue (million) Forecast, by Application 2020 & 2033
- Table 26: Nordics Intellectual Property Rights Royalty Management Revenue (million) Forecast, by Application 2020 & 2033
- Table 27: Rest of Europe Intellectual Property Rights Royalty Management Revenue (million) Forecast, by Application 2020 & 2033
- Table 28: Global Intellectual Property Rights Royalty Management Revenue million Forecast, by Application 2020 & 2033
- Table 29: Global Intellectual Property Rights Royalty Management Revenue million Forecast, by Type 2020 & 2033
- Table 30: Global Intellectual Property Rights Royalty Management Revenue million Forecast, by Country 2020 & 2033
- Table 31: Turkey Intellectual Property Rights Royalty Management Revenue (million) Forecast, by Application 2020 & 2033
- Table 32: Israel Intellectual Property Rights Royalty Management Revenue (million) Forecast, by Application 2020 & 2033
- Table 33: GCC Intellectual Property Rights Royalty Management Revenue (million) Forecast, by Application 2020 & 2033
- Table 34: North Africa Intellectual Property Rights Royalty Management Revenue (million) Forecast, by Application 2020 & 2033
- Table 35: South Africa Intellectual Property Rights Royalty Management Revenue (million) Forecast, by Application 2020 & 2033
- Table 36: Rest of Middle East & Africa Intellectual Property Rights Royalty Management Revenue (million) Forecast, by Application 2020 & 2033
- Table 37: Global Intellectual Property Rights Royalty Management Revenue million Forecast, by Application 2020 & 2033
- Table 38: Global Intellectual Property Rights Royalty Management Revenue million Forecast, by Type 2020 & 2033
- Table 39: Global Intellectual Property Rights Royalty Management Revenue million Forecast, by Country 2020 & 2033
- Table 40: China Intellectual Property Rights Royalty Management Revenue (million) Forecast, by Application 2020 & 2033
- Table 41: India Intellectual Property Rights Royalty Management Revenue (million) Forecast, by Application 2020 & 2033
- Table 42: Japan Intellectual Property Rights Royalty Management Revenue (million) Forecast, by Application 2020 & 2033
- Table 43: South Korea Intellectual Property Rights Royalty Management Revenue (million) Forecast, by Application 2020 & 2033
- Table 44: ASEAN Intellectual Property Rights Royalty Management Revenue (million) Forecast, by Application 2020 & 2033
- Table 45: Oceania Intellectual Property Rights Royalty Management Revenue (million) Forecast, by Application 2020 & 2033
- Table 46: Rest of Asia Pacific Intellectual Property Rights Royalty Management Revenue (million) Forecast, by Application 2020 & 2033
Frequently Asked Questions
1. What is the projected Compound Annual Growth Rate (CAGR) of the Intellectual Property Rights Royalty Management?
The projected CAGR is approximately 19.6%.
2. Which companies are prominent players in the Intellectual Property Rights Royalty Management?
Key companies in the market include FADEL, Vistex, Klopotek, Filmtrack, IBM, Dependable Solutions, Anaqua, Lecorpio, Ipfolio, Capgemini, Oracle.
3. What are the main segments of the Intellectual Property Rights Royalty Management?
The market segments include Application, Type.
4. Can you provide details about the market size?
The market size is estimated to be USD 32390 million as of 2022.
5. What are some drivers contributing to market growth?
N/A
6. What are the notable trends driving market growth?
N/A
7. Are there any restraints impacting market growth?
N/A
8. Can you provide examples of recent developments in the market?
N/A
9. What pricing options are available for accessing the report?
Pricing options include single-user, multi-user, and enterprise licenses priced at USD 3950.00, USD 5925.00, and USD 7900.00 respectively.
10. Is the market size provided in terms of value or volume?
The market size is provided in terms of value, measured in million.
11. Are there any specific market keywords associated with the report?
Yes, the market keyword associated with the report is "Intellectual Property Rights Royalty Management," which aids in identifying and referencing the specific market segment covered.
12. How do I determine which pricing option suits my needs best?
The pricing options vary based on user requirements and access needs. Individual users may opt for single-user licenses, while businesses requiring broader access may choose multi-user or enterprise licenses for cost-effective access to the report.
13. Are there any additional resources or data provided in the Intellectual Property Rights Royalty Management report?
While the report offers comprehensive insights, it's advisable to review the specific contents or supplementary materials provided to ascertain if additional resources or data are available.
14. How can I stay updated on further developments or reports in the Intellectual Property Rights Royalty Management?
To stay informed about further developments, trends, and reports in the Intellectual Property Rights Royalty Management, consider subscribing to industry newsletters, following relevant companies and organizations, or regularly checking reputable industry news sources and publications.
Methodology
Step 1 - Identification of Relevant Samples Size from Population Database


Step 2 - Approaches for Defining Global Market Size (Value, Volume* & Price*)

Note*: In applicable scenarios
Step 3 - Data Sources
Primary Research
- Web Analytics
- Survey Reports
- Research Institute
- Latest Research Reports
- Opinion Leaders
Secondary Research
- Annual Reports
- White Paper
- Latest Press Release
- Industry Association
- Paid Database
- Investor Presentations

Step 4 - Data Triangulation
Involves using different sources of information in order to increase the validity of a study
These sources are likely to be stakeholders in a program - participants, other researchers, program staff, other community members, and so on.
Then we put all data in single framework & apply various statistical tools to find out the dynamic on the market.
During the analysis stage, feedback from the stakeholder groups would be compared to determine areas of agreement as well as areas of divergence