
Key Insights
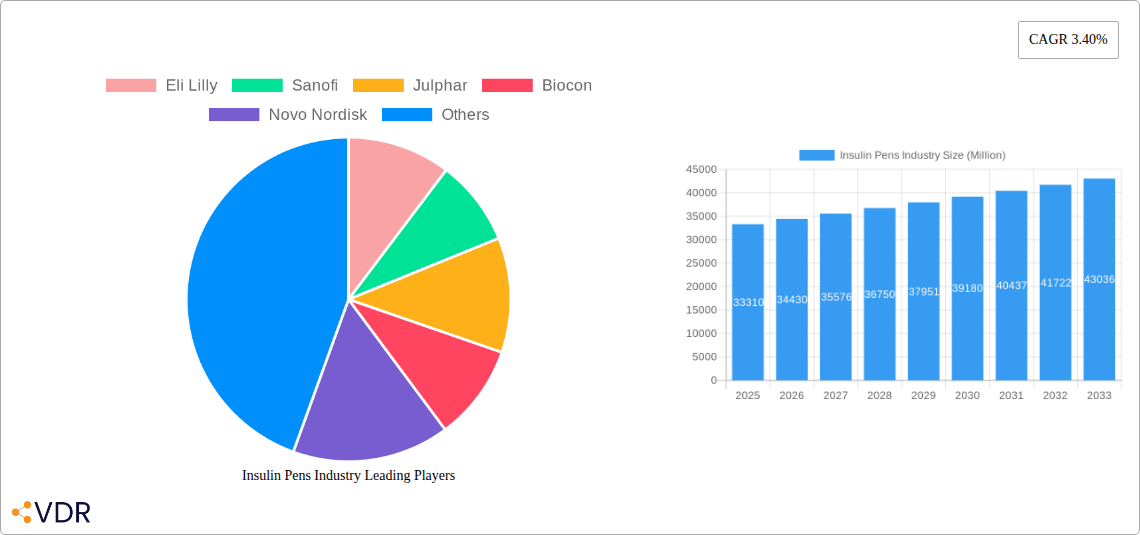
The global insulin pens market, valued at $33.31 billion in 2025, is projected to experience steady growth, driven by the increasing prevalence of diabetes worldwide and a rising preference for convenient and user-friendly insulin delivery systems. The market's Compound Annual Growth Rate (CAGR) of 3.40% from 2025 to 2033 reflects a consistent demand fueled by advancements in pen technology, such as pre-filled pens and improved needle design, enhancing patient compliance and reducing injection-related discomfort. Key players like Eli Lilly, Sanofi, Novo Nordisk, and others are constantly innovating to improve product efficacy, safety, and user experience, driving competition and fostering market expansion. The reusable cartridge pen segment likely holds a significant market share, benefitting from cost-effectiveness and environmental sustainability compared to disposable pens. However, the disposable pen segment is expected to maintain strong growth due to its ease of use and reduced risk of contamination. Geographic variations in market penetration are expected, with North America and Europe maintaining substantial market shares due to high diabetes prevalence and robust healthcare infrastructure. Emerging economies in Asia Pacific, particularly India and China, are expected to witness significant growth, driven by increasing diabetes awareness and rising disposable incomes. Regulatory approvals and pricing policies in different regions will also play a crucial role in shaping market dynamics throughout the forecast period.
The restraints on market growth could include high treatment costs, particularly in low- and middle-income countries, potentially limiting access to insulin pens. The availability of alternative insulin delivery methods, such as insulin pumps, may also influence market growth. However, the increasing awareness of the benefits of insulin pens in terms of improved patient convenience and self-management is likely to outweigh these challenges and contribute to sustained market expansion. Furthermore, ongoing research and development efforts focused on improved insulin formulations and delivery technologies will continue to propel market growth in the coming years. The evolving healthcare landscape, including telehealth and remote patient monitoring, presents opportunities for increased market penetration.
Insulin Pens Industry Market Report: 2019-2033
This comprehensive report provides a detailed analysis of the global insulin pens market, encompassing historical data (2019-2024), current estimates (2025), and future projections (2025-2033). It delves into market dynamics, growth trends, regional dominance, product landscapes, key players, and emerging opportunities within the parent market of diabetes care devices and the child market of insulin delivery systems. The report offers invaluable insights for industry professionals, investors, and strategic decision-makers seeking to understand and capitalize on the evolving insulin pens landscape. The market size is presented in million units.
Insulin Pens Industry Market Dynamics & Structure
The insulin pens market is characterized by moderate concentration, with key players like Novo Nordisk, Sanofi, and Eli Lilly holding significant market share (estimated at xx%, xx%, and xx% respectively in 2025). Technological innovation, particularly in areas like smart pens and connected devices, is a major driver, while regulatory approvals and reimbursement policies significantly influence market access. Competitive pressures stem from the availability of alternative insulin delivery methods, such as insulin pumps. The market exhibits a strong correlation with the prevalence of diabetes, particularly type 1 and type 2, influencing end-user demographics and driving demand. M&A activity in the sector has been relatively modest in recent years, with xx major deals recorded between 2019 and 2024, primarily focused on enhancing technology and expanding market reach.
- Market Concentration: Moderately concentrated, with top 3 players holding xx% market share.
- Technological Innovation: Smart pens and connected devices are key drivers.
- Regulatory Landscape: Stringent approvals and reimbursement policies impact market access.
- Competitive Substitutes: Insulin pumps and other delivery systems pose competition.
- End-User Demographics: Directly correlated with diabetes prevalence.
- M&A Activity: xx major deals (2019-2024), focusing on technology and market expansion.
- Innovation Barriers: High R&D costs, stringent regulatory pathways.
Insulin Pens Industry Growth Trends & Insights
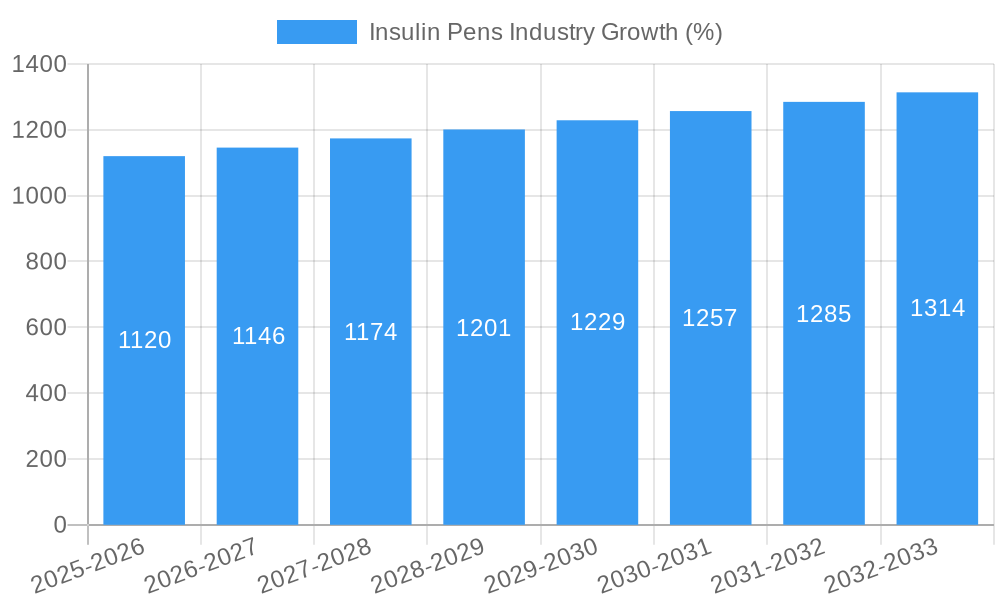
The global insulin pens market experienced steady growth during the historical period (2019-2024), with a CAGR of xx%. This growth is attributed to increasing diabetes prevalence globally, rising awareness of insulin therapy, and the increasing adoption of convenient and user-friendly insulin pens compared to traditional syringes. Technological advancements, such as the introduction of smart pens with integrated glucose monitoring capabilities, are further propelling market expansion. Consumer behavior shifts toward personalized medicine and remote monitoring solutions are also driving demand for sophisticated insulin pens. The market is projected to maintain a strong growth trajectory during the forecast period (2025-2033), with a projected CAGR of xx%, driven by factors such as expanding diabetes patient populations in emerging markets and continuous innovation in insulin pen technology. Market penetration is estimated at xx% in 2025, with further growth potential in underserved regions.
Dominant Regions, Countries, or Segments in Insulin Pens Industry
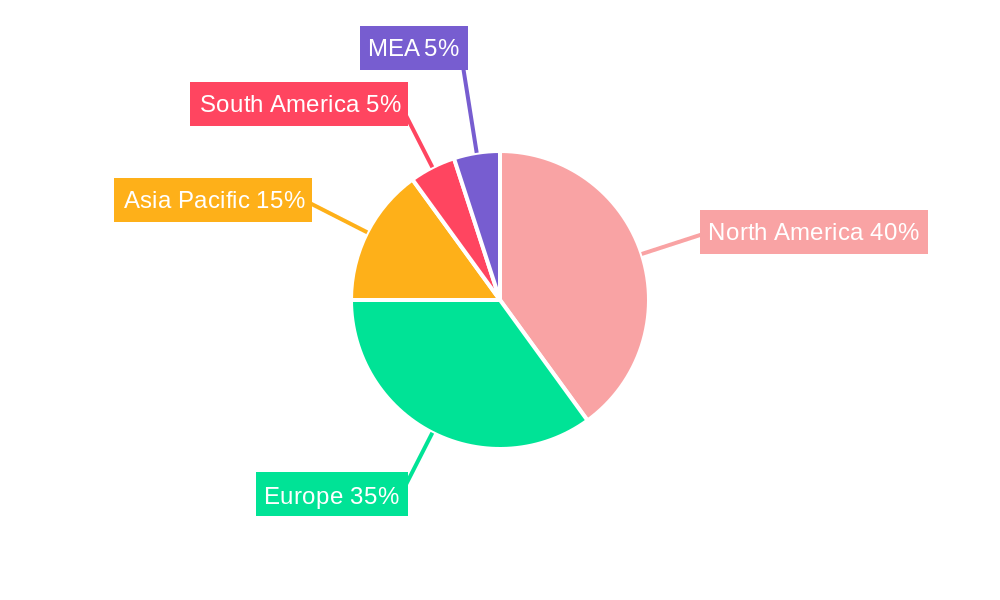
North America currently holds the largest market share in the insulin pens industry, driven by high diabetes prevalence, robust healthcare infrastructure, and strong adoption of advanced insulin delivery technologies. Within the product segments, reusable pens (cartridge) maintain a larger market share compared to disposable pens due to cost-effectiveness and reusability. However, disposable pens are witnessing significant growth, particularly in emerging markets due to their convenience and reduced risk of infection.
- Key Drivers in North America: High diabetes prevalence, advanced healthcare infrastructure, strong adoption of advanced technologies.
- Key Drivers in Emerging Markets: Rising diabetes prevalence, increasing disposable income, government initiatives promoting diabetes care.
- Reusable Pens (Cartridge): Larger market share due to cost-effectiveness.
- Disposable Pens: Strong growth in emerging markets due to convenience and hygiene.
Insulin Pens Industry Product Landscape
The insulin pen market offers a diverse range of products, from basic reusable pens with pre-filled cartridges to advanced smart pens with integrated features like dose tracking, connectivity, and personalized insulin delivery guidance. These advancements enhance patient convenience, improve medication adherence, and enable better diabetes management. Key innovations include smaller pen sizes for improved portability, smoother injection mechanisms, and improved dose accuracy. Unique selling propositions revolve around ease of use, precision, and integrated technological features, providing a competitive edge in a rapidly evolving market.
Key Drivers, Barriers & Challenges in Insulin Pens Industry
Key Drivers:
- Increasing prevalence of diabetes worldwide.
- Growing preference for convenient and user-friendly insulin delivery systems.
- Technological advancements, leading to the development of smart insulin pens.
- Favorable regulatory environments in several regions.
Challenges:
- High cost of insulin and insulin pens, limiting accessibility in low- and middle-income countries.
- Intense competition from existing players and emerging companies.
- Stringent regulatory approvals and reimbursement policies can delay product launches.
- Potential supply chain disruptions impacting manufacturing and distribution.
Emerging Opportunities in Insulin Pens Industry
Emerging markets in Asia and Africa present significant untapped potential for growth. The development of integrated diabetes management platforms combining insulin pens with glucose monitoring and data analytics offers opportunities for personalized medicine and improved patient outcomes. Furthermore, integrating artificial intelligence (AI) and machine learning into smart insulin pens to optimize insulin delivery and predict hypoglycemic events could be a game-changer.
Growth Accelerators in the Insulin Pens Industry
Strategic partnerships between insulin pen manufacturers and technology companies are driving innovation. Investments in R&D aimed at developing next-generation smart pens with enhanced features and functionalities, such as predictive analytics and personalized dosing, are also accelerating market growth. Expansion into underserved markets and increased awareness campaigns focusing on the benefits of insulin pen therapy are boosting market penetration.
Key Players Shaping the Insulin Pens Industry Market
- Eli Lilly
- Sanofi
- Julphar
- Biocon
- Novo Nordisk
Notable Milestones in Insulin Pens Industry Sector
- May 2021: Bigfoot Biomedical received FDA clearance for a smart insulin pen cap, enhancing insulin injection precision and safety.
- Nov 2022: Eli Lilly launched the Tempo Personalized Diabetes Management Platform, incorporating a smart button, app, and pre-filled insulin pen for personalized guidance in diabetes management.
In-Depth Insulin Pens Industry Market Outlook
The future of the insulin pens market is bright, driven by continuous technological advancements, expansion into new markets, and rising diabetes prevalence. Strategic partnerships and investments in R&D will play a pivotal role in shaping the market landscape. The focus on personalized medicine and integrated diabetes management solutions presents significant opportunities for both established players and emerging companies. The market is poised for substantial growth in the coming years, presenting lucrative investment prospects and opportunities for innovation.
Insulin Pens Industry Segmentation
-
1. Product
- 1.1. Reusable pens (Cartridge)
- 1.2. Disposable Pens
Insulin Pens Industry Segmentation By Geography
-
1. North America
- 1.1. United States
- 1.2. Canada
- 1.3. Rest of North America
-
2. Europe
- 2.1. Germany
- 2.2. United Kingdom
- 2.3. France
- 2.4. Russia
- 2.5. Spain
- 2.6. Italy
- 2.7. Rest of Europe
-
3. Asia Pacific
- 3.1. India
- 3.2. China
- 3.3. Japan
- 3.4. South Korea
- 3.5. Australia
- 3.6. Vietnam
- 3.7. Malaysia
- 3.8. Indonesia
- 3.9. Philippines
- 3.10. Thailand
- 3.11. Rest of the Asia Pacific
-
4. Latin America
- 4.1. Brazil
- 4.2. Mexico
- 4.3. Rest of Latin America
-
5. Middle East and Africa
- 5.1. Egypt
- 5.2. Saudi Arabia
- 5.3. Iran
- 5.4. South Africa
- 5.5. Oman
- 5.6. Rest of the Middle East and Africa
Insulin Pens Industry REPORT HIGHLIGHTS
| Aspects | Details |
|---|---|
| Study Period | 2019-2033 |
| Base Year | 2024 |
| Estimated Year | 2025 |
| Forecast Period | 2025-2033 |
| Historical Period | 2019-2024 |
| Growth Rate | CAGR of 3.40% from 2019-2033 |
| Segmentation |
|
Table of Contents
- 1. Introduction
- 1.1. Research Scope
- 1.2. Market Segmentation
- 1.3. Research Methodology
- 1.4. Definitions and Assumptions
- 2. Executive Summary
- 2.1. Introduction
- 3. Market Dynamics
- 3.1. Introduction
- 3.2. Market Drivers
- 3.2.1. ; The Rise in Global Prevalence of Cases of Obesity due to Modern Sedentary Lifestyles; Rise in Awareness and Disposable Income in Developed Economies
- 3.3. Market Restrains
- 3.3.1 ; Highly Cost of Branded Products in Emerging Countries; Severe Adverse Associated with Medication Including Seizures
- 3.3.2 Suicidal Attempts and Even Death; Adoption of Traditional Yoga and Herbal Products
- 3.4. Market Trends
- 3.4.1. The Market is Expected to Grow as the Number of Diabetes Patients Increase Year-On-Year
- 4. Market Factor Analysis
- 4.1. Porters Five Forces
- 4.2. Supply/Value Chain
- 4.3. PESTEL analysis
- 4.4. Market Entropy
- 4.5. Patent/Trademark Analysis
- 5. Global Insulin Pens Industry Analysis, Insights and Forecast, 2019-2031
- 5.1. Market Analysis, Insights and Forecast - by Product
- 5.1.1. Reusable pens (Cartridge)
- 5.1.2. Disposable Pens
- 5.2. Market Analysis, Insights and Forecast - by Region
- 5.2.1. North America
- 5.2.2. Europe
- 5.2.3. Asia Pacific
- 5.2.4. Latin America
- 5.2.5. Middle East and Africa
- 5.1. Market Analysis, Insights and Forecast - by Product
- 6. North America Insulin Pens Industry Analysis, Insights and Forecast, 2019-2031
- 6.1. Market Analysis, Insights and Forecast - by Product
- 6.1.1. Reusable pens (Cartridge)
- 6.1.2. Disposable Pens
- 6.1. Market Analysis, Insights and Forecast - by Product
- 7. Europe Insulin Pens Industry Analysis, Insights and Forecast, 2019-2031
- 7.1. Market Analysis, Insights and Forecast - by Product
- 7.1.1. Reusable pens (Cartridge)
- 7.1.2. Disposable Pens
- 7.1. Market Analysis, Insights and Forecast - by Product
- 8. Asia Pacific Insulin Pens Industry Analysis, Insights and Forecast, 2019-2031
- 8.1. Market Analysis, Insights and Forecast - by Product
- 8.1.1. Reusable pens (Cartridge)
- 8.1.2. Disposable Pens
- 8.1. Market Analysis, Insights and Forecast - by Product
- 9. Latin America Insulin Pens Industry Analysis, Insights and Forecast, 2019-2031
- 9.1. Market Analysis, Insights and Forecast - by Product
- 9.1.1. Reusable pens (Cartridge)
- 9.1.2. Disposable Pens
- 9.1. Market Analysis, Insights and Forecast - by Product
- 10. Middle East and Africa Insulin Pens Industry Analysis, Insights and Forecast, 2019-2031
- 10.1. Market Analysis, Insights and Forecast - by Product
- 10.1.1. Reusable pens (Cartridge)
- 10.1.2. Disposable Pens
- 10.1. Market Analysis, Insights and Forecast - by Product
- 11. North America Insulin Pens Industry Analysis, Insights and Forecast, 2019-2031
- 11.1. Market Analysis, Insights and Forecast - By Country/Sub-region
- 11.1.1 United States
- 11.1.2 Canada
- 11.1.3 Mexico
- 12. Europe Insulin Pens Industry Analysis, Insights and Forecast, 2019-2031
- 12.1. Market Analysis, Insights and Forecast - By Country/Sub-region
- 12.1.1 Germany
- 12.1.2 United Kingdom
- 12.1.3 France
- 12.1.4 Spain
- 12.1.5 Italy
- 12.1.6 Spain
- 12.1.7 Belgium
- 12.1.8 Netherland
- 12.1.9 Nordics
- 12.1.10 Rest of Europe
- 13. Asia Pacific Insulin Pens Industry Analysis, Insights and Forecast, 2019-2031
- 13.1. Market Analysis, Insights and Forecast - By Country/Sub-region
- 13.1.1 China
- 13.1.2 Japan
- 13.1.3 India
- 13.1.4 South Korea
- 13.1.5 Southeast Asia
- 13.1.6 Australia
- 13.1.7 Indonesia
- 13.1.8 Phillipes
- 13.1.9 Singapore
- 13.1.10 Thailandc
- 13.1.11 Rest of Asia Pacific
- 14. South America Insulin Pens Industry Analysis, Insights and Forecast, 2019-2031
- 14.1. Market Analysis, Insights and Forecast - By Country/Sub-region
- 14.1.1 Brazil
- 14.1.2 Argentina
- 14.1.3 Peru
- 14.1.4 Chile
- 14.1.5 Colombia
- 14.1.6 Ecuador
- 14.1.7 Venezuela
- 14.1.8 Rest of South America
- 15. North America Insulin Pens Industry Analysis, Insights and Forecast, 2019-2031
- 15.1. Market Analysis, Insights and Forecast - By Country/Sub-region
- 15.1.1 United States
- 15.1.2 Canada
- 15.1.3 Mexico
- 16. MEA Insulin Pens Industry Analysis, Insights and Forecast, 2019-2031
- 16.1. Market Analysis, Insights and Forecast - By Country/Sub-region
- 16.1.1 United Arab Emirates
- 16.1.2 Saudi Arabia
- 16.1.3 South Africa
- 16.1.4 Rest of Middle East and Africa
- 17. Competitive Analysis
- 17.1. Global Market Share Analysis 2024
- 17.2. Company Profiles
- 17.2.1 Eli Lilly
- 17.2.1.1. Overview
- 17.2.1.2. Products
- 17.2.1.3. SWOT Analysis
- 17.2.1.4. Recent Developments
- 17.2.1.5. Financials (Based on Availability)
- 17.2.2 Sanofi
- 17.2.2.1. Overview
- 17.2.2.2. Products
- 17.2.2.3. SWOT Analysis
- 17.2.2.4. Recent Developments
- 17.2.2.5. Financials (Based on Availability)
- 17.2.3 Julphar
- 17.2.3.1. Overview
- 17.2.3.2. Products
- 17.2.3.3. SWOT Analysis
- 17.2.3.4. Recent Developments
- 17.2.3.5. Financials (Based on Availability)
- 17.2.4 Biocon
- 17.2.4.1. Overview
- 17.2.4.2. Products
- 17.2.4.3. SWOT Analysis
- 17.2.4.4. Recent Developments
- 17.2.4.5. Financials (Based on Availability)
- 17.2.5 Novo Nordisk
- 17.2.5.1. Overview
- 17.2.5.2. Products
- 17.2.5.3. SWOT Analysis
- 17.2.5.4. Recent Developments
- 17.2.5.5. Financials (Based on Availability)
- 17.2.1 Eli Lilly
List of Figures
- Figure 1: Global Insulin Pens Industry Revenue Breakdown (Million, %) by Region 2024 & 2032
- Figure 2: Global Insulin Pens Industry Volume Breakdown (K Unit, %) by Region 2024 & 2032
- Figure 3: North America Insulin Pens Industry Revenue (Million), by Country 2024 & 2032
- Figure 4: North America Insulin Pens Industry Volume (K Unit), by Country 2024 & 2032
- Figure 5: North America Insulin Pens Industry Revenue Share (%), by Country 2024 & 2032
- Figure 6: North America Insulin Pens Industry Volume Share (%), by Country 2024 & 2032
- Figure 7: Europe Insulin Pens Industry Revenue (Million), by Country 2024 & 2032
- Figure 8: Europe Insulin Pens Industry Volume (K Unit), by Country 2024 & 2032
- Figure 9: Europe Insulin Pens Industry Revenue Share (%), by Country 2024 & 2032
- Figure 10: Europe Insulin Pens Industry Volume Share (%), by Country 2024 & 2032
- Figure 11: Asia Pacific Insulin Pens Industry Revenue (Million), by Country 2024 & 2032
- Figure 12: Asia Pacific Insulin Pens Industry Volume (K Unit), by Country 2024 & 2032
- Figure 13: Asia Pacific Insulin Pens Industry Revenue Share (%), by Country 2024 & 2032
- Figure 14: Asia Pacific Insulin Pens Industry Volume Share (%), by Country 2024 & 2032
- Figure 15: South America Insulin Pens Industry Revenue (Million), by Country 2024 & 2032
- Figure 16: South America Insulin Pens Industry Volume (K Unit), by Country 2024 & 2032
- Figure 17: South America Insulin Pens Industry Revenue Share (%), by Country 2024 & 2032
- Figure 18: South America Insulin Pens Industry Volume Share (%), by Country 2024 & 2032
- Figure 19: North America Insulin Pens Industry Revenue (Million), by Country 2024 & 2032
- Figure 20: North America Insulin Pens Industry Volume (K Unit), by Country 2024 & 2032
- Figure 21: North America Insulin Pens Industry Revenue Share (%), by Country 2024 & 2032
- Figure 22: North America Insulin Pens Industry Volume Share (%), by Country 2024 & 2032
- Figure 23: MEA Insulin Pens Industry Revenue (Million), by Country 2024 & 2032
- Figure 24: MEA Insulin Pens Industry Volume (K Unit), by Country 2024 & 2032
- Figure 25: MEA Insulin Pens Industry Revenue Share (%), by Country 2024 & 2032
- Figure 26: MEA Insulin Pens Industry Volume Share (%), by Country 2024 & 2032
- Figure 27: North America Insulin Pens Industry Revenue (Million), by Product 2024 & 2032
- Figure 28: North America Insulin Pens Industry Volume (K Unit), by Product 2024 & 2032
- Figure 29: North America Insulin Pens Industry Revenue Share (%), by Product 2024 & 2032
- Figure 30: North America Insulin Pens Industry Volume Share (%), by Product 2024 & 2032
- Figure 31: North America Insulin Pens Industry Revenue (Million), by Country 2024 & 2032
- Figure 32: North America Insulin Pens Industry Volume (K Unit), by Country 2024 & 2032
- Figure 33: North America Insulin Pens Industry Revenue Share (%), by Country 2024 & 2032
- Figure 34: North America Insulin Pens Industry Volume Share (%), by Country 2024 & 2032
- Figure 35: Europe Insulin Pens Industry Revenue (Million), by Product 2024 & 2032
- Figure 36: Europe Insulin Pens Industry Volume (K Unit), by Product 2024 & 2032
- Figure 37: Europe Insulin Pens Industry Revenue Share (%), by Product 2024 & 2032
- Figure 38: Europe Insulin Pens Industry Volume Share (%), by Product 2024 & 2032
- Figure 39: Europe Insulin Pens Industry Revenue (Million), by Country 2024 & 2032
- Figure 40: Europe Insulin Pens Industry Volume (K Unit), by Country 2024 & 2032
- Figure 41: Europe Insulin Pens Industry Revenue Share (%), by Country 2024 & 2032
- Figure 42: Europe Insulin Pens Industry Volume Share (%), by Country 2024 & 2032
- Figure 43: Asia Pacific Insulin Pens Industry Revenue (Million), by Product 2024 & 2032
- Figure 44: Asia Pacific Insulin Pens Industry Volume (K Unit), by Product 2024 & 2032
- Figure 45: Asia Pacific Insulin Pens Industry Revenue Share (%), by Product 2024 & 2032
- Figure 46: Asia Pacific Insulin Pens Industry Volume Share (%), by Product 2024 & 2032
- Figure 47: Asia Pacific Insulin Pens Industry Revenue (Million), by Country 2024 & 2032
- Figure 48: Asia Pacific Insulin Pens Industry Volume (K Unit), by Country 2024 & 2032
- Figure 49: Asia Pacific Insulin Pens Industry Revenue Share (%), by Country 2024 & 2032
- Figure 50: Asia Pacific Insulin Pens Industry Volume Share (%), by Country 2024 & 2032
- Figure 51: Latin America Insulin Pens Industry Revenue (Million), by Product 2024 & 2032
- Figure 52: Latin America Insulin Pens Industry Volume (K Unit), by Product 2024 & 2032
- Figure 53: Latin America Insulin Pens Industry Revenue Share (%), by Product 2024 & 2032
- Figure 54: Latin America Insulin Pens Industry Volume Share (%), by Product 2024 & 2032
- Figure 55: Latin America Insulin Pens Industry Revenue (Million), by Country 2024 & 2032
- Figure 56: Latin America Insulin Pens Industry Volume (K Unit), by Country 2024 & 2032
- Figure 57: Latin America Insulin Pens Industry Revenue Share (%), by Country 2024 & 2032
- Figure 58: Latin America Insulin Pens Industry Volume Share (%), by Country 2024 & 2032
- Figure 59: Middle East and Africa Insulin Pens Industry Revenue (Million), by Product 2024 & 2032
- Figure 60: Middle East and Africa Insulin Pens Industry Volume (K Unit), by Product 2024 & 2032
- Figure 61: Middle East and Africa Insulin Pens Industry Revenue Share (%), by Product 2024 & 2032
- Figure 62: Middle East and Africa Insulin Pens Industry Volume Share (%), by Product 2024 & 2032
- Figure 63: Middle East and Africa Insulin Pens Industry Revenue (Million), by Country 2024 & 2032
- Figure 64: Middle East and Africa Insulin Pens Industry Volume (K Unit), by Country 2024 & 2032
- Figure 65: Middle East and Africa Insulin Pens Industry Revenue Share (%), by Country 2024 & 2032
- Figure 66: Middle East and Africa Insulin Pens Industry Volume Share (%), by Country 2024 & 2032
List of Tables
- Table 1: Global Insulin Pens Industry Revenue Million Forecast, by Region 2019 & 2032
- Table 2: Global Insulin Pens Industry Volume K Unit Forecast, by Region 2019 & 2032
- Table 3: Global Insulin Pens Industry Revenue Million Forecast, by Product 2019 & 2032
- Table 4: Global Insulin Pens Industry Volume K Unit Forecast, by Product 2019 & 2032
- Table 5: Global Insulin Pens Industry Revenue Million Forecast, by Region 2019 & 2032
- Table 6: Global Insulin Pens Industry Volume K Unit Forecast, by Region 2019 & 2032
- Table 7: Global Insulin Pens Industry Revenue Million Forecast, by Country 2019 & 2032
- Table 8: Global Insulin Pens Industry Volume K Unit Forecast, by Country 2019 & 2032
- Table 9: United States Insulin Pens Industry Revenue (Million) Forecast, by Application 2019 & 2032
- Table 10: United States Insulin Pens Industry Volume (K Unit) Forecast, by Application 2019 & 2032
- Table 11: Canada Insulin Pens Industry Revenue (Million) Forecast, by Application 2019 & 2032
- Table 12: Canada Insulin Pens Industry Volume (K Unit) Forecast, by Application 2019 & 2032
- Table 13: Mexico Insulin Pens Industry Revenue (Million) Forecast, by Application 2019 & 2032
- Table 14: Mexico Insulin Pens Industry Volume (K Unit) Forecast, by Application 2019 & 2032
- Table 15: Global Insulin Pens Industry Revenue Million Forecast, by Country 2019 & 2032
- Table 16: Global Insulin Pens Industry Volume K Unit Forecast, by Country 2019 & 2032
- Table 17: Germany Insulin Pens Industry Revenue (Million) Forecast, by Application 2019 & 2032
- Table 18: Germany Insulin Pens Industry Volume (K Unit) Forecast, by Application 2019 & 2032
- Table 19: United Kingdom Insulin Pens Industry Revenue (Million) Forecast, by Application 2019 & 2032
- Table 20: United Kingdom Insulin Pens Industry Volume (K Unit) Forecast, by Application 2019 & 2032
- Table 21: France Insulin Pens Industry Revenue (Million) Forecast, by Application 2019 & 2032
- Table 22: France Insulin Pens Industry Volume (K Unit) Forecast, by Application 2019 & 2032
- Table 23: Spain Insulin Pens Industry Revenue (Million) Forecast, by Application 2019 & 2032
- Table 24: Spain Insulin Pens Industry Volume (K Unit) Forecast, by Application 2019 & 2032
- Table 25: Italy Insulin Pens Industry Revenue (Million) Forecast, by Application 2019 & 2032
- Table 26: Italy Insulin Pens Industry Volume (K Unit) Forecast, by Application 2019 & 2032
- Table 27: Spain Insulin Pens Industry Revenue (Million) Forecast, by Application 2019 & 2032
- Table 28: Spain Insulin Pens Industry Volume (K Unit) Forecast, by Application 2019 & 2032
- Table 29: Belgium Insulin Pens Industry Revenue (Million) Forecast, by Application 2019 & 2032
- Table 30: Belgium Insulin Pens Industry Volume (K Unit) Forecast, by Application 2019 & 2032
- Table 31: Netherland Insulin Pens Industry Revenue (Million) Forecast, by Application 2019 & 2032
- Table 32: Netherland Insulin Pens Industry Volume (K Unit) Forecast, by Application 2019 & 2032
- Table 33: Nordics Insulin Pens Industry Revenue (Million) Forecast, by Application 2019 & 2032
- Table 34: Nordics Insulin Pens Industry Volume (K Unit) Forecast, by Application 2019 & 2032
- Table 35: Rest of Europe Insulin Pens Industry Revenue (Million) Forecast, by Application 2019 & 2032
- Table 36: Rest of Europe Insulin Pens Industry Volume (K Unit) Forecast, by Application 2019 & 2032
- Table 37: Global Insulin Pens Industry Revenue Million Forecast, by Country 2019 & 2032
- Table 38: Global Insulin Pens Industry Volume K Unit Forecast, by Country 2019 & 2032
- Table 39: China Insulin Pens Industry Revenue (Million) Forecast, by Application 2019 & 2032
- Table 40: China Insulin Pens Industry Volume (K Unit) Forecast, by Application 2019 & 2032
- Table 41: Japan Insulin Pens Industry Revenue (Million) Forecast, by Application 2019 & 2032
- Table 42: Japan Insulin Pens Industry Volume (K Unit) Forecast, by Application 2019 & 2032
- Table 43: India Insulin Pens Industry Revenue (Million) Forecast, by Application 2019 & 2032
- Table 44: India Insulin Pens Industry Volume (K Unit) Forecast, by Application 2019 & 2032
- Table 45: South Korea Insulin Pens Industry Revenue (Million) Forecast, by Application 2019 & 2032
- Table 46: South Korea Insulin Pens Industry Volume (K Unit) Forecast, by Application 2019 & 2032
- Table 47: Southeast Asia Insulin Pens Industry Revenue (Million) Forecast, by Application 2019 & 2032
- Table 48: Southeast Asia Insulin Pens Industry Volume (K Unit) Forecast, by Application 2019 & 2032
- Table 49: Australia Insulin Pens Industry Revenue (Million) Forecast, by Application 2019 & 2032
- Table 50: Australia Insulin Pens Industry Volume (K Unit) Forecast, by Application 2019 & 2032
- Table 51: Indonesia Insulin Pens Industry Revenue (Million) Forecast, by Application 2019 & 2032
- Table 52: Indonesia Insulin Pens Industry Volume (K Unit) Forecast, by Application 2019 & 2032
- Table 53: Phillipes Insulin Pens Industry Revenue (Million) Forecast, by Application 2019 & 2032
- Table 54: Phillipes Insulin Pens Industry Volume (K Unit) Forecast, by Application 2019 & 2032
- Table 55: Singapore Insulin Pens Industry Revenue (Million) Forecast, by Application 2019 & 2032
- Table 56: Singapore Insulin Pens Industry Volume (K Unit) Forecast, by Application 2019 & 2032
- Table 57: Thailandc Insulin Pens Industry Revenue (Million) Forecast, by Application 2019 & 2032
- Table 58: Thailandc Insulin Pens Industry Volume (K Unit) Forecast, by Application 2019 & 2032
- Table 59: Rest of Asia Pacific Insulin Pens Industry Revenue (Million) Forecast, by Application 2019 & 2032
- Table 60: Rest of Asia Pacific Insulin Pens Industry Volume (K Unit) Forecast, by Application 2019 & 2032
- Table 61: Global Insulin Pens Industry Revenue Million Forecast, by Country 2019 & 2032
- Table 62: Global Insulin Pens Industry Volume K Unit Forecast, by Country 2019 & 2032
- Table 63: Brazil Insulin Pens Industry Revenue (Million) Forecast, by Application 2019 & 2032
- Table 64: Brazil Insulin Pens Industry Volume (K Unit) Forecast, by Application 2019 & 2032
- Table 65: Argentina Insulin Pens Industry Revenue (Million) Forecast, by Application 2019 & 2032
- Table 66: Argentina Insulin Pens Industry Volume (K Unit) Forecast, by Application 2019 & 2032
- Table 67: Peru Insulin Pens Industry Revenue (Million) Forecast, by Application 2019 & 2032
- Table 68: Peru Insulin Pens Industry Volume (K Unit) Forecast, by Application 2019 & 2032
- Table 69: Chile Insulin Pens Industry Revenue (Million) Forecast, by Application 2019 & 2032
- Table 70: Chile Insulin Pens Industry Volume (K Unit) Forecast, by Application 2019 & 2032
- Table 71: Colombia Insulin Pens Industry Revenue (Million) Forecast, by Application 2019 & 2032
- Table 72: Colombia Insulin Pens Industry Volume (K Unit) Forecast, by Application 2019 & 2032
- Table 73: Ecuador Insulin Pens Industry Revenue (Million) Forecast, by Application 2019 & 2032
- Table 74: Ecuador Insulin Pens Industry Volume (K Unit) Forecast, by Application 2019 & 2032
- Table 75: Venezuela Insulin Pens Industry Revenue (Million) Forecast, by Application 2019 & 2032
- Table 76: Venezuela Insulin Pens Industry Volume (K Unit) Forecast, by Application 2019 & 2032
- Table 77: Rest of South America Insulin Pens Industry Revenue (Million) Forecast, by Application 2019 & 2032
- Table 78: Rest of South America Insulin Pens Industry Volume (K Unit) Forecast, by Application 2019 & 2032
- Table 79: Global Insulin Pens Industry Revenue Million Forecast, by Country 2019 & 2032
- Table 80: Global Insulin Pens Industry Volume K Unit Forecast, by Country 2019 & 2032
- Table 81: United States Insulin Pens Industry Revenue (Million) Forecast, by Application 2019 & 2032
- Table 82: United States Insulin Pens Industry Volume (K Unit) Forecast, by Application 2019 & 2032
- Table 83: Canada Insulin Pens Industry Revenue (Million) Forecast, by Application 2019 & 2032
- Table 84: Canada Insulin Pens Industry Volume (K Unit) Forecast, by Application 2019 & 2032
- Table 85: Mexico Insulin Pens Industry Revenue (Million) Forecast, by Application 2019 & 2032
- Table 86: Mexico Insulin Pens Industry Volume (K Unit) Forecast, by Application 2019 & 2032
- Table 87: Global Insulin Pens Industry Revenue Million Forecast, by Country 2019 & 2032
- Table 88: Global Insulin Pens Industry Volume K Unit Forecast, by Country 2019 & 2032
- Table 89: United Arab Emirates Insulin Pens Industry Revenue (Million) Forecast, by Application 2019 & 2032
- Table 90: United Arab Emirates Insulin Pens Industry Volume (K Unit) Forecast, by Application 2019 & 2032
- Table 91: Saudi Arabia Insulin Pens Industry Revenue (Million) Forecast, by Application 2019 & 2032
- Table 92: Saudi Arabia Insulin Pens Industry Volume (K Unit) Forecast, by Application 2019 & 2032
- Table 93: South Africa Insulin Pens Industry Revenue (Million) Forecast, by Application 2019 & 2032
- Table 94: South Africa Insulin Pens Industry Volume (K Unit) Forecast, by Application 2019 & 2032
- Table 95: Rest of Middle East and Africa Insulin Pens Industry Revenue (Million) Forecast, by Application 2019 & 2032
- Table 96: Rest of Middle East and Africa Insulin Pens Industry Volume (K Unit) Forecast, by Application 2019 & 2032
- Table 97: Global Insulin Pens Industry Revenue Million Forecast, by Product 2019 & 2032
- Table 98: Global Insulin Pens Industry Volume K Unit Forecast, by Product 2019 & 2032
- Table 99: Global Insulin Pens Industry Revenue Million Forecast, by Country 2019 & 2032
- Table 100: Global Insulin Pens Industry Volume K Unit Forecast, by Country 2019 & 2032
- Table 101: United States Insulin Pens Industry Revenue (Million) Forecast, by Application 2019 & 2032
- Table 102: United States Insulin Pens Industry Volume (K Unit) Forecast, by Application 2019 & 2032
- Table 103: Canada Insulin Pens Industry Revenue (Million) Forecast, by Application 2019 & 2032
- Table 104: Canada Insulin Pens Industry Volume (K Unit) Forecast, by Application 2019 & 2032
- Table 105: Rest of North America Insulin Pens Industry Revenue (Million) Forecast, by Application 2019 & 2032
- Table 106: Rest of North America Insulin Pens Industry Volume (K Unit) Forecast, by Application 2019 & 2032
- Table 107: Global Insulin Pens Industry Revenue Million Forecast, by Product 2019 & 2032
- Table 108: Global Insulin Pens Industry Volume K Unit Forecast, by Product 2019 & 2032
- Table 109: Global Insulin Pens Industry Revenue Million Forecast, by Country 2019 & 2032
- Table 110: Global Insulin Pens Industry Volume K Unit Forecast, by Country 2019 & 2032
- Table 111: Germany Insulin Pens Industry Revenue (Million) Forecast, by Application 2019 & 2032
- Table 112: Germany Insulin Pens Industry Volume (K Unit) Forecast, by Application 2019 & 2032
- Table 113: United Kingdom Insulin Pens Industry Revenue (Million) Forecast, by Application 2019 & 2032
- Table 114: United Kingdom Insulin Pens Industry Volume (K Unit) Forecast, by Application 2019 & 2032
- Table 115: France Insulin Pens Industry Revenue (Million) Forecast, by Application 2019 & 2032
- Table 116: France Insulin Pens Industry Volume (K Unit) Forecast, by Application 2019 & 2032
- Table 117: Russia Insulin Pens Industry Revenue (Million) Forecast, by Application 2019 & 2032
- Table 118: Russia Insulin Pens Industry Volume (K Unit) Forecast, by Application 2019 & 2032
- Table 119: Spain Insulin Pens Industry Revenue (Million) Forecast, by Application 2019 & 2032
- Table 120: Spain Insulin Pens Industry Volume (K Unit) Forecast, by Application 2019 & 2032
- Table 121: Italy Insulin Pens Industry Revenue (Million) Forecast, by Application 2019 & 2032
- Table 122: Italy Insulin Pens Industry Volume (K Unit) Forecast, by Application 2019 & 2032
- Table 123: Rest of Europe Insulin Pens Industry Revenue (Million) Forecast, by Application 2019 & 2032
- Table 124: Rest of Europe Insulin Pens Industry Volume (K Unit) Forecast, by Application 2019 & 2032
- Table 125: Global Insulin Pens Industry Revenue Million Forecast, by Product 2019 & 2032
- Table 126: Global Insulin Pens Industry Volume K Unit Forecast, by Product 2019 & 2032
- Table 127: Global Insulin Pens Industry Revenue Million Forecast, by Country 2019 & 2032
- Table 128: Global Insulin Pens Industry Volume K Unit Forecast, by Country 2019 & 2032
- Table 129: India Insulin Pens Industry Revenue (Million) Forecast, by Application 2019 & 2032
- Table 130: India Insulin Pens Industry Volume (K Unit) Forecast, by Application 2019 & 2032
- Table 131: China Insulin Pens Industry Revenue (Million) Forecast, by Application 2019 & 2032
- Table 132: China Insulin Pens Industry Volume (K Unit) Forecast, by Application 2019 & 2032
- Table 133: Japan Insulin Pens Industry Revenue (Million) Forecast, by Application 2019 & 2032
- Table 134: Japan Insulin Pens Industry Volume (K Unit) Forecast, by Application 2019 & 2032
- Table 135: South Korea Insulin Pens Industry Revenue (Million) Forecast, by Application 2019 & 2032
- Table 136: South Korea Insulin Pens Industry Volume (K Unit) Forecast, by Application 2019 & 2032
- Table 137: Australia Insulin Pens Industry Revenue (Million) Forecast, by Application 2019 & 2032
- Table 138: Australia Insulin Pens Industry Volume (K Unit) Forecast, by Application 2019 & 2032
- Table 139: Vietnam Insulin Pens Industry Revenue (Million) Forecast, by Application 2019 & 2032
- Table 140: Vietnam Insulin Pens Industry Volume (K Unit) Forecast, by Application 2019 & 2032
- Table 141: Malaysia Insulin Pens Industry Revenue (Million) Forecast, by Application 2019 & 2032
- Table 142: Malaysia Insulin Pens Industry Volume (K Unit) Forecast, by Application 2019 & 2032
- Table 143: Indonesia Insulin Pens Industry Revenue (Million) Forecast, by Application 2019 & 2032
- Table 144: Indonesia Insulin Pens Industry Volume (K Unit) Forecast, by Application 2019 & 2032
- Table 145: Philippines Insulin Pens Industry Revenue (Million) Forecast, by Application 2019 & 2032
- Table 146: Philippines Insulin Pens Industry Volume (K Unit) Forecast, by Application 2019 & 2032
- Table 147: Thailand Insulin Pens Industry Revenue (Million) Forecast, by Application 2019 & 2032
- Table 148: Thailand Insulin Pens Industry Volume (K Unit) Forecast, by Application 2019 & 2032
- Table 149: Rest of the Asia Pacific Insulin Pens Industry Revenue (Million) Forecast, by Application 2019 & 2032
- Table 150: Rest of the Asia Pacific Insulin Pens Industry Volume (K Unit) Forecast, by Application 2019 & 2032
- Table 151: Global Insulin Pens Industry Revenue Million Forecast, by Product 2019 & 2032
- Table 152: Global Insulin Pens Industry Volume K Unit Forecast, by Product 2019 & 2032
- Table 153: Global Insulin Pens Industry Revenue Million Forecast, by Country 2019 & 2032
- Table 154: Global Insulin Pens Industry Volume K Unit Forecast, by Country 2019 & 2032
- Table 155: Brazil Insulin Pens Industry Revenue (Million) Forecast, by Application 2019 & 2032
- Table 156: Brazil Insulin Pens Industry Volume (K Unit) Forecast, by Application 2019 & 2032
- Table 157: Mexico Insulin Pens Industry Revenue (Million) Forecast, by Application 2019 & 2032
- Table 158: Mexico Insulin Pens Industry Volume (K Unit) Forecast, by Application 2019 & 2032
- Table 159: Rest of Latin America Insulin Pens Industry Revenue (Million) Forecast, by Application 2019 & 2032
- Table 160: Rest of Latin America Insulin Pens Industry Volume (K Unit) Forecast, by Application 2019 & 2032
- Table 161: Global Insulin Pens Industry Revenue Million Forecast, by Product 2019 & 2032
- Table 162: Global Insulin Pens Industry Volume K Unit Forecast, by Product 2019 & 2032
- Table 163: Global Insulin Pens Industry Revenue Million Forecast, by Country 2019 & 2032
- Table 164: Global Insulin Pens Industry Volume K Unit Forecast, by Country 2019 & 2032
- Table 165: Egypt Insulin Pens Industry Revenue (Million) Forecast, by Application 2019 & 2032
- Table 166: Egypt Insulin Pens Industry Volume (K Unit) Forecast, by Application 2019 & 2032
- Table 167: Saudi Arabia Insulin Pens Industry Revenue (Million) Forecast, by Application 2019 & 2032
- Table 168: Saudi Arabia Insulin Pens Industry Volume (K Unit) Forecast, by Application 2019 & 2032
- Table 169: Iran Insulin Pens Industry Revenue (Million) Forecast, by Application 2019 & 2032
- Table 170: Iran Insulin Pens Industry Volume (K Unit) Forecast, by Application 2019 & 2032
- Table 171: South Africa Insulin Pens Industry Revenue (Million) Forecast, by Application 2019 & 2032
- Table 172: South Africa Insulin Pens Industry Volume (K Unit) Forecast, by Application 2019 & 2032
- Table 173: Oman Insulin Pens Industry Revenue (Million) Forecast, by Application 2019 & 2032
- Table 174: Oman Insulin Pens Industry Volume (K Unit) Forecast, by Application 2019 & 2032
- Table 175: Rest of the Middle East and Africa Insulin Pens Industry Revenue (Million) Forecast, by Application 2019 & 2032
- Table 176: Rest of the Middle East and Africa Insulin Pens Industry Volume (K Unit) Forecast, by Application 2019 & 2032
Frequently Asked Questions
1. What is the projected Compound Annual Growth Rate (CAGR) of the Insulin Pens Industry?
The projected CAGR is approximately 3.40%.
2. Which companies are prominent players in the Insulin Pens Industry?
Key companies in the market include Eli Lilly, Sanofi, Julphar, Biocon, Novo Nordisk.
3. What are the main segments of the Insulin Pens Industry?
The market segments include Product.
4. Can you provide details about the market size?
The market size is estimated to be USD 33.31 Million as of 2022.
5. What are some drivers contributing to market growth?
; The Rise in Global Prevalence of Cases of Obesity due to Modern Sedentary Lifestyles; Rise in Awareness and Disposable Income in Developed Economies.
6. What are the notable trends driving market growth?
The Market is Expected to Grow as the Number of Diabetes Patients Increase Year-On-Year.
7. Are there any restraints impacting market growth?
; Highly Cost of Branded Products in Emerging Countries; Severe Adverse Associated with Medication Including Seizures. Suicidal Attempts and Even Death; Adoption of Traditional Yoga and Herbal Products.
8. Can you provide examples of recent developments in the market?
Nov 2022: Lilly was expected to begin the rollout of the Tempo Personalized Diabetes Management Platform. The platform consists of three key components: the Tempo Smart Button, a compatible app, TempoSmart, and a prefilled insulin pen, Tempo Pen, which work together to deliver personalized guidance for adults with diabetes.
9. What pricing options are available for accessing the report?
Pricing options include single-user, multi-user, and enterprise licenses priced at USD 4750, USD 5250, and USD 8750 respectively.
10. Is the market size provided in terms of value or volume?
The market size is provided in terms of value, measured in Million and volume, measured in K Unit.
11. Are there any specific market keywords associated with the report?
Yes, the market keyword associated with the report is "Insulin Pens Industry," which aids in identifying and referencing the specific market segment covered.
12. How do I determine which pricing option suits my needs best?
The pricing options vary based on user requirements and access needs. Individual users may opt for single-user licenses, while businesses requiring broader access may choose multi-user or enterprise licenses for cost-effective access to the report.
13. Are there any additional resources or data provided in the Insulin Pens Industry report?
While the report offers comprehensive insights, it's advisable to review the specific contents or supplementary materials provided to ascertain if additional resources or data are available.
14. How can I stay updated on further developments or reports in the Insulin Pens Industry?
To stay informed about further developments, trends, and reports in the Insulin Pens Industry, consider subscribing to industry newsletters, following relevant companies and organizations, or regularly checking reputable industry news sources and publications.
Methodology
Step 1 - Identification of Relevant Samples Size from Population Database


Step 2 - Approaches for Defining Global Market Size (Value, Volume* & Price*)

Note*: In applicable scenarios
Step 3 - Data Sources
Primary Research
- Web Analytics
- Survey Reports
- Research Institute
- Latest Research Reports
- Opinion Leaders
Secondary Research
- Annual Reports
- White Paper
- Latest Press Release
- Industry Association
- Paid Database
- Investor Presentations

Step 4 - Data Triangulation
Involves using different sources of information in order to increase the validity of a study
These sources are likely to be stakeholders in a program - participants, other researchers, program staff, other community members, and so on.
Then we put all data in single framework & apply various statistical tools to find out the dynamic on the market.
During the analysis stage, feedback from the stakeholder groups would be compared to determine areas of agreement as well as areas of divergence


