

Key Insights
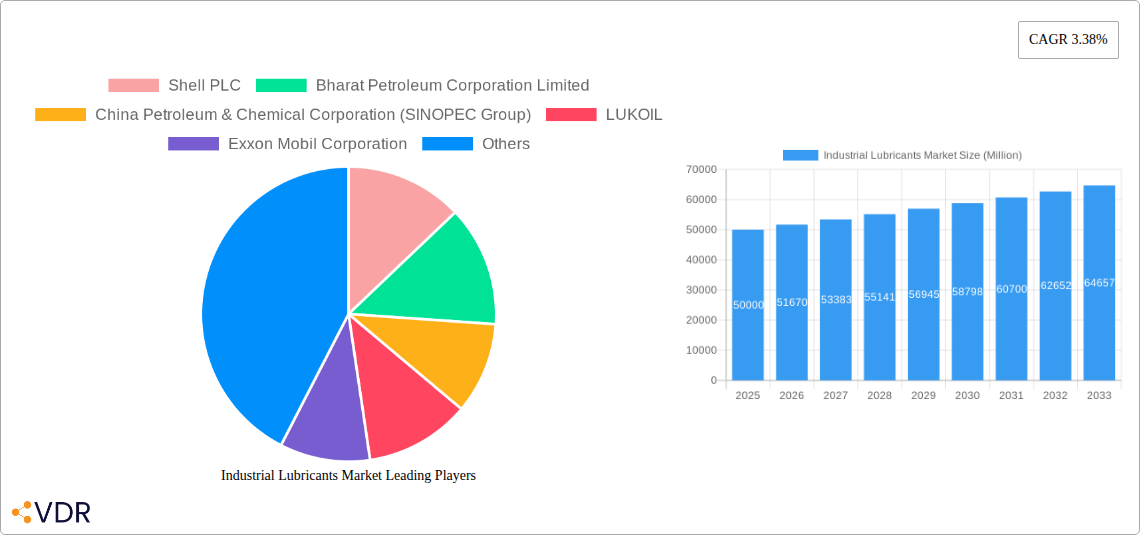
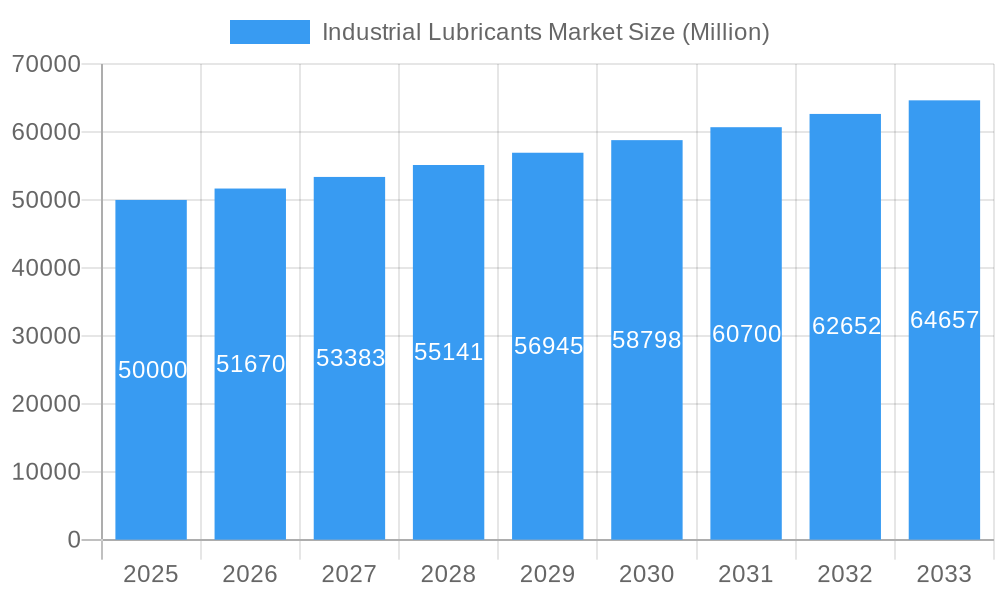
The global industrial lubricants market, valued at approximately $XX million in 2025, is projected to experience steady growth with a compound annual growth rate (CAGR) of 3.38% from 2025 to 2033. This growth is driven by several key factors. The increasing industrialization across developing economies, particularly in Asia-Pacific, fuels the demand for lubricants in diverse sectors like power generation, heavy equipment manufacturing, and chemical processing. Furthermore, the growing adoption of advanced lubricant technologies, such as synthetic oils and bio-based lubricants, aimed at improving efficiency and reducing environmental impact, significantly contributes to market expansion. Stringent emission regulations globally also incentivize the adoption of high-performance, eco-friendly lubricants, further stimulating market growth. The automotive industry, particularly heavy-duty vehicles, is a major consumer and its expansion contributes significantly to the market. However, fluctuating crude oil prices and economic downturns can pose challenges to consistent growth.
Industrial Lubricants Market Market Size (In Billion)
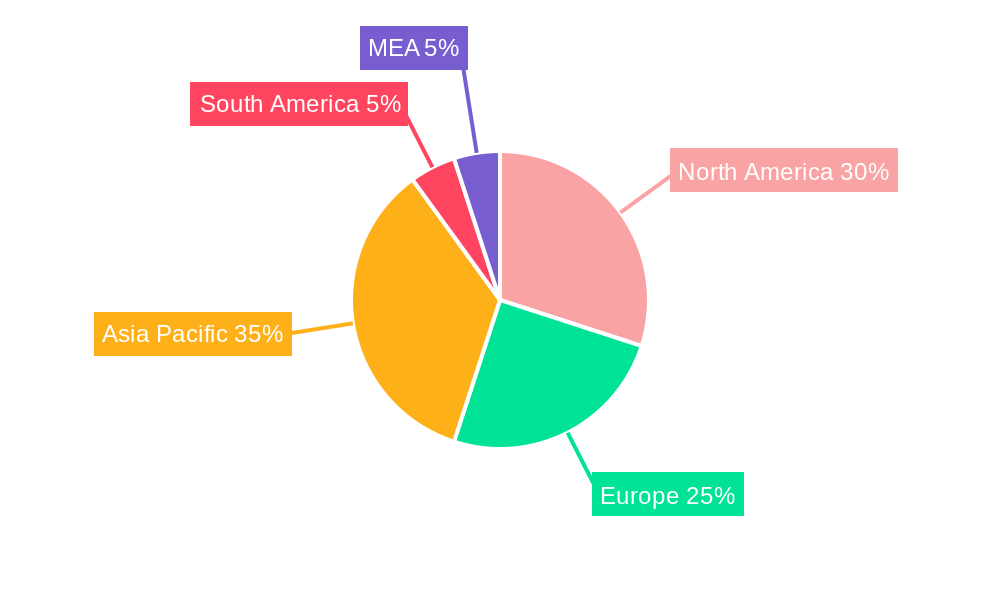
Market segmentation reveals engine oil, transmission and hydraulic fluids, and metalworking fluids as dominant product types. The power generation, heavy equipment, and food and beverage industries are major end-users. While North America and Europe currently hold significant market share, the Asia-Pacific region is poised for rapid expansion due to its burgeoning industrial sector and rising infrastructure investments. Competitive dynamics are intense, with major players such as Shell, ExxonMobil, and BP competing alongside regional and specialized lubricant manufacturers. The market's future will likely be shaped by technological advancements, sustainability initiatives, and evolving regulatory landscapes, particularly in areas concerning environmental protection and worker safety. Successful players will need to focus on innovation, supply chain optimization, and strategic partnerships to maintain a competitive edge in this dynamic market.
Industrial Lubricants Market Company Market Share
Industrial Lubricants Market: A Comprehensive Report (2019-2033)
This comprehensive report provides an in-depth analysis of the global Industrial Lubricants Market, covering the period 2019-2033. It delves into market dynamics, growth trends, regional dominance, product landscapes, key players, and future outlook, offering invaluable insights for industry professionals, investors, and strategic decision-makers. The report utilizes a robust methodology, incorporating both qualitative and quantitative data, to provide a complete understanding of this crucial sector. The market size is estimated at xx Million in 2025 and is projected to reach xx Million by 2033.
Industrial Lubricants Market Dynamics & Structure
The Industrial Lubricants Market is characterized by a moderately concentrated landscape, with key players like Shell PLC, Exxon Mobil Corporation, and SINOPEC Group holding significant market share. However, smaller specialized players and regional manufacturers also contribute significantly. Technological innovation, particularly in the development of biodegradable and high-performance lubricants, is a major driver. Stringent environmental regulations, particularly concerning hazardous waste disposal, are shaping industry practices and fostering the adoption of eco-friendly solutions. The market also faces competition from alternative technologies and materials. Mergers and acquisitions (M&As) are common, reflecting the industry's pursuit of expansion and technological capabilities.
- Market Concentration: Moderately concentrated, with top 5 players holding approximately xx% market share (2024).
- Technological Innovation: Focus on biodegradable, energy-efficient, and high-performance lubricants.
- Regulatory Framework: Stringent environmental regulations driving the adoption of eco-friendly solutions.
- Competitive Substitutes: Alternative technologies and materials posing competitive pressure.
- M&A Trends: Significant M&A activity to enhance market share and technological capabilities. Estimated xx M&A deals in the past 5 years.
- End-User Demographics: Growth driven by increasing industrialization and infrastructure development across emerging economies.
Industrial Lubricants Market Growth Trends & Insights
The Industrial Lubricants Market has witnessed consistent growth over the historical period (2019-2024), driven by rising industrialization, expanding manufacturing sectors, and increasing demand across various end-user industries. The market experienced a CAGR of xx% during 2019-2024 and is projected to maintain a CAGR of xx% during the forecast period (2025-2033). This growth is being fuelled by technological advancements, adoption of advanced lubricants for improved efficiency, and stringent environmental regulations pushing demand for eco-friendly products. Specific market segments like heavy equipment and power generation display higher growth potential compared to others, driven by robust infrastructure development and rising energy demands. Market penetration varies significantly across regions, with developed markets exhibiting higher penetration rates compared to developing markets.
Dominant Regions, Countries, or Segments in Industrial Lubricants Market
The Asia-Pacific region currently dominates the Industrial Lubricants Market, driven by rapid industrialization, particularly in countries like China and India. North America and Europe also represent significant market segments, although growth rates are comparatively lower. Within the product type segment, Engine Oil and Grease dominate, owing to their extensive application across various industrial sectors. Within the end-user segment, Heavy Equipment and Power Generation show strong growth prospects due to sustained investments in infrastructure development and increasing energy production.
- Leading Region: Asia-Pacific (holding approximately xx% market share in 2024)
- Key Country Drivers: China, India, USA, Germany.
- Dominant Product Type: Engine Oil and Grease (combined market share of approximately xx% in 2024)
- High-Growth End-User Industries: Heavy Equipment and Power Generation
Asia-Pacific Dominance Factors: Rapid industrialization, increasing infrastructure spending, and a large manufacturing base.
North America and Europe: Mature markets with stable growth, driven by technological advancements and regulatory compliance.
Industrial Lubricants Market Product Landscape
The industrial lubricants market offers a diverse product portfolio, including engine oils, gear oils, greases, hydraulic fluids, and metalworking fluids. Recent innovations focus on enhanced performance characteristics such as improved wear resistance, extended service life, and reduced environmental impact. Bio-based and synthetic lubricants are gaining traction, driven by environmental concerns and the need for improved operational efficiency. Key selling propositions include enhanced energy efficiency, reduced maintenance costs, and improved equipment lifespan.
Key Drivers, Barriers & Challenges in Industrial Lubricants Market
Key Drivers:
- Rising industrialization and infrastructure development globally.
- Growing demand for energy-efficient and high-performance lubricants.
- Stringent environmental regulations promoting the adoption of eco-friendly products.
- Technological advancements resulting in superior lubricant formulations.
Challenges & Restraints:
- Fluctuations in crude oil prices impacting production costs.
- Intense competition among numerous players, both large and small.
- Supply chain disruptions affecting raw material availability and distribution.
- Regulatory hurdles and compliance costs associated with environmental standards. Estimated xx% increase in compliance costs over the past 5 years.
Emerging Opportunities in Industrial Lubricants Market
- Growing demand for specialized lubricants for niche applications (e.g., renewable energy, aerospace).
- Expansion into untapped markets in developing economies.
- Development of sustainable and biodegradable lubricants to meet environmental standards.
- Leveraging digital technologies for predictive maintenance and optimized lubricant usage.
Growth Accelerators in the Industrial Lubricants Market Industry
Technological advancements, especially in materials science and nanotechnology, are fueling the development of superior lubricant formulations. Strategic partnerships and collaborations between lubricant manufacturers and equipment producers are enhancing product development and market reach. Expansion into new geographic markets, particularly in developing economies, presents significant growth opportunities. The adoption of circular economy principles and the development of lubricant recycling technologies are also driving long-term growth.
Key Players Shaping the Industrial Lubricants Market Market
- Shell PLC
- Bharat Petroleum Corporation Limited
- China Petroleum & Chemical Corporation (SINOPEC Group)
- LUKOIL
- Exxon Mobil Corporation
- Petronas Lubricants International
- AMSOIL INC
- Hindustan Petroleum Corporation Limited
- Kluber Lubrication
- China National Petroleum Corporation (PetroChina)
- ENEOS Corporation
- FUCHS
- Petrobras
- Tide Water Oil Co (India) Ltd
- Repsol
- Gazprom Neft PJSC
- PT Pertamina(Persero)
- Chevron Corporation
- TotalEnergies
- Idemitsu Kosan Co Ltd
- Carl Bechem GmbH
- Blaser Swisslube AG
- Phillips 66 Company
- ROCOL
- Eni SpA
- Valvoline
- Indian Oil Corporation Ltd
- BP p l c
- Gulf Oil International
- List Not Exhaustive
Notable Milestones in Industrial Lubricants Market Sector
- Jan 2024: Shell Lubricants acquires MIDEL and MIVOLT, expanding its global lubricants portfolio.
- Oct 2023: HPCL and Chevron enter a long-term agreement for the production and distribution of Chevron lubricant products in India.
- May 2023: AMSOIL INC. acquires Benz Oil, strengthening its industrial fluids capabilities.
- Mar 2023: Exxon Mobil Corporation announces a USD 110 million investment in a new lubricant manufacturing plant in India.
In-Depth Industrial Lubricants Market Market Outlook
The Industrial Lubricants Market is poised for continued growth, driven by the factors outlined above. Strategic investments in research and development, coupled with a focus on sustainable and high-performance products, will shape the market landscape in the coming years. Companies that effectively adapt to changing environmental regulations and technological advancements will be best positioned for success. The market presents significant opportunities for both established players and new entrants, particularly in emerging economies and niche applications.
Industrial Lubricants Market Segmentation
-
1. Product Type
- 1.1. Engine Oil
- 1.2. Transmission and Hydraulic Fluid
- 1.3. Metalworking Fluid
- 1.4. General Industrial Oil
- 1.5. Gear Oil
- 1.6. Grease
- 1.7. Process Oil
- 1.8. Other Product Types
-
2. End-user Industry
- 2.1. Power Generation
- 2.2. Heavy Equipment
- 2.3. Food and Beverage
- 2.4. Metallurgy and Metalworking
- 2.5. Chemical Manufacturing
- 2.6. Other End-user Industries
Industrial Lubricants Market Segmentation By Geography
-
1. Asia Pacific
- 1.1. China
- 1.2. India
- 1.3. Japan
- 1.4. South Korea
- 1.5. Phillipines
- 1.6. Indonesia
- 1.7. Malaysia
- 1.8. Thailand
- 1.9. Vietnam
- 1.10. Rest of Asia Pacific
-
2. North America
- 2.1. United States
- 2.2. Canada
- 2.3. Mexico
- 2.4. Rest of North America
-
3. Europe
- 3.1. Germany
- 3.2. United Kingdom
- 3.3. Italy
- 3.4. France
- 3.5. Russia
- 3.6. Turkey
- 3.7. Spain
- 3.8. Rest of Europe
-
4. South America
- 4.1. Brazil
- 4.2. Argentina
- 4.3. Colombia
- 4.4. Chile
- 4.5. Rest of South America
-
5. Middle East
- 5.1. Saudi Arabia
- 5.2. Iran
- 5.3. Iraq
- 5.4. United Arab Emirates
- 5.5. Kuwait
- 5.6. Rest of Middle East
-
6. Africa
- 6.1. Egypt
- 6.2. South Africa
- 6.3. Nigeria
- 6.4. Algeria
- 6.5. Morocco
- 6.6. Rest of Africa
Industrial Lubricants Market Regional Market Share
Geographic Coverage of Industrial Lubricants Market
Industrial Lubricants Market REPORT HIGHLIGHTS
| Aspects | Details |
|---|---|
| Study Period | 2020-2034 |
| Base Year | 2025 |
| Estimated Year | 2026 |
| Forecast Period | 2026-2034 |
| Historical Period | 2020-2025 |
| Growth Rate | CAGR of 3.3% from 2020-2034 |
| Segmentation |
|
Table of Contents
- 1. Introduction
- 1.1. Research Scope
- 1.2. Market Segmentation
- 1.3. Research Objective
- 1.4. Definitions and Assumptions
- 2. Executive Summary
- 2.1. Market Snapshot
- 3. Market Dynamics
- 3.1. Market Drivers
- 3.2. Market Restrains
- 3.3. Market Trends
- 3.4. Market Opportunities
- 4. Market Factor Analysis
- 4.1. Porters Five Forces
- 4.1.1. Bargaining Power of Suppliers
- 4.1.2. Bargaining Power of Buyers
- 4.1.3. Threat of New Entrants
- 4.1.4. Threat of Substitutes
- 4.1.5. Competitive Rivalry
- 4.2. PESTEL analysis
- 4.3. BCG Analysis
- 4.3.1. Stars (High Growth, High Market Share)
- 4.3.2. Cash Cows (Low Growth, High Market Share)
- 4.3.3. Question Mark (High Growth, Low Market Share)
- 4.3.4. Dogs (Low Growth, Low Market Share)
- 4.4. Ansoff Matrix Analysis
- 4.5. Supply Chain Analysis
- 4.6. Regulatory Landscape
- 4.7. Current Market Potential and Opportunity Assessment (TAM–SAM–SOM Framework)
- 4.8. VDR Analyst Note
- 4.1. Porters Five Forces
- 5. Market Analysis, Insights and Forecast 2021-2033
- 5.1. Market Analysis, Insights and Forecast - by Product Type
- 5.1.1. Engine Oil
- 5.1.2. Transmission and Hydraulic Fluid
- 5.1.3. Metalworking Fluid
- 5.1.4. General Industrial Oil
- 5.1.5. Gear Oil
- 5.1.6. Grease
- 5.1.7. Process Oil
- 5.1.8. Other Product Types
- 5.2. Market Analysis, Insights and Forecast - by End-user Industry
- 5.2.1. Power Generation
- 5.2.2. Heavy Equipment
- 5.2.3. Food and Beverage
- 5.2.4. Metallurgy and Metalworking
- 5.2.5. Chemical Manufacturing
- 5.2.6. Other End-user Industries
- 5.3. Market Analysis, Insights and Forecast - by Region
- 5.3.1. Asia Pacific
- 5.3.2. North America
- 5.3.3. Europe
- 5.3.4. South America
- 5.3.5. Middle East
- 5.3.6. Africa
- 5.1. Market Analysis, Insights and Forecast - by Product Type
- 6. Global Industrial Lubricants Market Analysis, Insights and Forecast, 2021-2033
- 6.1. Market Analysis, Insights and Forecast - by Product Type
- 6.1.1. Engine Oil
- 6.1.2. Transmission and Hydraulic Fluid
- 6.1.3. Metalworking Fluid
- 6.1.4. General Industrial Oil
- 6.1.5. Gear Oil
- 6.1.6. Grease
- 6.1.7. Process Oil
- 6.1.8. Other Product Types
- 6.2. Market Analysis, Insights and Forecast - by End-user Industry
- 6.2.1. Power Generation
- 6.2.2. Heavy Equipment
- 6.2.3. Food and Beverage
- 6.2.4. Metallurgy and Metalworking
- 6.2.5. Chemical Manufacturing
- 6.2.6. Other End-user Industries
- 6.1. Market Analysis, Insights and Forecast - by Product Type
- 7. Asia Pacific Industrial Lubricants Market Analysis, Insights and Forecast, 2021-2033
- 7.1. Market Analysis, Insights and Forecast - by Product Type
- 7.1.1. Engine Oil
- 7.1.2. Transmission and Hydraulic Fluid
- 7.1.3. Metalworking Fluid
- 7.1.4. General Industrial Oil
- 7.1.5. Gear Oil
- 7.1.6. Grease
- 7.1.7. Process Oil
- 7.1.8. Other Product Types
- 7.2. Market Analysis, Insights and Forecast - by End-user Industry
- 7.2.1. Power Generation
- 7.2.2. Heavy Equipment
- 7.2.3. Food and Beverage
- 7.2.4. Metallurgy and Metalworking
- 7.2.5. Chemical Manufacturing
- 7.2.6. Other End-user Industries
- 7.1. Market Analysis, Insights and Forecast - by Product Type
- 8. North America Industrial Lubricants Market Analysis, Insights and Forecast, 2021-2033
- 8.1. Market Analysis, Insights and Forecast - by Product Type
- 8.1.1. Engine Oil
- 8.1.2. Transmission and Hydraulic Fluid
- 8.1.3. Metalworking Fluid
- 8.1.4. General Industrial Oil
- 8.1.5. Gear Oil
- 8.1.6. Grease
- 8.1.7. Process Oil
- 8.1.8. Other Product Types
- 8.2. Market Analysis, Insights and Forecast - by End-user Industry
- 8.2.1. Power Generation
- 8.2.2. Heavy Equipment
- 8.2.3. Food and Beverage
- 8.2.4. Metallurgy and Metalworking
- 8.2.5. Chemical Manufacturing
- 8.2.6. Other End-user Industries
- 8.1. Market Analysis, Insights and Forecast - by Product Type
- 9. Europe Industrial Lubricants Market Analysis, Insights and Forecast, 2021-2033
- 9.1. Market Analysis, Insights and Forecast - by Product Type
- 9.1.1. Engine Oil
- 9.1.2. Transmission and Hydraulic Fluid
- 9.1.3. Metalworking Fluid
- 9.1.4. General Industrial Oil
- 9.1.5. Gear Oil
- 9.1.6. Grease
- 9.1.7. Process Oil
- 9.1.8. Other Product Types
- 9.2. Market Analysis, Insights and Forecast - by End-user Industry
- 9.2.1. Power Generation
- 9.2.2. Heavy Equipment
- 9.2.3. Food and Beverage
- 9.2.4. Metallurgy and Metalworking
- 9.2.5. Chemical Manufacturing
- 9.2.6. Other End-user Industries
- 9.1. Market Analysis, Insights and Forecast - by Product Type
- 10. South America Industrial Lubricants Market Analysis, Insights and Forecast, 2021-2033
- 10.1. Market Analysis, Insights and Forecast - by Product Type
- 10.1.1. Engine Oil
- 10.1.2. Transmission and Hydraulic Fluid
- 10.1.3. Metalworking Fluid
- 10.1.4. General Industrial Oil
- 10.1.5. Gear Oil
- 10.1.6. Grease
- 10.1.7. Process Oil
- 10.1.8. Other Product Types
- 10.2. Market Analysis, Insights and Forecast - by End-user Industry
- 10.2.1. Power Generation
- 10.2.2. Heavy Equipment
- 10.2.3. Food and Beverage
- 10.2.4. Metallurgy and Metalworking
- 10.2.5. Chemical Manufacturing
- 10.2.6. Other End-user Industries
- 10.1. Market Analysis, Insights and Forecast - by Product Type
- 11. Middle East Industrial Lubricants Market Analysis, Insights and Forecast, 2021-2033
- 11.1. Market Analysis, Insights and Forecast - by Product Type
- 11.1.1. Engine Oil
- 11.1.2. Transmission and Hydraulic Fluid
- 11.1.3. Metalworking Fluid
- 11.1.4. General Industrial Oil
- 11.1.5. Gear Oil
- 11.1.6. Grease
- 11.1.7. Process Oil
- 11.1.8. Other Product Types
- 11.2. Market Analysis, Insights and Forecast - by End-user Industry
- 11.2.1. Power Generation
- 11.2.2. Heavy Equipment
- 11.2.3. Food and Beverage
- 11.2.4. Metallurgy and Metalworking
- 11.2.5. Chemical Manufacturing
- 11.2.6. Other End-user Industries
- 11.1. Market Analysis, Insights and Forecast - by Product Type
- 12. Africa Industrial Lubricants Market Analysis, Insights and Forecast, 2021-2033
- 12.1. Market Analysis, Insights and Forecast - by Product Type
- 12.1.1. Engine Oil
- 12.1.2. Transmission and Hydraulic Fluid
- 12.1.3. Metalworking Fluid
- 12.1.4. General Industrial Oil
- 12.1.5. Gear Oil
- 12.1.6. Grease
- 12.1.7. Process Oil
- 12.1.8. Other Product Types
- 12.2. Market Analysis, Insights and Forecast - by End-user Industry
- 12.2.1. Power Generation
- 12.2.2. Heavy Equipment
- 12.2.3. Food and Beverage
- 12.2.4. Metallurgy and Metalworking
- 12.2.5. Chemical Manufacturing
- 12.2.6. Other End-user Industries
- 12.1. Market Analysis, Insights and Forecast - by Product Type
- 13. Competitive Analysis
- 13.1. Company Profiles
- 13.1.1 Shell PLC
- 13.1.1.1. Company Overview
- 13.1.1.2. Products
- 13.1.1.3. Company Financials
- 13.1.1.4. SWOT Analysis
- 13.1.2 Bharat Petroleum Corporation Limited
- 13.1.2.1. Company Overview
- 13.1.2.2. Products
- 13.1.2.3. Company Financials
- 13.1.2.4. SWOT Analysis
- 13.1.3 China Petroleum & Chemical Corporation (SINOPEC Group)
- 13.1.3.1. Company Overview
- 13.1.3.2. Products
- 13.1.3.3. Company Financials
- 13.1.3.4. SWOT Analysis
- 13.1.4 LUKOIL
- 13.1.4.1. Company Overview
- 13.1.4.2. Products
- 13.1.4.3. Company Financials
- 13.1.4.4. SWOT Analysis
- 13.1.5 Exxon Mobil Corporation
- 13.1.5.1. Company Overview
- 13.1.5.2. Products
- 13.1.5.3. Company Financials
- 13.1.5.4. SWOT Analysis
- 13.1.6 Petronas Lubricants International
- 13.1.6.1. Company Overview
- 13.1.6.2. Products
- 13.1.6.3. Company Financials
- 13.1.6.4. SWOT Analysis
- 13.1.7 AMSOIL INC
- 13.1.7.1. Company Overview
- 13.1.7.2. Products
- 13.1.7.3. Company Financials
- 13.1.7.4. SWOT Analysis
- 13.1.8 Hindustan Petroleum Corporation Limited
- 13.1.8.1. Company Overview
- 13.1.8.2. Products
- 13.1.8.3. Company Financials
- 13.1.8.4. SWOT Analysis
- 13.1.9 Kluber Lubrication
- 13.1.9.1. Company Overview
- 13.1.9.2. Products
- 13.1.9.3. Company Financials
- 13.1.9.4. SWOT Analysis
- 13.1.10 China National Petroleum Corporation (PetroChina)
- 13.1.10.1. Company Overview
- 13.1.10.2. Products
- 13.1.10.3. Company Financials
- 13.1.10.4. SWOT Analysis
- 13.1.11 ENEOS Corporation
- 13.1.11.1. Company Overview
- 13.1.11.2. Products
- 13.1.11.3. Company Financials
- 13.1.11.4. SWOT Analysis
- 13.1.12 FUCHS
- 13.1.12.1. Company Overview
- 13.1.12.2. Products
- 13.1.12.3. Company Financials
- 13.1.12.4. SWOT Analysis
- 13.1.13 Petrobras
- 13.1.13.1. Company Overview
- 13.1.13.2. Products
- 13.1.13.3. Company Financials
- 13.1.13.4. SWOT Analysis
- 13.1.14 Tide Water Oil Co (India) Ltd
- 13.1.14.1. Company Overview
- 13.1.14.2. Products
- 13.1.14.3. Company Financials
- 13.1.14.4. SWOT Analysis
- 13.1.15 Repsol
- 13.1.15.1. Company Overview
- 13.1.15.2. Products
- 13.1.15.3. Company Financials
- 13.1.15.4. SWOT Analysis
- 13.1.16 Gazprom Neft PJSC
- 13.1.16.1. Company Overview
- 13.1.16.2. Products
- 13.1.16.3. Company Financials
- 13.1.16.4. SWOT Analysis
- 13.1.17 PT Pertamina(Persero)
- 13.1.17.1. Company Overview
- 13.1.17.2. Products
- 13.1.17.3. Company Financials
- 13.1.17.4. SWOT Analysis
- 13.1.18 Chevron Corporation
- 13.1.18.1. Company Overview
- 13.1.18.2. Products
- 13.1.18.3. Company Financials
- 13.1.18.4. SWOT Analysis
- 13.1.19 TotalEnergies
- 13.1.19.1. Company Overview
- 13.1.19.2. Products
- 13.1.19.3. Company Financials
- 13.1.19.4. SWOT Analysis
- 13.1.20 Idemitsu Kosan Co Ltd
- 13.1.20.1. Company Overview
- 13.1.20.2. Products
- 13.1.20.3. Company Financials
- 13.1.20.4. SWOT Analysis
- 13.1.21 Carl Bechem GmbH
- 13.1.21.1. Company Overview
- 13.1.21.2. Products
- 13.1.21.3. Company Financials
- 13.1.21.4. SWOT Analysis
- 13.1.22 Blaser Swisslube AG
- 13.1.22.1. Company Overview
- 13.1.22.2. Products
- 13.1.22.3. Company Financials
- 13.1.22.4. SWOT Analysis
- 13.1.23 Phillips 66 Company
- 13.1.23.1. Company Overview
- 13.1.23.2. Products
- 13.1.23.3. Company Financials
- 13.1.23.4. SWOT Analysis
- 13.1.24 ROCOL
- 13.1.24.1. Company Overview
- 13.1.24.2. Products
- 13.1.24.3. Company Financials
- 13.1.24.4. SWOT Analysis
- 13.1.25 Eni SpA
- 13.1.25.1. Company Overview
- 13.1.25.2. Products
- 13.1.25.3. Company Financials
- 13.1.25.4. SWOT Analysis
- 13.1.26 Valvoline*List Not Exhaustive
- 13.1.26.1. Company Overview
- 13.1.26.2. Products
- 13.1.26.3. Company Financials
- 13.1.26.4. SWOT Analysis
- 13.1.27 Indian Oil Corporation Ltd
- 13.1.27.1. Company Overview
- 13.1.27.2. Products
- 13.1.27.3. Company Financials
- 13.1.27.4. SWOT Analysis
- 13.1.28 BP p l c
- 13.1.28.1. Company Overview
- 13.1.28.2. Products
- 13.1.28.3. Company Financials
- 13.1.28.4. SWOT Analysis
- 13.1.29 Gulf Oil International
- 13.1.29.1. Company Overview
- 13.1.29.2. Products
- 13.1.29.3. Company Financials
- 13.1.29.4. SWOT Analysis
- 13.1.1 Shell PLC
- 13.2. Market Entropy
- 13.2.1 Company's Key Areas Served
- 13.2.2 Recent Developments
- 13.3. Company Market Share Analysis 2025
- 13.3.1 Top 5 Companies Market Share Analysis
- 13.3.2 Top 3 Companies Market Share Analysis
- 13.4. List of Potential Customers
- 14. Research Methodology
List of Figures
- Figure 1: Global Industrial Lubricants Market Revenue Breakdown (billion, %) by Region 2025 & 2033
- Figure 2: Global Industrial Lubricants Market Volume Breakdown (Billion, %) by Region 2025 & 2033
- Figure 3: Asia Pacific Industrial Lubricants Market Revenue (billion), by Product Type 2025 & 2033
- Figure 4: Asia Pacific Industrial Lubricants Market Volume (Billion), by Product Type 2025 & 2033
- Figure 5: Asia Pacific Industrial Lubricants Market Revenue Share (%), by Product Type 2025 & 2033
- Figure 6: Asia Pacific Industrial Lubricants Market Volume Share (%), by Product Type 2025 & 2033
- Figure 7: Asia Pacific Industrial Lubricants Market Revenue (billion), by End-user Industry 2025 & 2033
- Figure 8: Asia Pacific Industrial Lubricants Market Volume (Billion), by End-user Industry 2025 & 2033
- Figure 9: Asia Pacific Industrial Lubricants Market Revenue Share (%), by End-user Industry 2025 & 2033
- Figure 10: Asia Pacific Industrial Lubricants Market Volume Share (%), by End-user Industry 2025 & 2033
- Figure 11: Asia Pacific Industrial Lubricants Market Revenue (billion), by Country 2025 & 2033
- Figure 12: Asia Pacific Industrial Lubricants Market Volume (Billion), by Country 2025 & 2033
- Figure 13: Asia Pacific Industrial Lubricants Market Revenue Share (%), by Country 2025 & 2033
- Figure 14: Asia Pacific Industrial Lubricants Market Volume Share (%), by Country 2025 & 2033
- Figure 15: North America Industrial Lubricants Market Revenue (billion), by Product Type 2025 & 2033
- Figure 16: North America Industrial Lubricants Market Volume (Billion), by Product Type 2025 & 2033
- Figure 17: North America Industrial Lubricants Market Revenue Share (%), by Product Type 2025 & 2033
- Figure 18: North America Industrial Lubricants Market Volume Share (%), by Product Type 2025 & 2033
- Figure 19: North America Industrial Lubricants Market Revenue (billion), by End-user Industry 2025 & 2033
- Figure 20: North America Industrial Lubricants Market Volume (Billion), by End-user Industry 2025 & 2033
- Figure 21: North America Industrial Lubricants Market Revenue Share (%), by End-user Industry 2025 & 2033
- Figure 22: North America Industrial Lubricants Market Volume Share (%), by End-user Industry 2025 & 2033
- Figure 23: North America Industrial Lubricants Market Revenue (billion), by Country 2025 & 2033
- Figure 24: North America Industrial Lubricants Market Volume (Billion), by Country 2025 & 2033
- Figure 25: North America Industrial Lubricants Market Revenue Share (%), by Country 2025 & 2033
- Figure 26: North America Industrial Lubricants Market Volume Share (%), by Country 2025 & 2033
- Figure 27: Europe Industrial Lubricants Market Revenue (billion), by Product Type 2025 & 2033
- Figure 28: Europe Industrial Lubricants Market Volume (Billion), by Product Type 2025 & 2033
- Figure 29: Europe Industrial Lubricants Market Revenue Share (%), by Product Type 2025 & 2033
- Figure 30: Europe Industrial Lubricants Market Volume Share (%), by Product Type 2025 & 2033
- Figure 31: Europe Industrial Lubricants Market Revenue (billion), by End-user Industry 2025 & 2033
- Figure 32: Europe Industrial Lubricants Market Volume (Billion), by End-user Industry 2025 & 2033
- Figure 33: Europe Industrial Lubricants Market Revenue Share (%), by End-user Industry 2025 & 2033
- Figure 34: Europe Industrial Lubricants Market Volume Share (%), by End-user Industry 2025 & 2033
- Figure 35: Europe Industrial Lubricants Market Revenue (billion), by Country 2025 & 2033
- Figure 36: Europe Industrial Lubricants Market Volume (Billion), by Country 2025 & 2033
- Figure 37: Europe Industrial Lubricants Market Revenue Share (%), by Country 2025 & 2033
- Figure 38: Europe Industrial Lubricants Market Volume Share (%), by Country 2025 & 2033
- Figure 39: South America Industrial Lubricants Market Revenue (billion), by Product Type 2025 & 2033
- Figure 40: South America Industrial Lubricants Market Volume (Billion), by Product Type 2025 & 2033
- Figure 41: South America Industrial Lubricants Market Revenue Share (%), by Product Type 2025 & 2033
- Figure 42: South America Industrial Lubricants Market Volume Share (%), by Product Type 2025 & 2033
- Figure 43: South America Industrial Lubricants Market Revenue (billion), by End-user Industry 2025 & 2033
- Figure 44: South America Industrial Lubricants Market Volume (Billion), by End-user Industry 2025 & 2033
- Figure 45: South America Industrial Lubricants Market Revenue Share (%), by End-user Industry 2025 & 2033
- Figure 46: South America Industrial Lubricants Market Volume Share (%), by End-user Industry 2025 & 2033
- Figure 47: South America Industrial Lubricants Market Revenue (billion), by Country 2025 & 2033
- Figure 48: South America Industrial Lubricants Market Volume (Billion), by Country 2025 & 2033
- Figure 49: South America Industrial Lubricants Market Revenue Share (%), by Country 2025 & 2033
- Figure 50: South America Industrial Lubricants Market Volume Share (%), by Country 2025 & 2033
- Figure 51: Middle East Industrial Lubricants Market Revenue (billion), by Product Type 2025 & 2033
- Figure 52: Middle East Industrial Lubricants Market Volume (Billion), by Product Type 2025 & 2033
- Figure 53: Middle East Industrial Lubricants Market Revenue Share (%), by Product Type 2025 & 2033
- Figure 54: Middle East Industrial Lubricants Market Volume Share (%), by Product Type 2025 & 2033
- Figure 55: Middle East Industrial Lubricants Market Revenue (billion), by End-user Industry 2025 & 2033
- Figure 56: Middle East Industrial Lubricants Market Volume (Billion), by End-user Industry 2025 & 2033
- Figure 57: Middle East Industrial Lubricants Market Revenue Share (%), by End-user Industry 2025 & 2033
- Figure 58: Middle East Industrial Lubricants Market Volume Share (%), by End-user Industry 2025 & 2033
- Figure 59: Middle East Industrial Lubricants Market Revenue (billion), by Country 2025 & 2033
- Figure 60: Middle East Industrial Lubricants Market Volume (Billion), by Country 2025 & 2033
- Figure 61: Middle East Industrial Lubricants Market Revenue Share (%), by Country 2025 & 2033
- Figure 62: Middle East Industrial Lubricants Market Volume Share (%), by Country 2025 & 2033
- Figure 63: Africa Industrial Lubricants Market Revenue (billion), by Product Type 2025 & 2033
- Figure 64: Africa Industrial Lubricants Market Volume (Billion), by Product Type 2025 & 2033
- Figure 65: Africa Industrial Lubricants Market Revenue Share (%), by Product Type 2025 & 2033
- Figure 66: Africa Industrial Lubricants Market Volume Share (%), by Product Type 2025 & 2033
- Figure 67: Africa Industrial Lubricants Market Revenue (billion), by End-user Industry 2025 & 2033
- Figure 68: Africa Industrial Lubricants Market Volume (Billion), by End-user Industry 2025 & 2033
- Figure 69: Africa Industrial Lubricants Market Revenue Share (%), by End-user Industry 2025 & 2033
- Figure 70: Africa Industrial Lubricants Market Volume Share (%), by End-user Industry 2025 & 2033
- Figure 71: Africa Industrial Lubricants Market Revenue (billion), by Country 2025 & 2033
- Figure 72: Africa Industrial Lubricants Market Volume (Billion), by Country 2025 & 2033
- Figure 73: Africa Industrial Lubricants Market Revenue Share (%), by Country 2025 & 2033
- Figure 74: Africa Industrial Lubricants Market Volume Share (%), by Country 2025 & 2033
List of Tables
- Table 1: Global Industrial Lubricants Market Revenue billion Forecast, by Product Type 2020 & 2033
- Table 2: Global Industrial Lubricants Market Volume Billion Forecast, by Product Type 2020 & 2033
- Table 3: Global Industrial Lubricants Market Revenue billion Forecast, by End-user Industry 2020 & 2033
- Table 4: Global Industrial Lubricants Market Volume Billion Forecast, by End-user Industry 2020 & 2033
- Table 5: Global Industrial Lubricants Market Revenue billion Forecast, by Region 2020 & 2033
- Table 6: Global Industrial Lubricants Market Volume Billion Forecast, by Region 2020 & 2033
- Table 7: Global Industrial Lubricants Market Revenue billion Forecast, by Product Type 2020 & 2033
- Table 8: Global Industrial Lubricants Market Volume Billion Forecast, by Product Type 2020 & 2033
- Table 9: Global Industrial Lubricants Market Revenue billion Forecast, by End-user Industry 2020 & 2033
- Table 10: Global Industrial Lubricants Market Volume Billion Forecast, by End-user Industry 2020 & 2033
- Table 11: Global Industrial Lubricants Market Revenue billion Forecast, by Country 2020 & 2033
- Table 12: Global Industrial Lubricants Market Volume Billion Forecast, by Country 2020 & 2033
- Table 13: China Industrial Lubricants Market Revenue (billion) Forecast, by Application 2020 & 2033
- Table 14: China Industrial Lubricants Market Volume (Billion) Forecast, by Application 2020 & 2033
- Table 15: India Industrial Lubricants Market Revenue (billion) Forecast, by Application 2020 & 2033
- Table 16: India Industrial Lubricants Market Volume (Billion) Forecast, by Application 2020 & 2033
- Table 17: Japan Industrial Lubricants Market Revenue (billion) Forecast, by Application 2020 & 2033
- Table 18: Japan Industrial Lubricants Market Volume (Billion) Forecast, by Application 2020 & 2033
- Table 19: South Korea Industrial Lubricants Market Revenue (billion) Forecast, by Application 2020 & 2033
- Table 20: South Korea Industrial Lubricants Market Volume (Billion) Forecast, by Application 2020 & 2033
- Table 21: Phillipines Industrial Lubricants Market Revenue (billion) Forecast, by Application 2020 & 2033
- Table 22: Phillipines Industrial Lubricants Market Volume (Billion) Forecast, by Application 2020 & 2033
- Table 23: Indonesia Industrial Lubricants Market Revenue (billion) Forecast, by Application 2020 & 2033
- Table 24: Indonesia Industrial Lubricants Market Volume (Billion) Forecast, by Application 2020 & 2033
- Table 25: Malaysia Industrial Lubricants Market Revenue (billion) Forecast, by Application 2020 & 2033
- Table 26: Malaysia Industrial Lubricants Market Volume (Billion) Forecast, by Application 2020 & 2033
- Table 27: Thailand Industrial Lubricants Market Revenue (billion) Forecast, by Application 2020 & 2033
- Table 28: Thailand Industrial Lubricants Market Volume (Billion) Forecast, by Application 2020 & 2033
- Table 29: Vietnam Industrial Lubricants Market Revenue (billion) Forecast, by Application 2020 & 2033
- Table 30: Vietnam Industrial Lubricants Market Volume (Billion) Forecast, by Application 2020 & 2033
- Table 31: Rest of Asia Pacific Industrial Lubricants Market Revenue (billion) Forecast, by Application 2020 & 2033
- Table 32: Rest of Asia Pacific Industrial Lubricants Market Volume (Billion) Forecast, by Application 2020 & 2033
- Table 33: Global Industrial Lubricants Market Revenue billion Forecast, by Product Type 2020 & 2033
- Table 34: Global Industrial Lubricants Market Volume Billion Forecast, by Product Type 2020 & 2033
- Table 35: Global Industrial Lubricants Market Revenue billion Forecast, by End-user Industry 2020 & 2033
- Table 36: Global Industrial Lubricants Market Volume Billion Forecast, by End-user Industry 2020 & 2033
- Table 37: Global Industrial Lubricants Market Revenue billion Forecast, by Country 2020 & 2033
- Table 38: Global Industrial Lubricants Market Volume Billion Forecast, by Country 2020 & 2033
- Table 39: United States Industrial Lubricants Market Revenue (billion) Forecast, by Application 2020 & 2033
- Table 40: United States Industrial Lubricants Market Volume (Billion) Forecast, by Application 2020 & 2033
- Table 41: Canada Industrial Lubricants Market Revenue (billion) Forecast, by Application 2020 & 2033
- Table 42: Canada Industrial Lubricants Market Volume (Billion) Forecast, by Application 2020 & 2033
- Table 43: Mexico Industrial Lubricants Market Revenue (billion) Forecast, by Application 2020 & 2033
- Table 44: Mexico Industrial Lubricants Market Volume (Billion) Forecast, by Application 2020 & 2033
- Table 45: Rest of North America Industrial Lubricants Market Revenue (billion) Forecast, by Application 2020 & 2033
- Table 46: Rest of North America Industrial Lubricants Market Volume (Billion) Forecast, by Application 2020 & 2033
- Table 47: Global Industrial Lubricants Market Revenue billion Forecast, by Product Type 2020 & 2033
- Table 48: Global Industrial Lubricants Market Volume Billion Forecast, by Product Type 2020 & 2033
- Table 49: Global Industrial Lubricants Market Revenue billion Forecast, by End-user Industry 2020 & 2033
- Table 50: Global Industrial Lubricants Market Volume Billion Forecast, by End-user Industry 2020 & 2033
- Table 51: Global Industrial Lubricants Market Revenue billion Forecast, by Country 2020 & 2033
- Table 52: Global Industrial Lubricants Market Volume Billion Forecast, by Country 2020 & 2033
- Table 53: Germany Industrial Lubricants Market Revenue (billion) Forecast, by Application 2020 & 2033
- Table 54: Germany Industrial Lubricants Market Volume (Billion) Forecast, by Application 2020 & 2033
- Table 55: United Kingdom Industrial Lubricants Market Revenue (billion) Forecast, by Application 2020 & 2033
- Table 56: United Kingdom Industrial Lubricants Market Volume (Billion) Forecast, by Application 2020 & 2033
- Table 57: Italy Industrial Lubricants Market Revenue (billion) Forecast, by Application 2020 & 2033
- Table 58: Italy Industrial Lubricants Market Volume (Billion) Forecast, by Application 2020 & 2033
- Table 59: France Industrial Lubricants Market Revenue (billion) Forecast, by Application 2020 & 2033
- Table 60: France Industrial Lubricants Market Volume (Billion) Forecast, by Application 2020 & 2033
- Table 61: Russia Industrial Lubricants Market Revenue (billion) Forecast, by Application 2020 & 2033
- Table 62: Russia Industrial Lubricants Market Volume (Billion) Forecast, by Application 2020 & 2033
- Table 63: Turkey Industrial Lubricants Market Revenue (billion) Forecast, by Application 2020 & 2033
- Table 64: Turkey Industrial Lubricants Market Volume (Billion) Forecast, by Application 2020 & 2033
- Table 65: Spain Industrial Lubricants Market Revenue (billion) Forecast, by Application 2020 & 2033
- Table 66: Spain Industrial Lubricants Market Volume (Billion) Forecast, by Application 2020 & 2033
- Table 67: Rest of Europe Industrial Lubricants Market Revenue (billion) Forecast, by Application 2020 & 2033
- Table 68: Rest of Europe Industrial Lubricants Market Volume (Billion) Forecast, by Application 2020 & 2033
- Table 69: Global Industrial Lubricants Market Revenue billion Forecast, by Product Type 2020 & 2033
- Table 70: Global Industrial Lubricants Market Volume Billion Forecast, by Product Type 2020 & 2033
- Table 71: Global Industrial Lubricants Market Revenue billion Forecast, by End-user Industry 2020 & 2033
- Table 72: Global Industrial Lubricants Market Volume Billion Forecast, by End-user Industry 2020 & 2033
- Table 73: Global Industrial Lubricants Market Revenue billion Forecast, by Country 2020 & 2033
- Table 74: Global Industrial Lubricants Market Volume Billion Forecast, by Country 2020 & 2033
- Table 75: Brazil Industrial Lubricants Market Revenue (billion) Forecast, by Application 2020 & 2033
- Table 76: Brazil Industrial Lubricants Market Volume (Billion) Forecast, by Application 2020 & 2033
- Table 77: Argentina Industrial Lubricants Market Revenue (billion) Forecast, by Application 2020 & 2033
- Table 78: Argentina Industrial Lubricants Market Volume (Billion) Forecast, by Application 2020 & 2033
- Table 79: Colombia Industrial Lubricants Market Revenue (billion) Forecast, by Application 2020 & 2033
- Table 80: Colombia Industrial Lubricants Market Volume (Billion) Forecast, by Application 2020 & 2033
- Table 81: Chile Industrial Lubricants Market Revenue (billion) Forecast, by Application 2020 & 2033
- Table 82: Chile Industrial Lubricants Market Volume (Billion) Forecast, by Application 2020 & 2033
- Table 83: Rest of South America Industrial Lubricants Market Revenue (billion) Forecast, by Application 2020 & 2033
- Table 84: Rest of South America Industrial Lubricants Market Volume (Billion) Forecast, by Application 2020 & 2033
- Table 85: Global Industrial Lubricants Market Revenue billion Forecast, by Product Type 2020 & 2033
- Table 86: Global Industrial Lubricants Market Volume Billion Forecast, by Product Type 2020 & 2033
- Table 87: Global Industrial Lubricants Market Revenue billion Forecast, by End-user Industry 2020 & 2033
- Table 88: Global Industrial Lubricants Market Volume Billion Forecast, by End-user Industry 2020 & 2033
- Table 89: Global Industrial Lubricants Market Revenue billion Forecast, by Country 2020 & 2033
- Table 90: Global Industrial Lubricants Market Volume Billion Forecast, by Country 2020 & 2033
- Table 91: Saudi Arabia Industrial Lubricants Market Revenue (billion) Forecast, by Application 2020 & 2033
- Table 92: Saudi Arabia Industrial Lubricants Market Volume (Billion) Forecast, by Application 2020 & 2033
- Table 93: Iran Industrial Lubricants Market Revenue (billion) Forecast, by Application 2020 & 2033
- Table 94: Iran Industrial Lubricants Market Volume (Billion) Forecast, by Application 2020 & 2033
- Table 95: Iraq Industrial Lubricants Market Revenue (billion) Forecast, by Application 2020 & 2033
- Table 96: Iraq Industrial Lubricants Market Volume (Billion) Forecast, by Application 2020 & 2033
- Table 97: United Arab Emirates Industrial Lubricants Market Revenue (billion) Forecast, by Application 2020 & 2033
- Table 98: United Arab Emirates Industrial Lubricants Market Volume (Billion) Forecast, by Application 2020 & 2033
- Table 99: Kuwait Industrial Lubricants Market Revenue (billion) Forecast, by Application 2020 & 2033
- Table 100: Kuwait Industrial Lubricants Market Volume (Billion) Forecast, by Application 2020 & 2033
- Table 101: Rest of Middle East Industrial Lubricants Market Revenue (billion) Forecast, by Application 2020 & 2033
- Table 102: Rest of Middle East Industrial Lubricants Market Volume (Billion) Forecast, by Application 2020 & 2033
- Table 103: Global Industrial Lubricants Market Revenue billion Forecast, by Product Type 2020 & 2033
- Table 104: Global Industrial Lubricants Market Volume Billion Forecast, by Product Type 2020 & 2033
- Table 105: Global Industrial Lubricants Market Revenue billion Forecast, by End-user Industry 2020 & 2033
- Table 106: Global Industrial Lubricants Market Volume Billion Forecast, by End-user Industry 2020 & 2033
- Table 107: Global Industrial Lubricants Market Revenue billion Forecast, by Country 2020 & 2033
- Table 108: Global Industrial Lubricants Market Volume Billion Forecast, by Country 2020 & 2033
- Table 109: Egypt Industrial Lubricants Market Revenue (billion) Forecast, by Application 2020 & 2033
- Table 110: Egypt Industrial Lubricants Market Volume (Billion) Forecast, by Application 2020 & 2033
- Table 111: South Africa Industrial Lubricants Market Revenue (billion) Forecast, by Application 2020 & 2033
- Table 112: South Africa Industrial Lubricants Market Volume (Billion) Forecast, by Application 2020 & 2033
- Table 113: Nigeria Industrial Lubricants Market Revenue (billion) Forecast, by Application 2020 & 2033
- Table 114: Nigeria Industrial Lubricants Market Volume (Billion) Forecast, by Application 2020 & 2033
- Table 115: Algeria Industrial Lubricants Market Revenue (billion) Forecast, by Application 2020 & 2033
- Table 116: Algeria Industrial Lubricants Market Volume (Billion) Forecast, by Application 2020 & 2033
- Table 117: Morocco Industrial Lubricants Market Revenue (billion) Forecast, by Application 2020 & 2033
- Table 118: Morocco Industrial Lubricants Market Volume (Billion) Forecast, by Application 2020 & 2033
- Table 119: Rest of Africa Industrial Lubricants Market Revenue (billion) Forecast, by Application 2020 & 2033
- Table 120: Rest of Africa Industrial Lubricants Market Volume (Billion) Forecast, by Application 2020 & 2033
Frequently Asked Questions
1. What is the projected Compound Annual Growth Rate (CAGR) of the Industrial Lubricants Market?
The projected CAGR is approximately 3.3%.
2. Which companies are prominent players in the Industrial Lubricants Market?
Key companies in the market include Shell PLC, Bharat Petroleum Corporation Limited, China Petroleum & Chemical Corporation (SINOPEC Group), LUKOIL, Exxon Mobil Corporation, Petronas Lubricants International, AMSOIL INC, Hindustan Petroleum Corporation Limited, Kluber Lubrication, China National Petroleum Corporation (PetroChina), ENEOS Corporation, FUCHS, Petrobras, Tide Water Oil Co (India) Ltd, Repsol, Gazprom Neft PJSC, PT Pertamina(Persero), Chevron Corporation, TotalEnergies, Idemitsu Kosan Co Ltd, Carl Bechem GmbH, Blaser Swisslube AG, Phillips 66 Company, ROCOL, Eni SpA, Valvoline*List Not Exhaustive, Indian Oil Corporation Ltd, BP p l c, Gulf Oil International.
3. What are the main segments of the Industrial Lubricants Market?
The market segments include Product Type, End-user Industry.
4. Can you provide details about the market size?
The market size is estimated to be USD 76.65 billion as of 2022.
5. What are some drivers contributing to market growth?
Increasing Demand from the Wind Energy Sector; Other Drivers.
6. What are the notable trends driving market growth?
Power Generation End-user Industry Dominated the Market.
7. Are there any restraints impacting market growth?
Detrimental Effects of Lubricants on the Environment; Other Restraints.
8. Can you provide examples of recent developments in the market?
Jan 2024: Shell plc's subsidiary, Shell Lubricants, completes the acquisition of the United Kingdom-based MIDEL and MIVOLT from Manchester-based M&I Materials Ltd to manufacture, distribute, and market the MIDEL and MIVOLT product lines as part of Shell’s global lubricants portfolio.
9. What pricing options are available for accessing the report?
Pricing options include single-user, multi-user, and enterprise licenses priced at USD 4750, USD 5250, and USD 8750 respectively.
10. Is the market size provided in terms of value or volume?
The market size is provided in terms of value, measured in billion and volume, measured in Billion.
11. Are there any specific market keywords associated with the report?
Yes, the market keyword associated with the report is "Industrial Lubricants Market," which aids in identifying and referencing the specific market segment covered.
12. How do I determine which pricing option suits my needs best?
The pricing options vary based on user requirements and access needs. Individual users may opt for single-user licenses, while businesses requiring broader access may choose multi-user or enterprise licenses for cost-effective access to the report.
13. Are there any additional resources or data provided in the Industrial Lubricants Market report?
While the report offers comprehensive insights, it's advisable to review the specific contents or supplementary materials provided to ascertain if additional resources or data are available.
14. How can I stay updated on further developments or reports in the Industrial Lubricants Market?
To stay informed about further developments, trends, and reports in the Industrial Lubricants Market, consider subscribing to industry newsletters, following relevant companies and organizations, or regularly checking reputable industry news sources and publications.
Methodology
Step 1 - Identification of Relevant Samples Size from Population Database


Step 2 - Approaches for Defining Global Market Size (Value, Volume* & Price*)

Note*: In applicable scenarios
Step 3 - Data Sources
Primary Research
- Web Analytics
- Survey Reports
- Research Institute
- Latest Research Reports
- Opinion Leaders
Secondary Research
- Annual Reports
- White Paper
- Latest Press Release
- Industry Association
- Paid Database
- Investor Presentations

Step 4 - Data Triangulation
Involves using different sources of information in order to increase the validity of a study
These sources are likely to be stakeholders in a program - participants, other researchers, program staff, other community members, and so on.
Then we put all data in single framework & apply various statistical tools to find out the dynamic on the market.
During the analysis stage, feedback from the stakeholder groups would be compared to determine areas of agreement as well as areas of divergence