
Key Insights
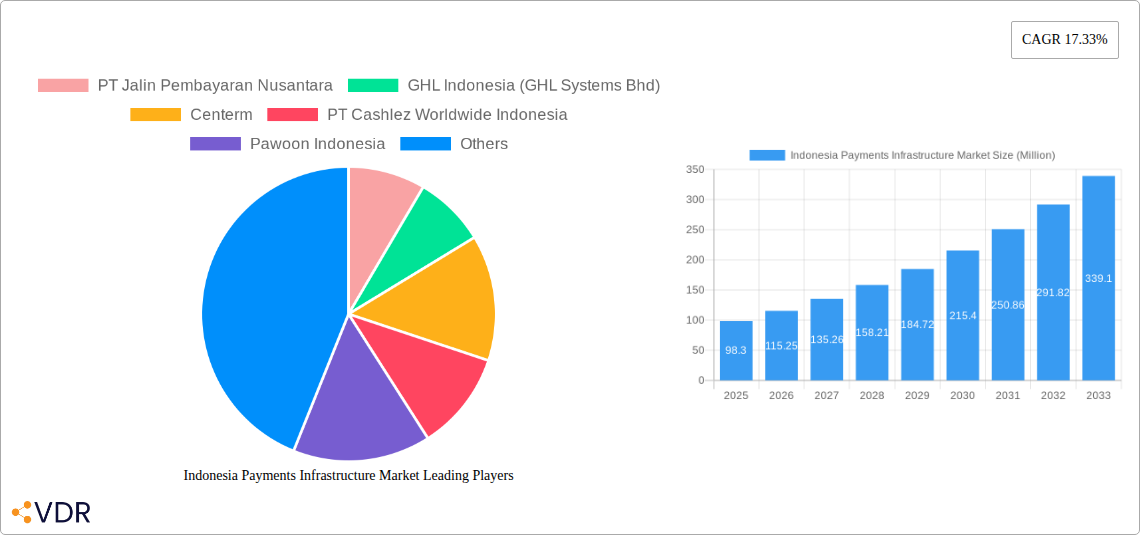
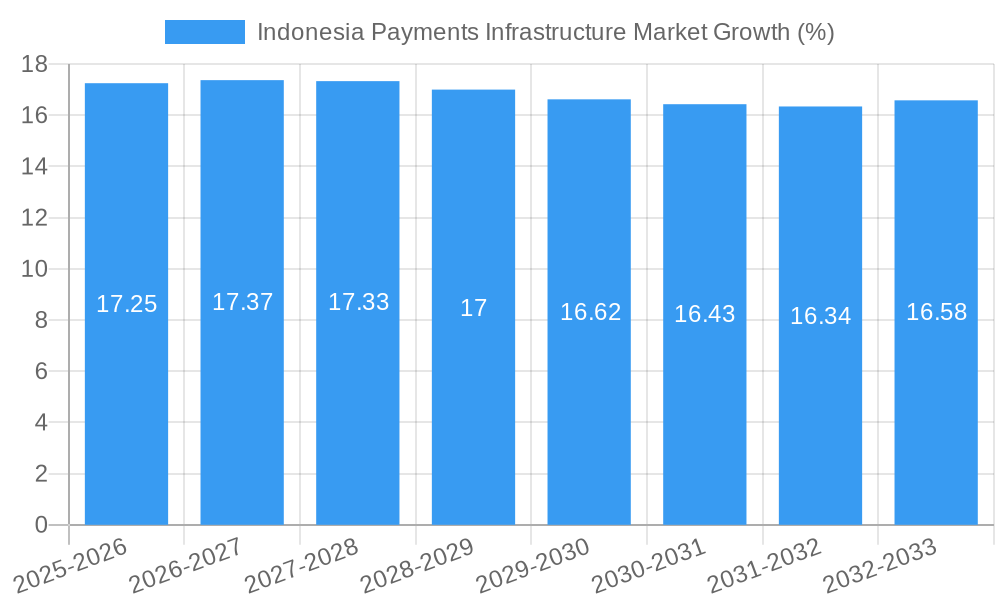
The Indonesia Payments Infrastructure Market is experiencing robust growth, projected to reach a market size of $98.30 million in 2025 and maintain a Compound Annual Growth Rate (CAGR) of 17.33% from 2025 to 2033. This expansion is driven by several key factors. Firstly, the increasing adoption of digital payment methods across various sectors, including healthcare, automotive, retail and marketing, and residential, is fueling demand for advanced payment infrastructure solutions. The rise of e-commerce and mobile banking within Indonesia's burgeoning digital economy necessitates efficient and secure payment processing systems, creating opportunities for providers of hardware, software, and services. Government initiatives promoting financial inclusion and digital transformation are also playing a significant role in market growth. Furthermore, the expanding middle class and increasing smartphone penetration are contributing to a wider adoption of cashless transactions. Competition among established players like PT Jalin Pembayaran Nusantara, GHL Indonesia, and Centerm, alongside the emergence of innovative fintech startups, is fostering innovation and driving down costs, making payment infrastructure more accessible to businesses of all sizes.
However, challenges remain. While the market demonstrates significant potential, the regulatory landscape needs to keep pace with the rapid technological advancements. Ensuring data security and consumer privacy in the face of increasing cyber threats is paramount. Addressing infrastructure limitations in certain regions of Indonesia and bridging the digital divide to achieve wider market penetration are also crucial considerations. Overcoming these challenges will be key to unlocking the full potential of the Indonesian payments infrastructure market and achieving sustainable, inclusive growth over the forecast period (2025-2033). The market segmentation by component (hardware, software, services) and end-user application (healthcare, automotive, retail, residential) allows for targeted market strategies tailored to the specific needs and preferences of each segment. This targeted approach will be crucial for maximizing market share and achieving optimal growth.
Indonesia Payments Infrastructure Market: A Comprehensive Report (2019-2033)
This in-depth report provides a comprehensive analysis of the Indonesia Payments Infrastructure Market, encompassing market dynamics, growth trends, key players, and future outlook. With a detailed examination of the parent market (Financial Technology) and child markets (Payment Hardware, Payment Software, Payment Services), this report offers invaluable insights for industry professionals, investors, and strategists. The study period covers 2019-2033, with a base year of 2025 and a forecast period of 2025-2033. Market values are presented in Million units.
Indonesia Payments Infrastructure Market Dynamics & Structure
The Indonesian payments infrastructure market is experiencing rapid expansion, driven by increasing smartphone penetration, growing e-commerce adoption, and government initiatives promoting digitalization. Market concentration is moderate, with several key players vying for market share. Technological innovation, particularly in contactless payments and mobile wallets, is a significant driver. The regulatory framework, while evolving, is generally supportive of fintech growth. However, challenges remain, including cybersecurity concerns and the need for greater financial literacy among the population. Mergers and acquisitions (M&A) activity is on the rise, with larger players consolidating their position and expanding their service offerings.
- Market Concentration: Moderately concentrated, with top 5 players holding approximately xx% market share in 2024.
- Technological Innovation: Focus on contactless payments, mobile wallets, and QR code-based solutions.
- Regulatory Framework: Supportive, but with ongoing evolution and potential for stricter regulations.
- Competitive Substitutes: Traditional cash transactions and limited use of credit/debit cards remain significant competitors.
- End-User Demographics: Predominantly young and tech-savvy population, driving high adoption rates of digital payment solutions.
- M&A Trends: Increasing M&A activity, particularly among payment gateways and fintech companies. xx deals were recorded in 2024.
Indonesia Payments Infrastructure Market Growth Trends & Insights
The Indonesian payments infrastructure market demonstrates strong growth, propelled by factors like rising digital literacy, increasing e-commerce transactions, and government support for financial inclusion. The market is witnessing a substantial shift from cash-based transactions to digital payments, reflecting the country's growing digital economy. Technological disruptions, such as the proliferation of mobile wallets and super apps, are accelerating this transition. Consumer behavior shows a clear preference for convenient and secure digital payment methods, with a rising demand for contactless and mobile-first solutions.
- Market Size Evolution: The market size expanded from xx Million in 2019 to xx Million in 2024, exhibiting a CAGR of xx%.
- Adoption Rates: Significant increase in digital payment adoption, with xx% of transactions conducted digitally in 2024.
- Technological Disruptions: Rapid adoption of mobile wallets, QR codes, and contactless payment technologies.
- Consumer Behavior Shifts: Growing preference for secure, convenient, and cashless payment methods.
Dominant Regions, Countries, or Segments in Indonesia Payments Infrastructure Market
The Retail and Marketing segment dominates the end-user application category, driven by the booming e-commerce sector and the increasing number of online transactions. Within components, the Software segment exhibits the highest growth potential due to rising demand for payment gateway solutions and digital payment platforms. Jakarta and other major urban centers lead in market adoption, while growth is also observed in secondary and tertiary cities as digital infrastructure expands.
- By Component: Software displays highest CAGR due to digital payment adoption.
- By End-User Application: Retail and Marketing segment leads due to e-commerce expansion.
- Geographic Dominance: Jakarta and other major cities lead in adoption, with significant growth potential in smaller cities.
- Key Drivers: Government initiatives promoting digitalization, improving digital infrastructure, expanding e-commerce.
Indonesia Payments Infrastructure Market Product Landscape
The Indonesian payments infrastructure market showcases a diverse range of products, including POS terminals, payment gateways, mobile wallets, and QR code-based payment systems. Innovation is focused on enhancing security, improving user experience, and expanding functionalities. The integration of biometric authentication and AI-powered fraud detection is gaining traction. Several players offer specialized solutions tailored to specific industry segments, reflecting the market's dynamism and the need for customized payment solutions.
Key Drivers, Barriers & Challenges in Indonesia Payments Infrastructure Market
Key Drivers:
- Growing Smartphone Penetration: Facilitates the adoption of mobile payment solutions.
- Government Initiatives: Policies promoting digitalization and financial inclusion.
- E-commerce Expansion: Drives the demand for secure and efficient online payment systems.
Key Challenges:
- Cybersecurity Concerns: Data breaches and fraud remain a major threat.
- Regulatory Hurdles: Complex regulatory landscape and evolving compliance requirements.
- Infrastructure Gaps: Uneven internet penetration and limited access to digital infrastructure in certain regions. xx% of the population lack reliable internet access.
Emerging Opportunities in Indonesia Payments Infrastructure Market
- Expansion into Underserved Markets: Reaching rural populations and expanding financial inclusion.
- Development of Innovative Payment Solutions: Integration with social media platforms, loyalty programs, and other services.
- Growth of Super Apps: Leveraging the popularity of super apps to integrate payment functionalities.
Growth Accelerators in the Indonesia Payments Infrastructure Market Industry
The Indonesian payments infrastructure market is poised for continued expansion, fueled by technological advancements, strategic collaborations, and the government's commitment to digital transformation. The increasing adoption of open banking APIs is expected to further enhance interoperability and drive innovation. Furthermore, the rising popularity of Buy Now, Pay Later (BNPL) services presents a significant growth opportunity.
Key Players Shaping the Indonesia Payments Infrastructure Market Market
- PT Jalin Pembayaran Nusantara
- GHL Indonesia (GHL Systems Bhd)
- Centerm
- PT Cashlez Worldwide Indonesia
- Pawoon Indonesia
- Moka POS (Go-Jek)
- Xendit
- Edgeworks Solutions Pte Ltd
- Olsera com
- Equip POS (HashMicro Pte Ltd)
- Inti Prima Mandiri Utama (iPaymu)
- Pax Technology
- PT indopay merchant services
- Ingenico
Notable Milestones in Indonesia Payments Infrastructure Market Sector
- March 2021: PAX Technology launched the IM10, a contactless payment device boosting QR code and touchless payment usage.
- May 2021: Gojek and Tokopedia merged to form GoTo Group, planning an IPO in New York and Jakarta.
In-Depth Indonesia Payments Infrastructure Market Market Outlook
The Indonesian payments infrastructure market is projected to maintain strong growth over the forecast period, driven by continuous technological advancements, supportive government policies, and the increasing adoption of digital payment solutions across various sectors. Strategic partnerships and collaborations among players will further accelerate market expansion. The focus on enhancing security, improving user experience, and expanding functionality will continue to shape the market landscape. The emergence of new technologies and innovative business models will create significant opportunities for growth and innovation within this dynamic market.
Indonesia Payments Infrastructure Market Segmentation
- 1. Production Analysis
- 2. Consumption Analysis
- 3. Import Market Analysis (Value & Volume)
- 4. Export Market Analysis (Value & Volume)
- 5. Price Trend Analysis
Indonesia Payments Infrastructure Market Segmentation By Geography
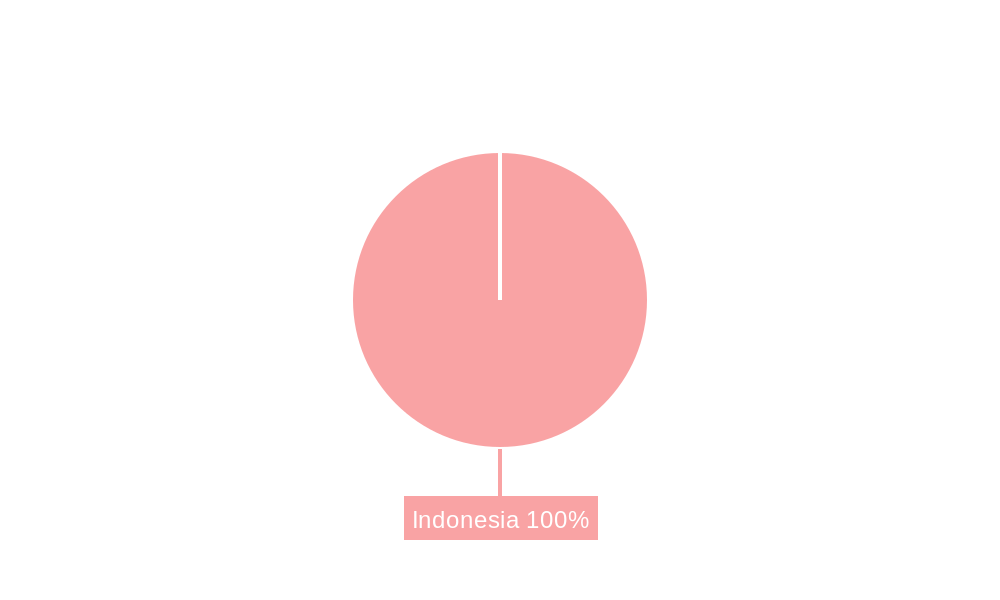
- 1. Indonesia
Indonesia Payments Infrastructure Market REPORT HIGHLIGHTS
| Aspects | Details |
|---|---|
| Study Period | 2019-2033 |
| Base Year | 2024 |
| Estimated Year | 2025 |
| Forecast Period | 2025-2033 |
| Historical Period | 2019-2024 |
| Growth Rate | CAGR of 17.33% from 2019-2033 |
| Segmentation |
|
Table of Contents
- 1. Introduction
- 1.1. Research Scope
- 1.2. Market Segmentation
- 1.3. Research Methodology
- 1.4. Definitions and Assumptions
- 2. Executive Summary
- 2.1. Introduction
- 3. Market Dynamics
- 3.1. Introduction
- 3.2. Market Drivers
- 3.2.1. Growing adoption of smart mirrors in the automotive sector; Growing investment in R&D to improve product portfolio
- 3.3. Market Restrains
- 3.3.1. Hight Cost and Lack of Awareness
- 3.4. Market Trends
- 3.4.1. Electronic Data Capture (EDC)
- 4. Market Factor Analysis
- 4.1. Porters Five Forces
- 4.2. Supply/Value Chain
- 4.3. PESTEL analysis
- 4.4. Market Entropy
- 4.5. Patent/Trademark Analysis
- 5. Indonesia Payments Infrastructure Market Analysis, Insights and Forecast, 2019-2031
- 5.1. Market Analysis, Insights and Forecast - by Production Analysis
- 5.2. Market Analysis, Insights and Forecast - by Consumption Analysis
- 5.3. Market Analysis, Insights and Forecast - by Import Market Analysis (Value & Volume)
- 5.4. Market Analysis, Insights and Forecast - by Export Market Analysis (Value & Volume)
- 5.5. Market Analysis, Insights and Forecast - by Price Trend Analysis
- 5.6. Market Analysis, Insights and Forecast - by Region
- 5.6.1. Indonesia
- 5.1. Market Analysis, Insights and Forecast - by Production Analysis
- 6. Competitive Analysis
- 6.1. Market Share Analysis 2024
- 6.2. Company Profiles
- 6.2.1 PT Jalin Pembayaran Nusantara
- 6.2.1.1. Overview
- 6.2.1.2. Products
- 6.2.1.3. SWOT Analysis
- 6.2.1.4. Recent Developments
- 6.2.1.5. Financials (Based on Availability)
- 6.2.2 GHL Indonesia (GHL Systems Bhd)
- 6.2.2.1. Overview
- 6.2.2.2. Products
- 6.2.2.3. SWOT Analysis
- 6.2.2.4. Recent Developments
- 6.2.2.5. Financials (Based on Availability)
- 6.2.3 Centerm
- 6.2.3.1. Overview
- 6.2.3.2. Products
- 6.2.3.3. SWOT Analysis
- 6.2.3.4. Recent Developments
- 6.2.3.5. Financials (Based on Availability)
- 6.2.4 PT Cashlez Worldwide Indonesia
- 6.2.4.1. Overview
- 6.2.4.2. Products
- 6.2.4.3. SWOT Analysis
- 6.2.4.4. Recent Developments
- 6.2.4.5. Financials (Based on Availability)
- 6.2.5 Pawoon Indonesia
- 6.2.5.1. Overview
- 6.2.5.2. Products
- 6.2.5.3. SWOT Analysis
- 6.2.5.4. Recent Developments
- 6.2.5.5. Financials (Based on Availability)
- 6.2.6 Moka POS (Go-Jek)
- 6.2.6.1. Overview
- 6.2.6.2. Products
- 6.2.6.3. SWOT Analysis
- 6.2.6.4. Recent Developments
- 6.2.6.5. Financials (Based on Availability)
- 6.2.7 Xendit
- 6.2.7.1. Overview
- 6.2.7.2. Products
- 6.2.7.3. SWOT Analysis
- 6.2.7.4. Recent Developments
- 6.2.7.5. Financials (Based on Availability)
- 6.2.8 Edgeworks Solutions Pte Ltd
- 6.2.8.1. Overview
- 6.2.8.2. Products
- 6.2.8.3. SWOT Analysis
- 6.2.8.4. Recent Developments
- 6.2.8.5. Financials (Based on Availability)
- 6.2.9 Olsera com
- 6.2.9.1. Overview
- 6.2.9.2. Products
- 6.2.9.3. SWOT Analysis
- 6.2.9.4. Recent Developments
- 6.2.9.5. Financials (Based on Availability)
- 6.2.10 Equip POS (HashMicro Pte Ltd)
- 6.2.10.1. Overview
- 6.2.10.2. Products
- 6.2.10.3. SWOT Analysis
- 6.2.10.4. Recent Developments
- 6.2.10.5. Financials (Based on Availability)
- 6.2.11 Inti Prima Mandiri Utama (iPaymu)
- 6.2.11.1. Overview
- 6.2.11.2. Products
- 6.2.11.3. SWOT Analysis
- 6.2.11.4. Recent Developments
- 6.2.11.5. Financials (Based on Availability)
- 6.2.12 Pax Technology
- 6.2.12.1. Overview
- 6.2.12.2. Products
- 6.2.12.3. SWOT Analysis
- 6.2.12.4. Recent Developments
- 6.2.12.5. Financials (Based on Availability)
- 6.2.13 PT indopay merchant services
- 6.2.13.1. Overview
- 6.2.13.2. Products
- 6.2.13.3. SWOT Analysis
- 6.2.13.4. Recent Developments
- 6.2.13.5. Financials (Based on Availability)
- 6.2.14 Ingenico
- 6.2.14.1. Overview
- 6.2.14.2. Products
- 6.2.14.3. SWOT Analysis
- 6.2.14.4. Recent Developments
- 6.2.14.5. Financials (Based on Availability)
- 6.2.1 PT Jalin Pembayaran Nusantara
List of Figures
- Figure 1: Indonesia Payments Infrastructure Market Revenue Breakdown (Million, %) by Product 2024 & 2032
- Figure 2: Indonesia Payments Infrastructure Market Share (%) by Company 2024
List of Tables
- Table 1: Indonesia Payments Infrastructure Market Revenue Million Forecast, by Region 2019 & 2032
- Table 2: Indonesia Payments Infrastructure Market Revenue Million Forecast, by Production Analysis 2019 & 2032
- Table 3: Indonesia Payments Infrastructure Market Revenue Million Forecast, by Consumption Analysis 2019 & 2032
- Table 4: Indonesia Payments Infrastructure Market Revenue Million Forecast, by Import Market Analysis (Value & Volume) 2019 & 2032
- Table 5: Indonesia Payments Infrastructure Market Revenue Million Forecast, by Export Market Analysis (Value & Volume) 2019 & 2032
- Table 6: Indonesia Payments Infrastructure Market Revenue Million Forecast, by Price Trend Analysis 2019 & 2032
- Table 7: Indonesia Payments Infrastructure Market Revenue Million Forecast, by Region 2019 & 2032
- Table 8: Indonesia Payments Infrastructure Market Revenue Million Forecast, by Country 2019 & 2032
- Table 9: Indonesia Payments Infrastructure Market Revenue Million Forecast, by Production Analysis 2019 & 2032
- Table 10: Indonesia Payments Infrastructure Market Revenue Million Forecast, by Consumption Analysis 2019 & 2032
- Table 11: Indonesia Payments Infrastructure Market Revenue Million Forecast, by Import Market Analysis (Value & Volume) 2019 & 2032
- Table 12: Indonesia Payments Infrastructure Market Revenue Million Forecast, by Export Market Analysis (Value & Volume) 2019 & 2032
- Table 13: Indonesia Payments Infrastructure Market Revenue Million Forecast, by Price Trend Analysis 2019 & 2032
- Table 14: Indonesia Payments Infrastructure Market Revenue Million Forecast, by Country 2019 & 2032
Frequently Asked Questions
1. What is the projected Compound Annual Growth Rate (CAGR) of the Indonesia Payments Infrastructure Market?
The projected CAGR is approximately 17.33%.
2. Which companies are prominent players in the Indonesia Payments Infrastructure Market?
Key companies in the market include PT Jalin Pembayaran Nusantara, GHL Indonesia (GHL Systems Bhd), Centerm, PT Cashlez Worldwide Indonesia, Pawoon Indonesia, Moka POS (Go-Jek), Xendit, Edgeworks Solutions Pte Ltd, Olsera com, Equip POS (HashMicro Pte Ltd), Inti Prima Mandiri Utama (iPaymu), Pax Technology, PT indopay merchant services, Ingenico.
3. What are the main segments of the Indonesia Payments Infrastructure Market?
The market segments include Production Analysis, Consumption Analysis, Import Market Analysis (Value & Volume), Export Market Analysis (Value & Volume), Price Trend Analysis.
4. Can you provide details about the market size?
The market size is estimated to be USD 98.30 Million as of 2022.
5. What are some drivers contributing to market growth?
Growing adoption of smart mirrors in the automotive sector; Growing investment in R&D to improve product portfolio.
6. What are the notable trends driving market growth?
Electronic Data Capture (EDC).
7. Are there any restraints impacting market growth?
Hight Cost and Lack of Awareness.
8. Can you provide examples of recent developments in the market?
March 2021- PAX Technology introduced the IM10, the latest unattended payment device that will drive the usage of QR codes and contactless payments in any touchless environment. The IM10 is the newest addition to the IM Series, an all-in-one payment device with a small footprint.
9. What pricing options are available for accessing the report?
Pricing options include single-user, multi-user, and enterprise licenses priced at USD 3800, USD 4500, and USD 5800 respectively.
10. Is the market size provided in terms of value or volume?
The market size is provided in terms of value, measured in Million.
11. Are there any specific market keywords associated with the report?
Yes, the market keyword associated with the report is "Indonesia Payments Infrastructure Market," which aids in identifying and referencing the specific market segment covered.
12. How do I determine which pricing option suits my needs best?
The pricing options vary based on user requirements and access needs. Individual users may opt for single-user licenses, while businesses requiring broader access may choose multi-user or enterprise licenses for cost-effective access to the report.
13. Are there any additional resources or data provided in the Indonesia Payments Infrastructure Market report?
While the report offers comprehensive insights, it's advisable to review the specific contents or supplementary materials provided to ascertain if additional resources or data are available.
14. How can I stay updated on further developments or reports in the Indonesia Payments Infrastructure Market?
To stay informed about further developments, trends, and reports in the Indonesia Payments Infrastructure Market, consider subscribing to industry newsletters, following relevant companies and organizations, or regularly checking reputable industry news sources and publications.
Methodology
Step 1 - Identification of Relevant Samples Size from Population Database


Step 2 - Approaches for Defining Global Market Size (Value, Volume* & Price*)

Note*: In applicable scenarios
Step 3 - Data Sources
Primary Research
- Web Analytics
- Survey Reports
- Research Institute
- Latest Research Reports
- Opinion Leaders
Secondary Research
- Annual Reports
- White Paper
- Latest Press Release
- Industry Association
- Paid Database
- Investor Presentations

Step 4 - Data Triangulation
Involves using different sources of information in order to increase the validity of a study
These sources are likely to be stakeholders in a program - participants, other researchers, program staff, other community members, and so on.
Then we put all data in single framework & apply various statistical tools to find out the dynamic on the market.
During the analysis stage, feedback from the stakeholder groups would be compared to determine areas of agreement as well as areas of divergence


