

Key Insights
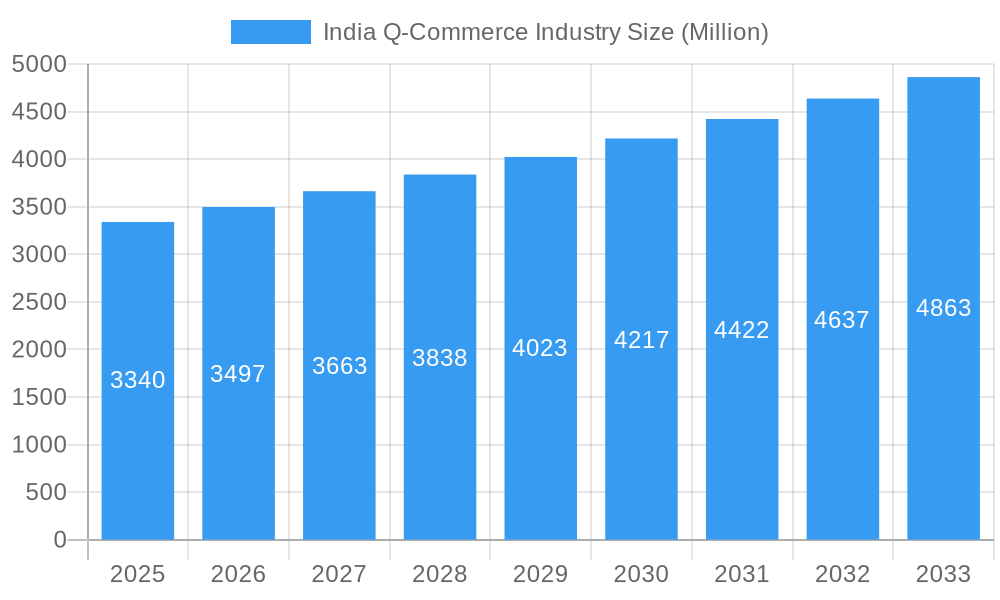
The Indian quick-commerce (Q-commerce) market, valued at $3.34 billion in 2025, is experiencing robust growth, projected to maintain a Compound Annual Growth Rate (CAGR) exceeding 4.5% through 2033. This explosive expansion is fueled by several key drivers. Rising smartphone penetration and internet access across India, particularly in urban areas, have significantly broadened the customer base for on-demand delivery services. A burgeoning young population accustomed to instant gratification and a preference for convenience are further propelling market growth. The increasing adoption of digital payment methods and robust logistics infrastructure, while still developing in certain regions, are also contributing factors. Competitive intensity, with players like Swiggy Instamart, Blinkit, Zepto, and BigBasket vying for market share, is leading to innovation in delivery speed, product offerings, and customer experience. However, challenges remain, including operational complexities associated with managing last-mile delivery in densely populated areas, maintaining profitability amidst intense competition, and addressing concerns about food safety and quality control. Expansion into Tier 2 and Tier 3 cities presents both significant opportunities and logistical hurdles. The market's future success hinges on companies’ ability to navigate these challenges while continuing to enhance their technological capabilities and customer service.
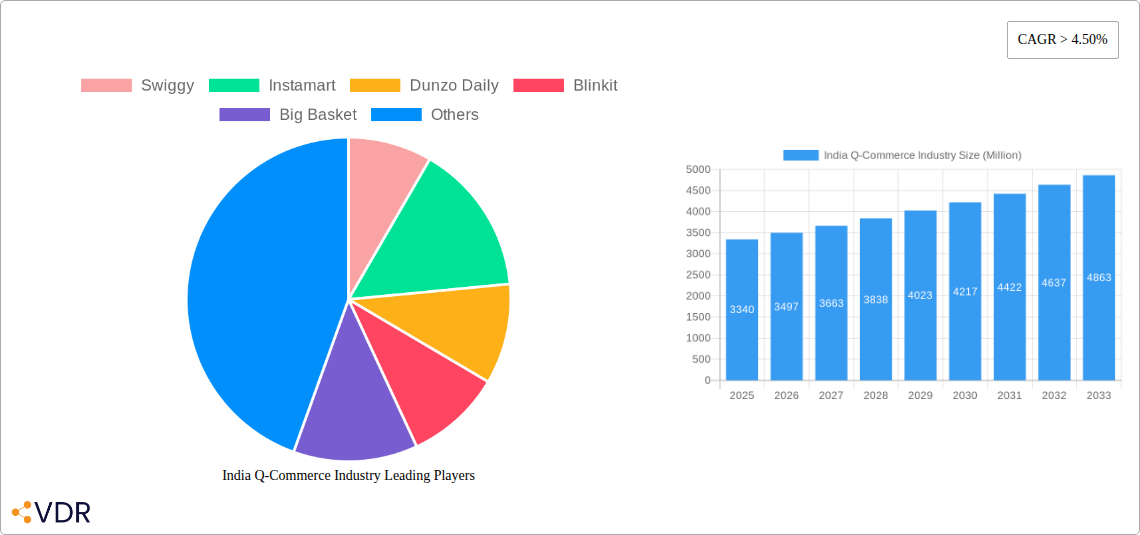
India Q-Commerce Industry Market Size (In Billion)
The segmentation of the Indian Q-commerce market is primarily driven by product categories (groceries, pharmaceuticals, electronics, etc.), customer demographics (age, income, location), and service offerings (delivery speed, subscription models). While precise segment data is unavailable, a logical deduction suggests a substantial share dominated by grocery delivery, given the sector’s inherent high demand and ease of scalability. However, other segments, such as pharmaceuticals and everyday essentials, are showing significant potential for growth. The competitive landscape is highly dynamic, with established players and new entrants constantly striving for differentiation through faster delivery times, wider product selection, and superior customer service. Sustained investment in technology, including AI-powered logistics optimization and personalized recommendations, will be critical for achieving a sustainable competitive advantage in this rapidly evolving sector. Predicting future market share accurately is challenging due to the fluidity of the market, but maintaining a strong focus on customer experience and operational efficiency will be paramount for market leadership.
India Q-Commerce Industry Company Market Share
India Q-Commerce Industry Market Report: 2019-2033
This comprehensive report provides an in-depth analysis of the rapidly evolving Indian Q-commerce industry, encompassing market dynamics, growth trends, key players, and future outlook. With a focus on the period 2019-2033 (Base Year: 2025, Forecast Period: 2025-2033), this report is an essential resource for industry professionals, investors, and strategists seeking to understand and capitalize on the opportunities within this dynamic sector. The report covers parent markets like online grocery delivery and child markets like hyperlocal delivery of groceries, pharmaceuticals, and other daily essentials.
India Q-Commerce Industry Market Dynamics & Structure
The Indian Q-commerce market is characterized by intense competition, rapid innovation, and significant consolidation. The market concentration is currently high, with a few major players dominating, but fragmentation exists in niche areas. Technological advancements, particularly in logistics and delivery technologies, are key drivers. Regulatory frameworks, while evolving, are generally supportive of the growth of e-commerce, though challenges remain regarding last-mile delivery and data privacy. Competitive substitutes include traditional brick-and-mortar stores and larger e-commerce platforms offering slower delivery options. The end-user demographic is expanding beyond urban millennials to encompass a broader range of age groups and income levels across Tier 1, Tier 2, and Tier 3 cities. M&A activity has been substantial, reflecting the industry's consolidation and expansion strategies.
- Market Concentration: Top 5 players hold approximately xx% market share (2024).
- Technological Innovation: Focus on drone delivery, AI-powered inventory management, and automated warehouses.
- Regulatory Framework: Ongoing developments in data privacy laws and delivery regulations.
- M&A Deal Volume: xx deals in 2024, totaling xx Million USD.
- Innovation Barriers: High infrastructural costs, lack of skilled workforce in certain regions.
India Q-Commerce Industry Growth Trends & Insights
The Indian Q-commerce market has experienced phenomenal growth since its inception. The market size grew from xx Million units in 2019 to xx Million units in 2024, exhibiting a CAGR of xx%. This growth is driven by increasing smartphone penetration, rising internet usage, and changing consumer preferences towards convenience and speed. Technological disruptions, such as the adoption of advanced logistics solutions, have significantly improved efficiency and delivery times. Consumer behaviour shifts include increased reliance on online platforms for daily necessities and a growing preference for contactless delivery. Market penetration remains relatively low, suggesting substantial untapped potential for future growth. The adoption rate is expected to accelerate, particularly in Tier 2 and 3 cities, driven by improvements in logistics infrastructure and increasing digital literacy.
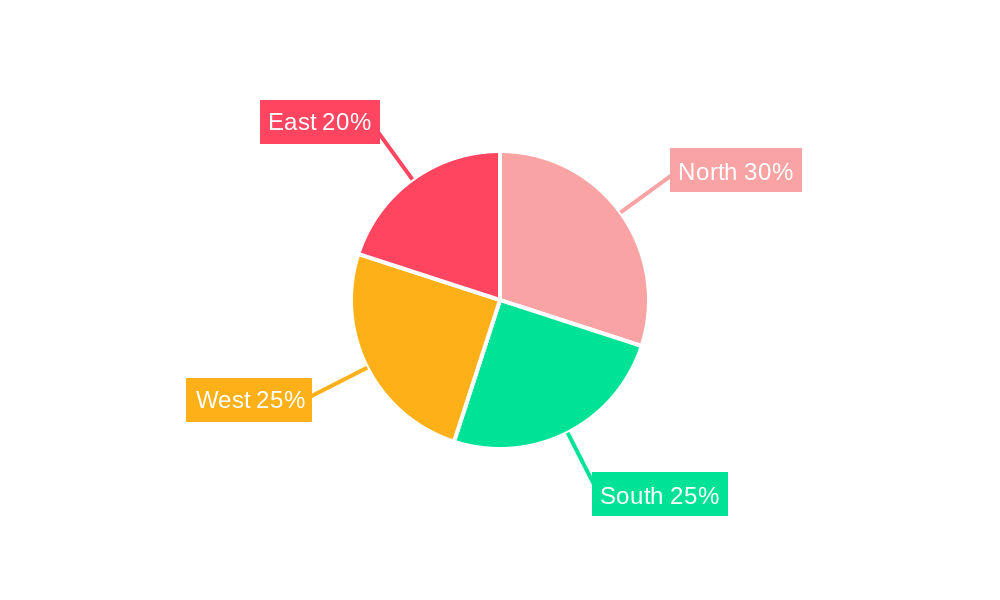
Dominant Regions, Countries, or Segments in India Q-Commerce Industry
The major metropolitan areas in India (Mumbai, Delhi, Bangalore, Hyderabad, etc.) are currently the dominant regions for Q-commerce, accounting for approximately xx% of the total market size in 2024. This dominance is attributable to factors such as high population density, higher disposable incomes, better infrastructure, and higher internet penetration. However, growth is rapidly expanding to Tier 2 and 3 cities fueled by improved logistics, increasing smartphone penetration, and targeted marketing strategies. The grocery segment represents the largest portion of the Q-commerce market, followed by the pharmaceutical and daily essentials segments.
- Key Drivers: High population density, increasing disposable incomes, improving digital infrastructure in Tier-1 & Tier-2 cities.
- Dominance Factors: Established logistics networks, strong consumer base, and high demand for convenience.
- Growth Potential: Significant untapped potential in Tier 2 and 3 cities, expanding product categories beyond groceries.
India Q-Commerce Industry Product Landscape
The Q-commerce product landscape is characterized by a diverse range of offerings, including groceries, daily essentials, pharmaceuticals, and even prepared meals. Innovative product offerings include personalized recommendations, subscription services, and bundled deals to improve customer experience. Key performance metrics include delivery times, order accuracy, and customer satisfaction scores. Technological advancements in areas such as AI-powered inventory management are driving greater efficiency and reducing operational costs. Unique selling propositions among various companies include specialized product offerings, quicker delivery times, and loyalty programs.
Key Drivers, Barriers & Challenges in India Q-Commerce Industry
Key Drivers: The rapid growth of the Indian Q-commerce industry is driven by several factors, including the increasing penetration of smartphones and internet access, a growing preference for convenience and speed among consumers, and significant investment in technology and logistics. Government initiatives promoting digitalization also play a significant role.
Key Challenges and Restraints: Challenges include the high cost of last-mile delivery, particularly in densely populated urban areas. Regulatory hurdles, including licensing and compliance requirements, also pose obstacles. Intense competition among players and the pressure to maintain profitability constrain market expansion. Supply chain disruptions can cause significant delays and negatively impact customer satisfaction.
Emerging Opportunities in India Q-Commerce Industry
Untapped markets in Tier 2 and 3 cities represent significant growth opportunities. Innovative applications of technology, such as drone delivery and automated warehousing, can improve efficiency and reduce costs. Evolving consumer preferences towards healthier and more sustainable products present opportunities for specialized Q-commerce platforms.
Growth Accelerators in the India Q-Commerce Industry
Technological advancements in logistics, artificial intelligence, and data analytics are expected to significantly accelerate growth. Strategic partnerships between Q-commerce platforms and retail chains can enhance product reach and customer base. Expansion into new geographic markets and product categories will drive market expansion.
Key Players Shaping the India Q-Commerce Industry Market
- Swiggy
- Instamart
- Dunzo Daily
- Blinkit
- Big Basket
- Zepto
- Grofers
- Flipkart Quick
- Supr Daily
- Zomato
- List Not Exhaustive
Notable Milestones in India Q-Commerce Industry Sector
- February 2023: Zomato launched Zomato Instant, a quick commerce delivery service for home-style cooked food.
- December 2023: Walmart's acquisition of Flipkart led to the launch of Flipkart's quick commerce services in 20 cities.
In-Depth India Q-Commerce Industry Market Outlook
The Indian Q-commerce market is poised for continued strong growth, driven by technological innovation, expanding consumer base, and increased investment. Strategic partnerships, market expansion into underserved areas, and diversification of product offerings will be key factors in shaping the future of the industry. Opportunities exist for players who can effectively manage logistics costs, navigate regulatory challenges, and adapt to evolving consumer preferences. The focus will increasingly be on sustainability, personalization, and providing seamless customer experiences.
India Q-Commerce Industry Segmentation
-
1. Product Type
- 1.1. Groceries
- 1.2. Personal Care
- 1.3. Fresh Food
- 1.4. Other Product Types
-
2. Company Type
- 2.1. Pureplay
- 2.2. Non-pureplay
India Q-Commerce Industry Segmentation By Geography
- 1. India
India Q-Commerce Industry Regional Market Share
Geographic Coverage of India Q-Commerce Industry
India Q-Commerce Industry REPORT HIGHLIGHTS
| Aspects | Details |
|---|---|
| Study Period | 2020-2034 |
| Base Year | 2025 |
| Estimated Year | 2026 |
| Forecast Period | 2026-2034 |
| Historical Period | 2020-2025 |
| Growth Rate | CAGR of > 4.50% from 2020-2034 |
| Segmentation |
|
Table of Contents
- 1. Introduction
- 1.1. Research Scope
- 1.2. Market Segmentation
- 1.3. Research Objective
- 1.4. Definitions and Assumptions
- 2. Executive Summary
- 2.1. Market Snapshot
- 3. Market Dynamics
- 3.1. Market Drivers
- 3.2. Market Restrains
- 3.3. Market Trends
- 3.4. Market Opportunities
- 4. Market Factor Analysis
- 4.1. Porters Five Forces
- 4.1.1. Bargaining Power of Suppliers
- 4.1.2. Bargaining Power of Buyers
- 4.1.3. Threat of New Entrants
- 4.1.4. Threat of Substitutes
- 4.1.5. Competitive Rivalry
- 4.2. PESTEL analysis
- 4.3. BCG Analysis
- 4.3.1. Stars (High Growth, High Market Share)
- 4.3.2. Cash Cows (Low Growth, High Market Share)
- 4.3.3. Question Mark (High Growth, Low Market Share)
- 4.3.4. Dogs (Low Growth, Low Market Share)
- 4.4. Ansoff Matrix Analysis
- 4.5. Supply Chain Analysis
- 4.6. Regulatory Landscape
- 4.7. Current Market Potential and Opportunity Assessment (TAM–SAM–SOM Framework)
- 4.8. VDR Analyst Note
- 4.1. Porters Five Forces
- 5. Market Analysis, Insights and Forecast 2021-2033
- 5.1. Market Analysis, Insights and Forecast - by Product Type
- 5.1.1. Groceries
- 5.1.2. Personal Care
- 5.1.3. Fresh Food
- 5.1.4. Other Product Types
- 5.2. Market Analysis, Insights and Forecast - by Company Type
- 5.2.1. Pureplay
- 5.2.2. Non-pureplay
- 5.3. Market Analysis, Insights and Forecast - by Region
- 5.3.1. India
- 5.1. Market Analysis, Insights and Forecast - by Product Type
- 6. India Q-Commerce Industry Analysis, Insights and Forecast, 2021-2033
- 6.1. Market Analysis, Insights and Forecast - by Product Type
- 6.1.1. Groceries
- 6.1.2. Personal Care
- 6.1.3. Fresh Food
- 6.1.4. Other Product Types
- 6.2. Market Analysis, Insights and Forecast - by Company Type
- 6.2.1. Pureplay
- 6.2.2. Non-pureplay
- 6.1. Market Analysis, Insights and Forecast - by Product Type
- 7. Competitive Analysis
- 7.1. Company Profiles
- 7.1.1 Swiggy
- 7.1.1.1. Company Overview
- 7.1.1.2. Products
- 7.1.1.3. Company Financials
- 7.1.1.4. SWOT Analysis
- 7.1.2 Instamart
- 7.1.2.1. Company Overview
- 7.1.2.2. Products
- 7.1.2.3. Company Financials
- 7.1.2.4. SWOT Analysis
- 7.1.3 Dunzo Daily
- 7.1.3.1. Company Overview
- 7.1.3.2. Products
- 7.1.3.3. Company Financials
- 7.1.3.4. SWOT Analysis
- 7.1.4 Blinkit
- 7.1.4.1. Company Overview
- 7.1.4.2. Products
- 7.1.4.3. Company Financials
- 7.1.4.4. SWOT Analysis
- 7.1.5 Big Basket
- 7.1.5.1. Company Overview
- 7.1.5.2. Products
- 7.1.5.3. Company Financials
- 7.1.5.4. SWOT Analysis
- 7.1.6 Zepto
- 7.1.6.1. Company Overview
- 7.1.6.2. Products
- 7.1.6.3. Company Financials
- 7.1.6.4. SWOT Analysis
- 7.1.7 Grofers
- 7.1.7.1. Company Overview
- 7.1.7.2. Products
- 7.1.7.3. Company Financials
- 7.1.7.4. SWOT Analysis
- 7.1.8 Flipkart Quick
- 7.1.8.1. Company Overview
- 7.1.8.2. Products
- 7.1.8.3. Company Financials
- 7.1.8.4. SWOT Analysis
- 7.1.9 Supr Daily
- 7.1.9.1. Company Overview
- 7.1.9.2. Products
- 7.1.9.3. Company Financials
- 7.1.9.4. SWOT Analysis
- 7.1.10 Zomato**List Not Exhaustive
- 7.1.10.1. Company Overview
- 7.1.10.2. Products
- 7.1.10.3. Company Financials
- 7.1.10.4. SWOT Analysis
- 7.1.1 Swiggy
- 7.2. Market Entropy
- 7.2.1 Company's Key Areas Served
- 7.2.2 Recent Developments
- 7.3. Company Market Share Analysis 2025
- 7.3.1 Top 5 Companies Market Share Analysis
- 7.3.2 Top 3 Companies Market Share Analysis
- 7.4. List of Potential Customers
- 8. Research Methodology
List of Figures
- Figure 1: India Q-Commerce Industry Revenue Breakdown (Million, %) by Product 2025 & 2033
- Figure 2: India Q-Commerce Industry Share (%) by Company 2025
List of Tables
- Table 1: India Q-Commerce Industry Revenue Million Forecast, by Product Type 2020 & 2033
- Table 2: India Q-Commerce Industry Volume Billion Forecast, by Product Type 2020 & 2033
- Table 3: India Q-Commerce Industry Revenue Million Forecast, by Company Type 2020 & 2033
- Table 4: India Q-Commerce Industry Volume Billion Forecast, by Company Type 2020 & 2033
- Table 5: India Q-Commerce Industry Revenue Million Forecast, by Region 2020 & 2033
- Table 6: India Q-Commerce Industry Volume Billion Forecast, by Region 2020 & 2033
- Table 7: India Q-Commerce Industry Revenue Million Forecast, by Product Type 2020 & 2033
- Table 8: India Q-Commerce Industry Volume Billion Forecast, by Product Type 2020 & 2033
- Table 9: India Q-Commerce Industry Revenue Million Forecast, by Company Type 2020 & 2033
- Table 10: India Q-Commerce Industry Volume Billion Forecast, by Company Type 2020 & 2033
- Table 11: India Q-Commerce Industry Revenue Million Forecast, by Country 2020 & 2033
- Table 12: India Q-Commerce Industry Volume Billion Forecast, by Country 2020 & 2033
Frequently Asked Questions
1. What is the projected Compound Annual Growth Rate (CAGR) of the India Q-Commerce Industry?
The projected CAGR is approximately > 4.50%.
2. Which companies are prominent players in the India Q-Commerce Industry?
Key companies in the market include Swiggy, Instamart, Dunzo Daily, Blinkit, Big Basket, Zepto, Grofers, Flipkart Quick, Supr Daily, Zomato**List Not Exhaustive.
3. What are the main segments of the India Q-Commerce Industry?
The market segments include Product Type, Company Type.
4. Can you provide details about the market size?
The market size is estimated to be USD 3.34 Million as of 2022.
5. What are some drivers contributing to market growth?
Faster Buying Process Drives the Market; Faster Response to Buyer/Market Demands Drives the Market.
6. What are the notable trends driving market growth?
Rising Entry of Startups into the Market.
7. Are there any restraints impacting market growth?
Faster Buying Process Drives the Market; Faster Response to Buyer/Market Demands Drives the Market.
8. Can you provide examples of recent developments in the market?
February 2023: Zomato launched a quick commerce delivery service known as Zomato Instant. The aim is to provide customers with home-style cooked food at affordable prices.
9. What pricing options are available for accessing the report?
Pricing options include single-user, multi-user, and enterprise licenses priced at USD 3800, USD 4500, and USD 5800 respectively.
10. Is the market size provided in terms of value or volume?
The market size is provided in terms of value, measured in Million and volume, measured in Billion.
11. Are there any specific market keywords associated with the report?
Yes, the market keyword associated with the report is "India Q-Commerce Industry," which aids in identifying and referencing the specific market segment covered.
12. How do I determine which pricing option suits my needs best?
The pricing options vary based on user requirements and access needs. Individual users may opt for single-user licenses, while businesses requiring broader access may choose multi-user or enterprise licenses for cost-effective access to the report.
13. Are there any additional resources or data provided in the India Q-Commerce Industry report?
While the report offers comprehensive insights, it's advisable to review the specific contents or supplementary materials provided to ascertain if additional resources or data are available.
14. How can I stay updated on further developments or reports in the India Q-Commerce Industry?
To stay informed about further developments, trends, and reports in the India Q-Commerce Industry, consider subscribing to industry newsletters, following relevant companies and organizations, or regularly checking reputable industry news sources and publications.
Methodology
Step 1 - Identification of Relevant Samples Size from Population Database


Step 2 - Approaches for Defining Global Market Size (Value, Volume* & Price*)

Note*: In applicable scenarios
Step 3 - Data Sources
Primary Research
- Web Analytics
- Survey Reports
- Research Institute
- Latest Research Reports
- Opinion Leaders
Secondary Research
- Annual Reports
- White Paper
- Latest Press Release
- Industry Association
- Paid Database
- Investor Presentations

Step 4 - Data Triangulation
Involves using different sources of information in order to increase the validity of a study
These sources are likely to be stakeholders in a program - participants, other researchers, program staff, other community members, and so on.
Then we put all data in single framework & apply various statistical tools to find out the dynamic on the market.
During the analysis stage, feedback from the stakeholder groups would be compared to determine areas of agreement as well as areas of divergence