

Key Insights
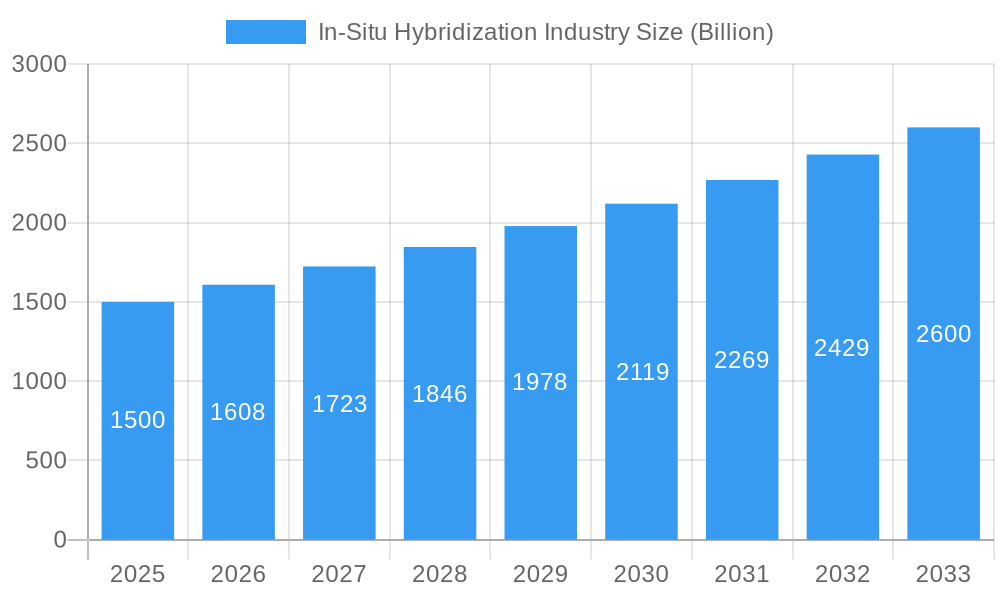
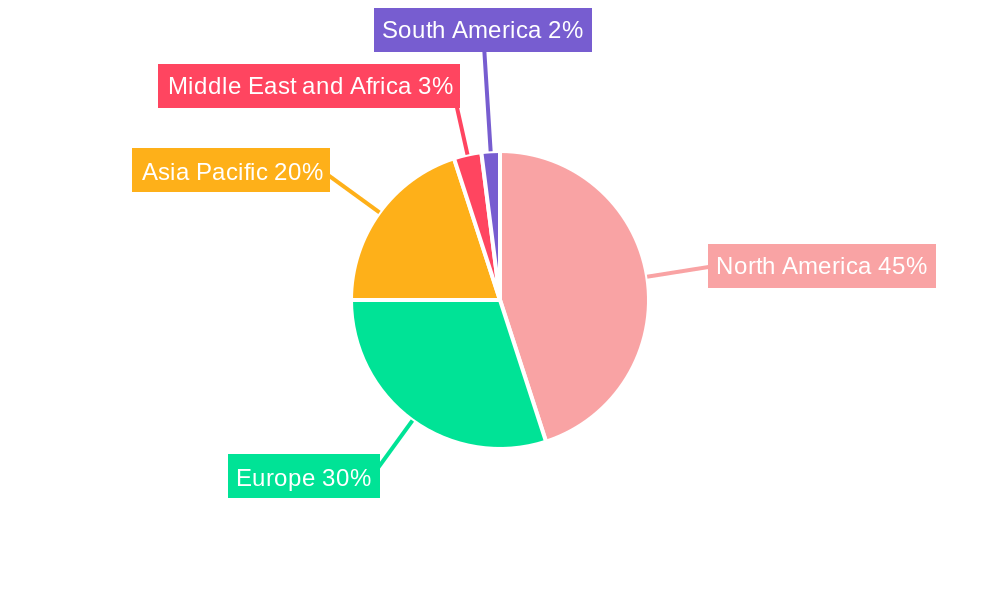
The In-Situ Hybridization (ISH) market, valued at $1.5 billion in 2025, is projected to experience robust growth, driven by a Compound Annual Growth Rate (CAGR) of 7.20% from 2025 to 2033. This expansion is fueled by several key factors. The increasing prevalence of cancer and infectious diseases globally necessitates advanced diagnostic tools, making ISH techniques – particularly Fluorescence In Situ Hybridization (FISH) and Chromogenic In Situ Hybridization (CISH) – indispensable for accurate diagnosis and personalized treatment. Furthermore, ongoing research and development efforts are leading to improved ISH techniques with higher sensitivity and specificity, broadening their applications in various fields. The market is segmented by product type (analytical instruments, kits and reagents, software and services, and other products), technique (FISH and CISH), application (cancer, infectious diseases, and others), and end-user (diagnostic laboratories, academic and research institutions, and Contract Research Organizations (CROs)). The substantial investments in research and development within the pharmaceutical and biotechnology industries also contribute to market growth by stimulating the demand for accurate and efficient ISH-based diagnostic solutions. North America currently holds a significant market share due to its advanced healthcare infrastructure and high adoption rates of novel diagnostic technologies, but the Asia-Pacific region is expected to witness rapid growth fueled by rising healthcare spending and increasing awareness of ISH applications.
In-Situ Hybridization Industry Market Size (In Billion)
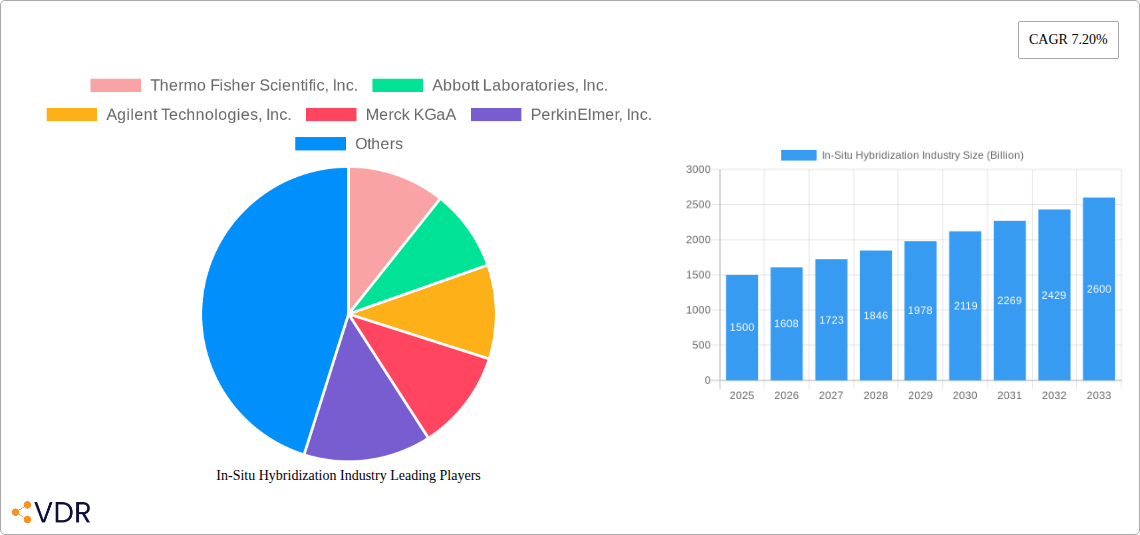
The competitive landscape is characterized by the presence of several prominent players, including Thermo Fisher Scientific, Abbott Laboratories, Agilent Technologies, Merck KGaA, PerkinElmer, Bio-Rad Laboratories, Roche, Danaher Corporation, Abnova Corporation, and BioGenex Laboratories. These companies are actively engaged in developing innovative ISH products and expanding their market presence through strategic partnerships, acquisitions, and technological advancements. The market faces certain restraints, including the high cost of ISH procedures and the need for specialized expertise for accurate interpretation of results. However, the continuous development of cost-effective ISH kits and reagents, coupled with increased training and educational programs, is mitigating these challenges. The overall market outlook for ISH remains highly positive, driven by the increasing demand for accurate and timely diagnostics, personalized medicine advancements, and the continuous innovation within the field.
In-Situ Hybridization Industry Company Market Share
In-Situ Hybridization (ISH) Market Report: 2019-2033
This comprehensive report provides an in-depth analysis of the In-Situ Hybridization (ISH) market, encompassing its current dynamics, future growth trajectory, and key players. Valued at xx Billion in 2025, the ISH market is poised for significant expansion, reaching xx Billion by 2033, exhibiting a robust CAGR of xx% during the forecast period (2025-2033). This report serves as an invaluable resource for industry professionals, investors, and researchers seeking to understand and capitalize on the opportunities within this rapidly evolving market. The parent market is molecular diagnostics, and the child market is in situ hybridization.
In-Situ Hybridization Industry Market Dynamics & Structure
The In-Situ Hybridization (ISH) market is characterized by moderate concentration, with key players like Thermo Fisher Scientific, Inc., Abbott Laboratories, Inc., and Agilent Technologies, Inc. holding significant market share. Technological innovation, particularly in fluorescence in situ hybridization (FISH) and chromogenic in situ hybridization (CISH) techniques, is a primary growth driver. Regulatory frameworks, such as those governing medical device approvals, significantly influence market access and adoption. The market faces competition from alternative diagnostic methods, but the unique advantages of ISH in visualizing target molecules within their cellular context maintain its relevance. M&A activity remains moderate, reflecting strategic acquisitions to expand product portfolios and geographical reach.
- Market Concentration: Moderately concentrated, with top 5 players holding xx% market share in 2025.
- Technological Innovation: Continuous advancements in FISH and CISH technologies, including multiplex assays and automated platforms, are key drivers.
- Regulatory Landscape: Stringent regulatory approvals (e.g., FDA, CE marking) influence market entry and growth.
- Competitive Substitutes: PCR, microarray, and next-generation sequencing pose competitive pressure.
- End-User Demographics: Diagnostics laboratories, academic institutions, and CROs represent the primary end-users.
- M&A Activity: Moderate level of M&A activity, primarily focused on strategic acquisitions and expansion.
In-Situ Hybridization Industry Growth Trends & Insights
The ISH market has witnessed consistent growth driven by increasing adoption in cancer diagnostics, infectious disease research, and other applications. The market size expanded from xx Billion in 2019 to xx Billion in 2024, reflecting a CAGR of xx%. This growth is fueled by technological advancements, rising prevalence of target diseases, and increasing research funding. Consumer behavior shifts toward personalized medicine and improved diagnostics are further augmenting market demand. The adoption rate of advanced ISH techniques, particularly automated platforms, is steadily increasing, contributing to higher throughput and efficiency in laboratories. Technological disruptions, such as the development of multiplex ISH assays, are expanding the applications and capabilities of the technology.
- Market Size Evolution: Significant expansion from xx Billion in 2019 to xx Billion in 2024, with continued growth projected.
- Adoption Rates: Growing adoption in diagnostics and research, particularly in oncology and infectious diseases.
- Technological Disruptions: Advancements in multiplex ISH assays and automated platforms are driving market expansion.
- Consumer Behavior Shifts: Demand for personalized medicine and improved diagnostic accuracy is fueling market growth.
Dominant Regions, Countries, or Segments in In-Situ Hybridization Industry
North America currently holds the largest market share in the ISH industry, driven by robust research funding, advanced healthcare infrastructure, and a high prevalence of target diseases. Europe follows closely, demonstrating strong growth potential due to increasing investments in healthcare and technological advancements. Within product segments, Kits and Reagents dominate, accounting for the largest market share due to their widespread use in research and diagnostic applications. The Cancer application segment exhibits the highest growth rate, propelled by the rising incidence of various cancers and the need for accurate diagnostics. FISH remains the most widely adopted technique, however, CISH is growing in popularity due to its cost-effectiveness and simplicity. Diagnostics laboratories constitute the largest end-user segment, driven by the high volume of diagnostic testing performed.
- Key Regional Drivers: North America (strong R&D investments, advanced healthcare infrastructure); Europe (increasing healthcare expenditure, technological advancements).
- Leading Product Segment: Kits and Reagents (high volume, widespread adoption in research and diagnostics).
- Fastest-Growing Application: Cancer (rising incidence of various cancers, demand for accurate diagnostics).
- Dominant Technique: FISH (widely established, robust performance), with CISH gaining traction (cost-effective, simple).
- Largest End-User Segment: Diagnostics Laboratories (high volume of testing, established infrastructure).
In-Situ Hybridization Industry Product Landscape
The ISH product landscape is characterized by a wide range of analytical instruments, kits and reagents, software, and services catering to diverse research and diagnostic needs. Recent innovations include automated platforms for high-throughput analysis, multiplex assays for simultaneous detection of multiple targets, and advanced imaging software for data analysis. These advancements enhance the efficiency, sensitivity, and specificity of ISH techniques, leading to improved diagnostic accuracy and faster turnaround times. The key selling propositions revolve around ease of use, high sensitivity, and multiplex capabilities.
Key Drivers, Barriers & Challenges in In-Situ Hybridization Industry
Key Drivers:
- Increasing prevalence of cancer and infectious diseases.
- Growing demand for personalized medicine and improved diagnostics.
- Technological advancements in FISH and CISH techniques, including automation and multiplexing.
- Rising research funding in life sciences and healthcare.
Challenges & Restraints:
- High cost of ISH assays and equipment can limit accessibility, particularly in resource-limited settings. This results in a xx% reduction in market penetration in developing countries.
- Stringent regulatory approvals can delay market entry and increase development costs. This adds an estimated xx Billion in additional R&D costs annually.
- Competition from alternative diagnostic techniques, such as PCR and NGS, poses a significant challenge.
Emerging Opportunities in In-Situ Hybridization Industry
- Expanding applications into new disease areas, including neurodegenerative diseases and genetic disorders.
- Development of novel ISH probes targeting specific biomarkers for improved diagnostic accuracy.
- Integration of ISH with other advanced technologies, such as next-generation sequencing (NGS), for comprehensive diagnostic solutions.
- Growing demand for point-of-care diagnostics using portable and user-friendly ISH devices.
Growth Accelerators in the In-Situ Hybridization Industry
Technological breakthroughs in multiplexing, automation, and image analysis continue to drive market growth. Strategic partnerships between ISH technology providers and diagnostic companies enhance market reach and accelerate adoption. Expanding market penetration in emerging economies presents a significant opportunity for future growth.
Key Players Shaping the In-Situ Hybridization Industry Market
- Thermo Fisher Scientific, Inc.
- Abbott Laboratories, Inc.
- Agilent Technologies, Inc.
- Merck KGaA
- PerkinElmer, Inc.
- Bio-Rad Laboratories, Inc.
- F. Hoffmann-La Roche Ltd
- Danaher Corporation
- Abnova Corporation
- BioGenex Laboratories
Notable Milestones in In-Situ Hybridization Industry Sector
- September 2022: Vizgen launched Merscope Protein co-detection kits, enabling subcellular spatial multi-omics measurement. This significantly enhanced the capabilities of MERFISH experiments, leading to increased adoption.
- May 2022: Leica Biosystems launched a high-speed in situ hybridization staining platform, improving workflow efficiency and accessibility. This boosted the throughput of ISH analysis in diagnostic labs.
In-Depth In-Situ Hybridization Industry Market Outlook
The In-Situ Hybridization market is projected to experience sustained growth over the forecast period, driven by technological advancements, expanding applications, and increased healthcare spending. Strategic partnerships, acquisitions, and market expansion efforts will further shape market dynamics. The future holds immense potential for ISH in personalized medicine, early disease detection, and improved diagnostic accuracy, providing significant opportunities for growth and innovation.
In-Situ Hybridization Industry Segmentation
-
1. Product
- 1.1. Analytical Instruments
- 1.2. Kits and Reagents
- 1.3. Software and Services
- 1.4. Other Products
-
2. Technique
- 2.1. Fluoresence In Situ Hybridization (FISH)
- 2.2. Chromogenic In Situ hybridization (CISH)
-
3. Application
- 3.1. Cancer
- 3.2. Infectious Diseases
- 3.3. Others
-
4. End User
- 4.1. Diagnostics Laboratories
- 4.2. Academic and Research Institutions
- 4.3. Contract Research Organizations (CROs)
In-Situ Hybridization Industry Segmentation By Geography
-
1. North America
- 1.1. United States
- 1.2. Canada
- 1.3. Mexico
-
2. Europe
- 2.1. Germany
- 2.2. United Kingdom
- 2.3. France
- 2.4. Italy
- 2.5. Spain
- 2.6. Rest of Europe
-
3. Asia Pacific
- 3.1. China
- 3.2. Japan
- 3.3. India
- 3.4. Australia
- 3.5. South Korea
- 3.6. Rest of Asia Pacific
-
4. Middle East and Africa
- 4.1. GCC
- 4.2. South Africa
- 4.3. Rest of Middle East and Africa
-
5. South America
- 5.1. Brazil
- 5.2. Argentina
- 5.3. Rest of South America
In-Situ Hybridization Industry Regional Market Share
Geographic Coverage of In-Situ Hybridization Industry
In-Situ Hybridization Industry REPORT HIGHLIGHTS
| Aspects | Details |
|---|---|
| Study Period | 2020-2034 |
| Base Year | 2025 |
| Estimated Year | 2026 |
| Forecast Period | 2026-2034 |
| Historical Period | 2020-2025 |
| Growth Rate | CAGR of 7.20% from 2020-2034 |
| Segmentation |
|
Table of Contents
- 1. Introduction
- 1.1. Research Scope
- 1.2. Market Segmentation
- 1.3. Research Objective
- 1.4. Definitions and Assumptions
- 2. Executive Summary
- 2.1. Market Snapshot
- 3. Market Dynamics
- 3.1. Market Drivers
- 3.2. Market Restrains
- 3.3. Market Trends
- 3.4. Market Opportunities
- 4. Market Factor Analysis
- 4.1. Porters Five Forces
- 4.1.1. Bargaining Power of Suppliers
- 4.1.2. Bargaining Power of Buyers
- 4.1.3. Threat of New Entrants
- 4.1.4. Threat of Substitutes
- 4.1.5. Competitive Rivalry
- 4.2. PESTEL analysis
- 4.3. BCG Analysis
- 4.3.1. Stars (High Growth, High Market Share)
- 4.3.2. Cash Cows (Low Growth, High Market Share)
- 4.3.3. Question Mark (High Growth, Low Market Share)
- 4.3.4. Dogs (Low Growth, Low Market Share)
- 4.4. Ansoff Matrix Analysis
- 4.5. Supply Chain Analysis
- 4.6. Regulatory Landscape
- 4.7. Current Market Potential and Opportunity Assessment (TAM–SAM–SOM Framework)
- 4.8. VDR Analyst Note
- 4.1. Porters Five Forces
- 5. Market Analysis, Insights and Forecast 2021-2033
- 5.1. Market Analysis, Insights and Forecast - by Product
- 5.1.1. Analytical Instruments
- 5.1.2. Kits and Reagents
- 5.1.3. Software and Services
- 5.1.4. Other Products
- 5.2. Market Analysis, Insights and Forecast - by Technique
- 5.2.1. Fluoresence In Situ Hybridization (FISH)
- 5.2.2. Chromogenic In Situ hybridization (CISH)
- 5.3. Market Analysis, Insights and Forecast - by Application
- 5.3.1. Cancer
- 5.3.2. Infectious Diseases
- 5.3.3. Others
- 5.4. Market Analysis, Insights and Forecast - by End User
- 5.4.1. Diagnostics Laboratories
- 5.4.2. Academic and Research Institutions
- 5.4.3. Contract Research Organizations (CROs)
- 5.5. Market Analysis, Insights and Forecast - by Region
- 5.5.1. North America
- 5.5.2. Europe
- 5.5.3. Asia Pacific
- 5.5.4. Middle East and Africa
- 5.5.5. South America
- 5.1. Market Analysis, Insights and Forecast - by Product
- 6. Global In-Situ Hybridization Industry Analysis, Insights and Forecast, 2021-2033
- 6.1. Market Analysis, Insights and Forecast - by Product
- 6.1.1. Analytical Instruments
- 6.1.2. Kits and Reagents
- 6.1.3. Software and Services
- 6.1.4. Other Products
- 6.2. Market Analysis, Insights and Forecast - by Technique
- 6.2.1. Fluoresence In Situ Hybridization (FISH)
- 6.2.2. Chromogenic In Situ hybridization (CISH)
- 6.3. Market Analysis, Insights and Forecast - by Application
- 6.3.1. Cancer
- 6.3.2. Infectious Diseases
- 6.3.3. Others
- 6.4. Market Analysis, Insights and Forecast - by End User
- 6.4.1. Diagnostics Laboratories
- 6.4.2. Academic and Research Institutions
- 6.4.3. Contract Research Organizations (CROs)
- 6.1. Market Analysis, Insights and Forecast - by Product
- 7. North America In-Situ Hybridization Industry Analysis, Insights and Forecast, 2021-2033
- 7.1. Market Analysis, Insights and Forecast - by Product
- 7.1.1. Analytical Instruments
- 7.1.2. Kits and Reagents
- 7.1.3. Software and Services
- 7.1.4. Other Products
- 7.2. Market Analysis, Insights and Forecast - by Technique
- 7.2.1. Fluoresence In Situ Hybridization (FISH)
- 7.2.2. Chromogenic In Situ hybridization (CISH)
- 7.3. Market Analysis, Insights and Forecast - by Application
- 7.3.1. Cancer
- 7.3.2. Infectious Diseases
- 7.3.3. Others
- 7.4. Market Analysis, Insights and Forecast - by End User
- 7.4.1. Diagnostics Laboratories
- 7.4.2. Academic and Research Institutions
- 7.4.3. Contract Research Organizations (CROs)
- 7.1. Market Analysis, Insights and Forecast - by Product
- 8. Europe In-Situ Hybridization Industry Analysis, Insights and Forecast, 2021-2033
- 8.1. Market Analysis, Insights and Forecast - by Product
- 8.1.1. Analytical Instruments
- 8.1.2. Kits and Reagents
- 8.1.3. Software and Services
- 8.1.4. Other Products
- 8.2. Market Analysis, Insights and Forecast - by Technique
- 8.2.1. Fluoresence In Situ Hybridization (FISH)
- 8.2.2. Chromogenic In Situ hybridization (CISH)
- 8.3. Market Analysis, Insights and Forecast - by Application
- 8.3.1. Cancer
- 8.3.2. Infectious Diseases
- 8.3.3. Others
- 8.4. Market Analysis, Insights and Forecast - by End User
- 8.4.1. Diagnostics Laboratories
- 8.4.2. Academic and Research Institutions
- 8.4.3. Contract Research Organizations (CROs)
- 8.1. Market Analysis, Insights and Forecast - by Product
- 9. Asia Pacific In-Situ Hybridization Industry Analysis, Insights and Forecast, 2021-2033
- 9.1. Market Analysis, Insights and Forecast - by Product
- 9.1.1. Analytical Instruments
- 9.1.2. Kits and Reagents
- 9.1.3. Software and Services
- 9.1.4. Other Products
- 9.2. Market Analysis, Insights and Forecast - by Technique
- 9.2.1. Fluoresence In Situ Hybridization (FISH)
- 9.2.2. Chromogenic In Situ hybridization (CISH)
- 9.3. Market Analysis, Insights and Forecast - by Application
- 9.3.1. Cancer
- 9.3.2. Infectious Diseases
- 9.3.3. Others
- 9.4. Market Analysis, Insights and Forecast - by End User
- 9.4.1. Diagnostics Laboratories
- 9.4.2. Academic and Research Institutions
- 9.4.3. Contract Research Organizations (CROs)
- 9.1. Market Analysis, Insights and Forecast - by Product
- 10. Middle East and Africa In-Situ Hybridization Industry Analysis, Insights and Forecast, 2021-2033
- 10.1. Market Analysis, Insights and Forecast - by Product
- 10.1.1. Analytical Instruments
- 10.1.2. Kits and Reagents
- 10.1.3. Software and Services
- 10.1.4. Other Products
- 10.2. Market Analysis, Insights and Forecast - by Technique
- 10.2.1. Fluoresence In Situ Hybridization (FISH)
- 10.2.2. Chromogenic In Situ hybridization (CISH)
- 10.3. Market Analysis, Insights and Forecast - by Application
- 10.3.1. Cancer
- 10.3.2. Infectious Diseases
- 10.3.3. Others
- 10.4. Market Analysis, Insights and Forecast - by End User
- 10.4.1. Diagnostics Laboratories
- 10.4.2. Academic and Research Institutions
- 10.4.3. Contract Research Organizations (CROs)
- 10.1. Market Analysis, Insights and Forecast - by Product
- 11. South America In-Situ Hybridization Industry Analysis, Insights and Forecast, 2021-2033
- 11.1. Market Analysis, Insights and Forecast - by Product
- 11.1.1. Analytical Instruments
- 11.1.2. Kits and Reagents
- 11.1.3. Software and Services
- 11.1.4. Other Products
- 11.2. Market Analysis, Insights and Forecast - by Technique
- 11.2.1. Fluoresence In Situ Hybridization (FISH)
- 11.2.2. Chromogenic In Situ hybridization (CISH)
- 11.3. Market Analysis, Insights and Forecast - by Application
- 11.3.1. Cancer
- 11.3.2. Infectious Diseases
- 11.3.3. Others
- 11.4. Market Analysis, Insights and Forecast - by End User
- 11.4.1. Diagnostics Laboratories
- 11.4.2. Academic and Research Institutions
- 11.4.3. Contract Research Organizations (CROs)
- 11.1. Market Analysis, Insights and Forecast - by Product
- 12. Competitive Analysis
- 12.1. Company Profiles
- 12.1.1 Thermo Fisher Scientific Inc.
- 12.1.1.1. Company Overview
- 12.1.1.2. Products
- 12.1.1.3. Company Financials
- 12.1.1.4. SWOT Analysis
- 12.1.2 Abbott Laboratories Inc.
- 12.1.2.1. Company Overview
- 12.1.2.2. Products
- 12.1.2.3. Company Financials
- 12.1.2.4. SWOT Analysis
- 12.1.3 Agilent Technologies Inc.
- 12.1.3.1. Company Overview
- 12.1.3.2. Products
- 12.1.3.3. Company Financials
- 12.1.3.4. SWOT Analysis
- 12.1.4 Merck KGaA
- 12.1.4.1. Company Overview
- 12.1.4.2. Products
- 12.1.4.3. Company Financials
- 12.1.4.4. SWOT Analysis
- 12.1.5 PerkinElmer Inc.
- 12.1.5.1. Company Overview
- 12.1.5.2. Products
- 12.1.5.3. Company Financials
- 12.1.5.4. SWOT Analysis
- 12.1.6 Bio-Rad Laboratories Inc.
- 12.1.6.1. Company Overview
- 12.1.6.2. Products
- 12.1.6.3. Company Financials
- 12.1.6.4. SWOT Analysis
- 12.1.7 F. Hoffmann-La Roche Ltd
- 12.1.7.1. Company Overview
- 12.1.7.2. Products
- 12.1.7.3. Company Financials
- 12.1.7.4. SWOT Analysis
- 12.1.8 Danaher Corporation
- 12.1.8.1. Company Overview
- 12.1.8.2. Products
- 12.1.8.3. Company Financials
- 12.1.8.4. SWOT Analysis
- 12.1.9 Abnova Corporation
- 12.1.9.1. Company Overview
- 12.1.9.2. Products
- 12.1.9.3. Company Financials
- 12.1.9.4. SWOT Analysis
- 12.1.10 BioGenex Laboratories
- 12.1.10.1. Company Overview
- 12.1.10.2. Products
- 12.1.10.3. Company Financials
- 12.1.10.4. SWOT Analysis
- 12.1.1 Thermo Fisher Scientific Inc.
- 12.2. Market Entropy
- 12.2.1 Company's Key Areas Served
- 12.2.2 Recent Developments
- 12.3. Company Market Share Analysis 2025
- 12.3.1 Top 5 Companies Market Share Analysis
- 12.3.2 Top 3 Companies Market Share Analysis
- 12.4. List of Potential Customers
- 13. Research Methodology
List of Figures
- Figure 1: Global In-Situ Hybridization Industry Revenue Breakdown (Billion, %) by Region 2025 & 2033
- Figure 2: North America In-Situ Hybridization Industry Revenue (Billion), by Product 2025 & 2033
- Figure 3: North America In-Situ Hybridization Industry Revenue Share (%), by Product 2025 & 2033
- Figure 4: North America In-Situ Hybridization Industry Revenue (Billion), by Technique 2025 & 2033
- Figure 5: North America In-Situ Hybridization Industry Revenue Share (%), by Technique 2025 & 2033
- Figure 6: North America In-Situ Hybridization Industry Revenue (Billion), by Application 2025 & 2033
- Figure 7: North America In-Situ Hybridization Industry Revenue Share (%), by Application 2025 & 2033
- Figure 8: North America In-Situ Hybridization Industry Revenue (Billion), by End User 2025 & 2033
- Figure 9: North America In-Situ Hybridization Industry Revenue Share (%), by End User 2025 & 2033
- Figure 10: North America In-Situ Hybridization Industry Revenue (Billion), by Country 2025 & 2033
- Figure 11: North America In-Situ Hybridization Industry Revenue Share (%), by Country 2025 & 2033
- Figure 12: Europe In-Situ Hybridization Industry Revenue (Billion), by Product 2025 & 2033
- Figure 13: Europe In-Situ Hybridization Industry Revenue Share (%), by Product 2025 & 2033
- Figure 14: Europe In-Situ Hybridization Industry Revenue (Billion), by Technique 2025 & 2033
- Figure 15: Europe In-Situ Hybridization Industry Revenue Share (%), by Technique 2025 & 2033
- Figure 16: Europe In-Situ Hybridization Industry Revenue (Billion), by Application 2025 & 2033
- Figure 17: Europe In-Situ Hybridization Industry Revenue Share (%), by Application 2025 & 2033
- Figure 18: Europe In-Situ Hybridization Industry Revenue (Billion), by End User 2025 & 2033
- Figure 19: Europe In-Situ Hybridization Industry Revenue Share (%), by End User 2025 & 2033
- Figure 20: Europe In-Situ Hybridization Industry Revenue (Billion), by Country 2025 & 2033
- Figure 21: Europe In-Situ Hybridization Industry Revenue Share (%), by Country 2025 & 2033
- Figure 22: Asia Pacific In-Situ Hybridization Industry Revenue (Billion), by Product 2025 & 2033
- Figure 23: Asia Pacific In-Situ Hybridization Industry Revenue Share (%), by Product 2025 & 2033
- Figure 24: Asia Pacific In-Situ Hybridization Industry Revenue (Billion), by Technique 2025 & 2033
- Figure 25: Asia Pacific In-Situ Hybridization Industry Revenue Share (%), by Technique 2025 & 2033
- Figure 26: Asia Pacific In-Situ Hybridization Industry Revenue (Billion), by Application 2025 & 2033
- Figure 27: Asia Pacific In-Situ Hybridization Industry Revenue Share (%), by Application 2025 & 2033
- Figure 28: Asia Pacific In-Situ Hybridization Industry Revenue (Billion), by End User 2025 & 2033
- Figure 29: Asia Pacific In-Situ Hybridization Industry Revenue Share (%), by End User 2025 & 2033
- Figure 30: Asia Pacific In-Situ Hybridization Industry Revenue (Billion), by Country 2025 & 2033
- Figure 31: Asia Pacific In-Situ Hybridization Industry Revenue Share (%), by Country 2025 & 2033
- Figure 32: Middle East and Africa In-Situ Hybridization Industry Revenue (Billion), by Product 2025 & 2033
- Figure 33: Middle East and Africa In-Situ Hybridization Industry Revenue Share (%), by Product 2025 & 2033
- Figure 34: Middle East and Africa In-Situ Hybridization Industry Revenue (Billion), by Technique 2025 & 2033
- Figure 35: Middle East and Africa In-Situ Hybridization Industry Revenue Share (%), by Technique 2025 & 2033
- Figure 36: Middle East and Africa In-Situ Hybridization Industry Revenue (Billion), by Application 2025 & 2033
- Figure 37: Middle East and Africa In-Situ Hybridization Industry Revenue Share (%), by Application 2025 & 2033
- Figure 38: Middle East and Africa In-Situ Hybridization Industry Revenue (Billion), by End User 2025 & 2033
- Figure 39: Middle East and Africa In-Situ Hybridization Industry Revenue Share (%), by End User 2025 & 2033
- Figure 40: Middle East and Africa In-Situ Hybridization Industry Revenue (Billion), by Country 2025 & 2033
- Figure 41: Middle East and Africa In-Situ Hybridization Industry Revenue Share (%), by Country 2025 & 2033
- Figure 42: South America In-Situ Hybridization Industry Revenue (Billion), by Product 2025 & 2033
- Figure 43: South America In-Situ Hybridization Industry Revenue Share (%), by Product 2025 & 2033
- Figure 44: South America In-Situ Hybridization Industry Revenue (Billion), by Technique 2025 & 2033
- Figure 45: South America In-Situ Hybridization Industry Revenue Share (%), by Technique 2025 & 2033
- Figure 46: South America In-Situ Hybridization Industry Revenue (Billion), by Application 2025 & 2033
- Figure 47: South America In-Situ Hybridization Industry Revenue Share (%), by Application 2025 & 2033
- Figure 48: South America In-Situ Hybridization Industry Revenue (Billion), by End User 2025 & 2033
- Figure 49: South America In-Situ Hybridization Industry Revenue Share (%), by End User 2025 & 2033
- Figure 50: South America In-Situ Hybridization Industry Revenue (Billion), by Country 2025 & 2033
- Figure 51: South America In-Situ Hybridization Industry Revenue Share (%), by Country 2025 & 2033
List of Tables
- Table 1: Global In-Situ Hybridization Industry Revenue Billion Forecast, by Product 2020 & 2033
- Table 2: Global In-Situ Hybridization Industry Revenue Billion Forecast, by Technique 2020 & 2033
- Table 3: Global In-Situ Hybridization Industry Revenue Billion Forecast, by Application 2020 & 2033
- Table 4: Global In-Situ Hybridization Industry Revenue Billion Forecast, by End User 2020 & 2033
- Table 5: Global In-Situ Hybridization Industry Revenue Billion Forecast, by Region 2020 & 2033
- Table 6: Global In-Situ Hybridization Industry Revenue Billion Forecast, by Product 2020 & 2033
- Table 7: Global In-Situ Hybridization Industry Revenue Billion Forecast, by Technique 2020 & 2033
- Table 8: Global In-Situ Hybridization Industry Revenue Billion Forecast, by Application 2020 & 2033
- Table 9: Global In-Situ Hybridization Industry Revenue Billion Forecast, by End User 2020 & 2033
- Table 10: Global In-Situ Hybridization Industry Revenue Billion Forecast, by Country 2020 & 2033
- Table 11: United States In-Situ Hybridization Industry Revenue (Billion) Forecast, by Application 2020 & 2033
- Table 12: Canada In-Situ Hybridization Industry Revenue (Billion) Forecast, by Application 2020 & 2033
- Table 13: Mexico In-Situ Hybridization Industry Revenue (Billion) Forecast, by Application 2020 & 2033
- Table 14: Global In-Situ Hybridization Industry Revenue Billion Forecast, by Product 2020 & 2033
- Table 15: Global In-Situ Hybridization Industry Revenue Billion Forecast, by Technique 2020 & 2033
- Table 16: Global In-Situ Hybridization Industry Revenue Billion Forecast, by Application 2020 & 2033
- Table 17: Global In-Situ Hybridization Industry Revenue Billion Forecast, by End User 2020 & 2033
- Table 18: Global In-Situ Hybridization Industry Revenue Billion Forecast, by Country 2020 & 2033
- Table 19: Germany In-Situ Hybridization Industry Revenue (Billion) Forecast, by Application 2020 & 2033
- Table 20: United Kingdom In-Situ Hybridization Industry Revenue (Billion) Forecast, by Application 2020 & 2033
- Table 21: France In-Situ Hybridization Industry Revenue (Billion) Forecast, by Application 2020 & 2033
- Table 22: Italy In-Situ Hybridization Industry Revenue (Billion) Forecast, by Application 2020 & 2033
- Table 23: Spain In-Situ Hybridization Industry Revenue (Billion) Forecast, by Application 2020 & 2033
- Table 24: Rest of Europe In-Situ Hybridization Industry Revenue (Billion) Forecast, by Application 2020 & 2033
- Table 25: Global In-Situ Hybridization Industry Revenue Billion Forecast, by Product 2020 & 2033
- Table 26: Global In-Situ Hybridization Industry Revenue Billion Forecast, by Technique 2020 & 2033
- Table 27: Global In-Situ Hybridization Industry Revenue Billion Forecast, by Application 2020 & 2033
- Table 28: Global In-Situ Hybridization Industry Revenue Billion Forecast, by End User 2020 & 2033
- Table 29: Global In-Situ Hybridization Industry Revenue Billion Forecast, by Country 2020 & 2033
- Table 30: China In-Situ Hybridization Industry Revenue (Billion) Forecast, by Application 2020 & 2033
- Table 31: Japan In-Situ Hybridization Industry Revenue (Billion) Forecast, by Application 2020 & 2033
- Table 32: India In-Situ Hybridization Industry Revenue (Billion) Forecast, by Application 2020 & 2033
- Table 33: Australia In-Situ Hybridization Industry Revenue (Billion) Forecast, by Application 2020 & 2033
- Table 34: South Korea In-Situ Hybridization Industry Revenue (Billion) Forecast, by Application 2020 & 2033
- Table 35: Rest of Asia Pacific In-Situ Hybridization Industry Revenue (Billion) Forecast, by Application 2020 & 2033
- Table 36: Global In-Situ Hybridization Industry Revenue Billion Forecast, by Product 2020 & 2033
- Table 37: Global In-Situ Hybridization Industry Revenue Billion Forecast, by Technique 2020 & 2033
- Table 38: Global In-Situ Hybridization Industry Revenue Billion Forecast, by Application 2020 & 2033
- Table 39: Global In-Situ Hybridization Industry Revenue Billion Forecast, by End User 2020 & 2033
- Table 40: Global In-Situ Hybridization Industry Revenue Billion Forecast, by Country 2020 & 2033
- Table 41: GCC In-Situ Hybridization Industry Revenue (Billion) Forecast, by Application 2020 & 2033
- Table 42: South Africa In-Situ Hybridization Industry Revenue (Billion) Forecast, by Application 2020 & 2033
- Table 43: Rest of Middle East and Africa In-Situ Hybridization Industry Revenue (Billion) Forecast, by Application 2020 & 2033
- Table 44: Global In-Situ Hybridization Industry Revenue Billion Forecast, by Product 2020 & 2033
- Table 45: Global In-Situ Hybridization Industry Revenue Billion Forecast, by Technique 2020 & 2033
- Table 46: Global In-Situ Hybridization Industry Revenue Billion Forecast, by Application 2020 & 2033
- Table 47: Global In-Situ Hybridization Industry Revenue Billion Forecast, by End User 2020 & 2033
- Table 48: Global In-Situ Hybridization Industry Revenue Billion Forecast, by Country 2020 & 2033
- Table 49: Brazil In-Situ Hybridization Industry Revenue (Billion) Forecast, by Application 2020 & 2033
- Table 50: Argentina In-Situ Hybridization Industry Revenue (Billion) Forecast, by Application 2020 & 2033
- Table 51: Rest of South America In-Situ Hybridization Industry Revenue (Billion) Forecast, by Application 2020 & 2033
Frequently Asked Questions
1. What is the projected Compound Annual Growth Rate (CAGR) of the In-Situ Hybridization Industry?
The projected CAGR is approximately 7.20%.
2. Which companies are prominent players in the In-Situ Hybridization Industry?
Key companies in the market include Thermo Fisher Scientific, Inc., Abbott Laboratories, Inc., Agilent Technologies, Inc., Merck KGaA, PerkinElmer, Inc., Bio-Rad Laboratories, Inc., F. Hoffmann-La Roche Ltd, Danaher Corporation, Abnova Corporation, BioGenex Laboratories.
3. What are the main segments of the In-Situ Hybridization Industry?
The market segments include Product, Technique, Application, End User.
4. Can you provide details about the market size?
The market size is estimated to be USD 1.5 Billion as of 2022.
5. What are some drivers contributing to market growth?
Increasing Prevalence of Cancer. Infectious Diseases and Genetic Disorders; Advancements in Diagnostic Tools; Rising Awareness on Cancer Therapeutics.
6. What are the notable trends driving market growth?
The Fluorescence In Situ Hybridization (FISH) is Expected to Witness a Healthy Growth in the Market Over the Forecast Period.
7. Are there any restraints impacting market growth?
Lack of Skilled Personnel.
8. Can you provide examples of recent developments in the market?
September 2022: Vizgen launched Merscope Protein co-detection kits. This kit enables the measurement of subcellular spatial multi-omics by co-detecting RNA and proteins during standard Multiplexed Error-Robust Fluorescence in Situ Hybridization (MERFISH) experiment.
9. What pricing options are available for accessing the report?
Pricing options include single-user, multi-user, and enterprise licenses priced at USD 4750, USD 5250, and USD 8750 respectively.
10. Is the market size provided in terms of value or volume?
The market size is provided in terms of value, measured in Billion.
11. Are there any specific market keywords associated with the report?
Yes, the market keyword associated with the report is "In-Situ Hybridization Industry," which aids in identifying and referencing the specific market segment covered.
12. How do I determine which pricing option suits my needs best?
The pricing options vary based on user requirements and access needs. Individual users may opt for single-user licenses, while businesses requiring broader access may choose multi-user or enterprise licenses for cost-effective access to the report.
13. Are there any additional resources or data provided in the In-Situ Hybridization Industry report?
While the report offers comprehensive insights, it's advisable to review the specific contents or supplementary materials provided to ascertain if additional resources or data are available.
14. How can I stay updated on further developments or reports in the In-Situ Hybridization Industry?
To stay informed about further developments, trends, and reports in the In-Situ Hybridization Industry, consider subscribing to industry newsletters, following relevant companies and organizations, or regularly checking reputable industry news sources and publications.
Methodology
Step 1 - Identification of Relevant Samples Size from Population Database


Step 2 - Approaches for Defining Global Market Size (Value, Volume* & Price*)

Note*: In applicable scenarios
Step 3 - Data Sources
Primary Research
- Web Analytics
- Survey Reports
- Research Institute
- Latest Research Reports
- Opinion Leaders
Secondary Research
- Annual Reports
- White Paper
- Latest Press Release
- Industry Association
- Paid Database
- Investor Presentations

Step 4 - Data Triangulation
Involves using different sources of information in order to increase the validity of a study
These sources are likely to be stakeholders in a program - participants, other researchers, program staff, other community members, and so on.
Then we put all data in single framework & apply various statistical tools to find out the dynamic on the market.
During the analysis stage, feedback from the stakeholder groups would be compared to determine areas of agreement as well as areas of divergence