
Key Insights
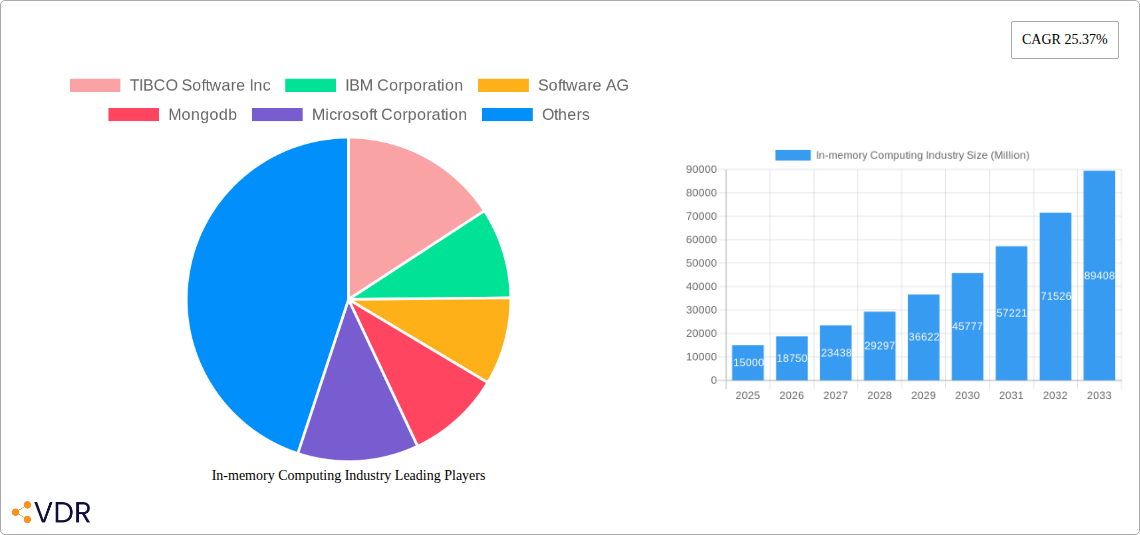
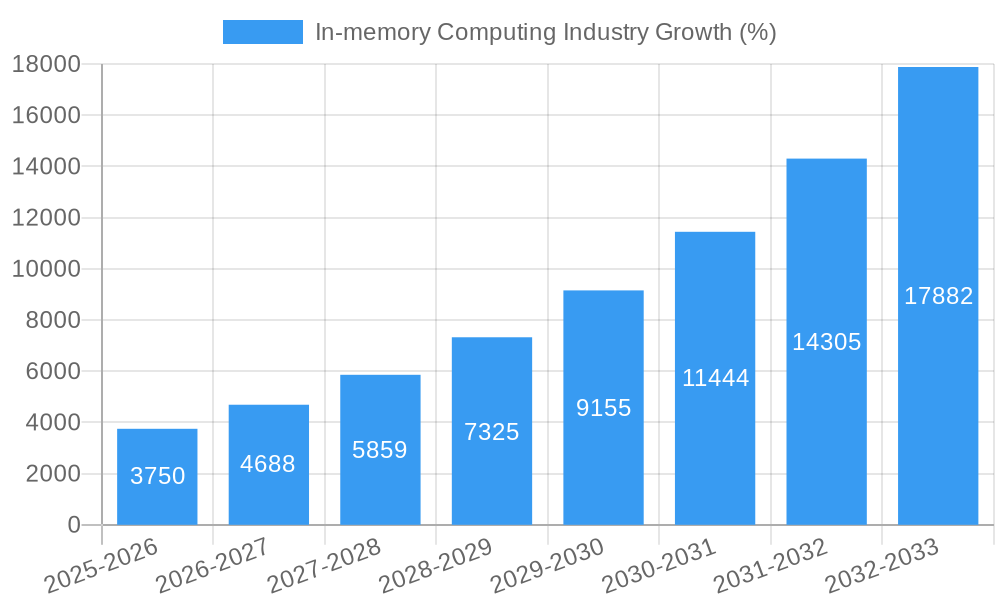
The in-memory computing market is experiencing robust growth, fueled by the increasing demand for real-time data processing and analytics across diverse sectors. The market's Compound Annual Growth Rate (CAGR) of 25.37% from 2019 to 2024 indicates a significant upward trajectory, driven by factors such as the proliferation of big data, the rise of cloud computing, and the growing adoption of advanced analytics solutions. Key industry drivers include the need for faster transaction processing speeds, improved operational efficiency, enhanced decision-making capabilities, and the ability to handle massive data volumes with low latency. The BFSI (Banking, Financial Services, and Insurance) sector, along with healthcare and IT & Telecom, are major adopters, leveraging in-memory computing for fraud detection, risk management, personalized medicine, and network optimization. While the market faces some restraints, such as high initial investment costs and the need for specialized skills, the overall growth outlook remains positive. The market segmentation by component (in-memory data management and in-memory applications) reflects the diverse functionalities offered, catering to various business needs and technological preferences. The continued innovation in database technologies and the expanding application of in-memory solutions across new verticals suggest a sustained period of market expansion.
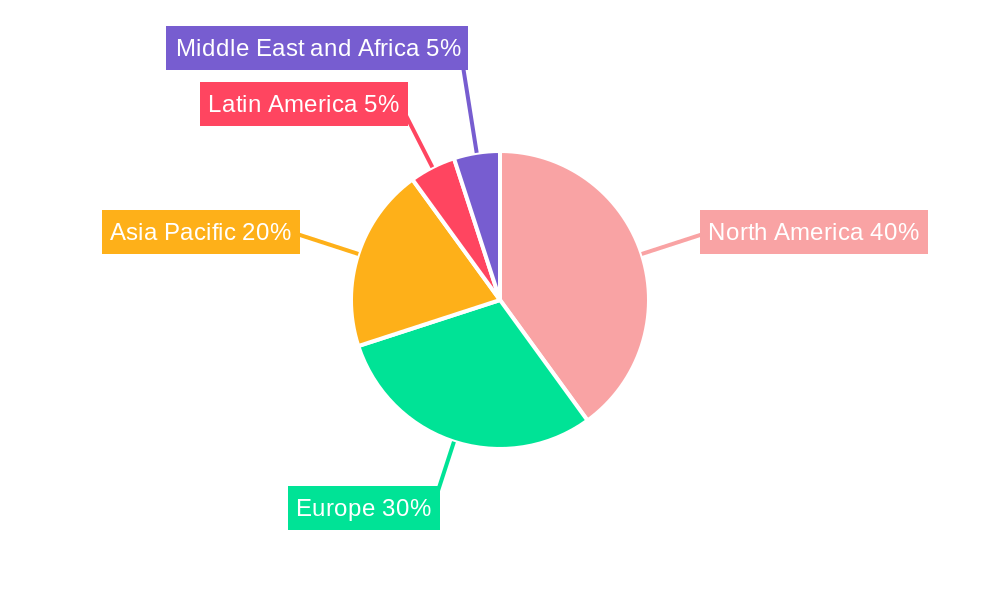
The competitive landscape is dynamic, featuring established players like IBM, Microsoft, and Oracle alongside specialized providers like TIBCO, MongoDB, and DataStax. These companies are continually enhancing their offerings to meet evolving market demands, driving innovation in areas such as performance optimization, scalability, and security. Geographical expansion is another significant trend, with North America currently holding a substantial market share, followed by Europe and Asia Pacific. However, the Asia Pacific region is predicted to exhibit faster growth rates in the coming years, driven by increasing digitalization and technological advancements across various countries. The forecast period of 2025-2033 suggests continued high growth, with the market likely surpassing significant milestones in terms of value and adoption across industries. This strong outlook solidifies in-memory computing as a critical technology for organizations seeking competitive advantage in today's data-driven environment.
In-Memory Computing Industry Market Report: 2019-2033
This comprehensive report provides a detailed analysis of the In-memory Computing market, encompassing market dynamics, growth trends, regional dominance, product landscape, key players, and future outlook. The study period spans from 2019 to 2033, with 2025 as the base and estimated year. The forecast period covers 2025-2033, and the historical period encompasses 2019-2024. The report meticulously examines the parent market (Data Management Software) and child markets (In-memory Data Management, In-memory Applications) across key end-user verticals, including BFSI, Healthcare, IT & Telecom, and Government. The total market size is projected to reach xx Million by 2033.
In-memory Computing Industry Market Dynamics & Structure
This section delves into the competitive landscape of the In-memory Computing market, analyzing market concentration, technological innovation, regulatory influences, competitive substitutes, and market trends including M&A activity. The market exhibits a moderately concentrated structure with key players holding significant shares. However, the entry of new players with innovative solutions is continually shaping the competitive dynamics.
- Market Concentration: The top 5 players hold an estimated xx% market share in 2025. This is expected to slightly decrease to xx% by 2033 due to increased competition.
- Technological Innovation: Continuous advancements in processor technology, memory architectures (e.g., persistent memory), and data processing algorithms are driving market growth.
- Regulatory Frameworks: Data privacy regulations (GDPR, CCPA) influence adoption strategies and security solutions within the in-memory computing space.
- Competitive Substitutes: Traditional database management systems (DBMS) pose some competition, but the superior performance of in-memory solutions in real-time applications is a significant differentiator.
- End-User Demographics: The demand for real-time analytics and high-speed data processing is driving adoption across various verticals, especially in BFSI and Healthcare.
- M&A Trends: The number of M&A deals in the in-memory computing sector averaged xx per year during 2019-2024, indicating a consolidation trend among players.
In-memory Computing Industry Growth Trends & Insights
The in-memory computing market has witnessed robust growth over the past years, fueled by increasing demand for real-time analytics and the need for faster processing of large datasets. Adoption rates across various industries are accelerating, particularly in sectors like BFSI and healthcare where real-time insights are critical. Technological advancements, such as advancements in persistent memory and improved algorithms, are driving further market expansion. The market is anticipated to maintain a strong Compound Annual Growth Rate (CAGR) of xx% during the forecast period (2025-2033), reaching xx Million by 2033. This growth is primarily attributed to the increasing adoption of cloud-based in-memory computing solutions and the rising need for real-time business intelligence.
Dominant Regions, Countries, or Segments in In-memory Computing Industry
North America currently holds the largest market share in the in-memory computing industry, driven by strong technological advancements and early adoption by enterprises. However, the Asia-Pacific region is anticipated to witness significant growth in the coming years, fueled by increasing digitalization and rising investments in IT infrastructure.
By Component:
- In-memory Data Management: This segment is projected to dominate the market due to the increasing demand for efficient data management solutions capable of handling large volumes of data in real time.
- In-memory Application: This segment shows strong growth potential driven by the rising adoption of real-time applications across various industries.
By End-user Vertical:
- BFSI: This sector is a major driver of market growth due to the critical need for real-time fraud detection, risk management, and customer relationship management.
- Healthcare: The demand for real-time patient monitoring and predictive analytics in healthcare is boosting the adoption of in-memory computing solutions.
- IT & Telecom: This sector leverages in-memory computing for network optimization, real-time billing, and customer support.
Key Drivers for regional growth include favorable government policies promoting digital transformation and robust IT infrastructure investments.
In-memory Computing Industry Product Landscape
In-memory computing products are evolving rapidly, incorporating advancements like persistent memory and optimized algorithms for improved performance and scalability. Solutions are offered as both standalone products and integrated components within broader data management platforms. Key features driving adoption include enhanced speed, real-time analytics capabilities, and improved data security features. Unique selling propositions center around ease of integration with existing systems, scalability to accommodate large datasets, and robust security features.
Key Drivers, Barriers & Challenges in In-memory Computing Industry
Key Drivers:
- The increasing demand for real-time analytics and high-speed data processing is the primary driver.
- Advancements in processor technology and memory architectures are enabling more efficient and scalable solutions.
- Growing adoption of cloud-based services is further fueling market expansion.
Key Barriers & Challenges:
- High initial investment costs can hinder adoption, especially for smaller organizations.
- Data security and privacy concerns can pose a challenge, especially with sensitive data.
- Lack of skilled professionals familiar with in-memory computing technologies can limit implementation.
Emerging Opportunities in In-memory Computing Industry
Emerging trends indicate significant opportunities in areas such as edge computing, real-time IoT analytics, and advanced analytics applications. The expansion into untapped markets, particularly in developing economies, presents significant growth potential. The increasing demand for AI and machine learning applications also creates further opportunities for in-memory computing to power faster processing and decision-making.
Growth Accelerators in the In-memory Computing Industry
Technological breakthroughs in persistent memory, improved algorithms, and optimized hardware are key growth catalysts. Strategic partnerships between in-memory computing vendors and cloud service providers are also driving market expansion. Moreover, the increasing focus on digital transformation initiatives across various industries is creating a favorable environment for growth.
Key Players Shaping the In-memory Computing Market
- TIBCO Software Inc
- IBM Corporation
- Software AG
- Mongodb
- Microsoft Corporation
- Datastax Inc
- Altibase Corporation
- SAS Institute
- Gigaspaces Technologies Inc
- Oracle Corporation
- GridGain Systems inc
- Hazelcast Inc
- SAP SE
Notable Milestones in In-memory Computing Industry Sector
- 2020: Introduction of persistent memory-optimized in-memory databases by multiple vendors.
- 2022: Several key acquisitions and strategic partnerships to expand product portfolios and market reach.
- 2023: Launch of several cloud-native in-memory computing platforms.
In-Depth In-memory Computing Industry Market Outlook
The in-memory computing market is poised for continued strong growth, driven by increasing adoption across diverse industries and ongoing technological advancements. Opportunities lie in developing tailored solutions for specific vertical applications and expanding into untapped markets. Strategic partnerships and investments in research and development will be crucial for maintaining competitiveness in this dynamic market. The future potential is substantial, promising significant revenue growth and market share expansion for key players.
In-memory Computing Industry Segmentation
-
1. Component
- 1.1. In-memory Data Management
- 1.2. In-memory Application
-
2. End-user Vertical
- 2.1. BFSI
- 2.2. Healthcare
- 2.3. IT & Telecom
- 2.4. Government
- 2.5. Other End-user Verticals
In-memory Computing Industry Segmentation By Geography
- 1. North America
- 2. Europe
- 3. Asia Pacific
- 4. Latin America
- 5. Middle East and Africa
In-memory Computing Industry REPORT HIGHLIGHTS
| Aspects | Details |
|---|---|
| Study Period | 2019-2033 |
| Base Year | 2024 |
| Estimated Year | 2025 |
| Forecast Period | 2025-2033 |
| Historical Period | 2019-2024 |
| Growth Rate | CAGR of 25.37% from 2019-2033 |
| Segmentation |
|
Table of Contents
- 1. Introduction
- 1.1. Research Scope
- 1.2. Market Segmentation
- 1.3. Research Methodology
- 1.4. Definitions and Assumptions
- 2. Executive Summary
- 2.1. Introduction
- 3. Market Dynamics
- 3.1. Introduction
- 3.2. Market Drivers
- 3.2.1. ; Explosion of Big Data; Growing Need for Rapid Data Processing
- 3.3. Market Restrains
- 3.3.1. ; Concerns Regarding Data Security and Data Breaching Globally
- 3.4. Market Trends
- 3.4.1. In-memory Data Management to Hold Significant Share
- 4. Market Factor Analysis
- 4.1. Porters Five Forces
- 4.2. Supply/Value Chain
- 4.3. PESTEL analysis
- 4.4. Market Entropy
- 4.5. Patent/Trademark Analysis
- 5. Global In-memory Computing Industry Analysis, Insights and Forecast, 2019-2031
- 5.1. Market Analysis, Insights and Forecast - by Component
- 5.1.1. In-memory Data Management
- 5.1.2. In-memory Application
- 5.2. Market Analysis, Insights and Forecast - by End-user Vertical
- 5.2.1. BFSI
- 5.2.2. Healthcare
- 5.2.3. IT & Telecom
- 5.2.4. Government
- 5.2.5. Other End-user Verticals
- 5.3. Market Analysis, Insights and Forecast - by Region
- 5.3.1. North America
- 5.3.2. Europe
- 5.3.3. Asia Pacific
- 5.3.4. Latin America
- 5.3.5. Middle East and Africa
- 5.1. Market Analysis, Insights and Forecast - by Component
- 6. North America In-memory Computing Industry Analysis, Insights and Forecast, 2019-2031
- 6.1. Market Analysis, Insights and Forecast - by Component
- 6.1.1. In-memory Data Management
- 6.1.2. In-memory Application
- 6.2. Market Analysis, Insights and Forecast - by End-user Vertical
- 6.2.1. BFSI
- 6.2.2. Healthcare
- 6.2.3. IT & Telecom
- 6.2.4. Government
- 6.2.5. Other End-user Verticals
- 6.1. Market Analysis, Insights and Forecast - by Component
- 7. Europe In-memory Computing Industry Analysis, Insights and Forecast, 2019-2031
- 7.1. Market Analysis, Insights and Forecast - by Component
- 7.1.1. In-memory Data Management
- 7.1.2. In-memory Application
- 7.2. Market Analysis, Insights and Forecast - by End-user Vertical
- 7.2.1. BFSI
- 7.2.2. Healthcare
- 7.2.3. IT & Telecom
- 7.2.4. Government
- 7.2.5. Other End-user Verticals
- 7.1. Market Analysis, Insights and Forecast - by Component
- 8. Asia Pacific In-memory Computing Industry Analysis, Insights and Forecast, 2019-2031
- 8.1. Market Analysis, Insights and Forecast - by Component
- 8.1.1. In-memory Data Management
- 8.1.2. In-memory Application
- 8.2. Market Analysis, Insights and Forecast - by End-user Vertical
- 8.2.1. BFSI
- 8.2.2. Healthcare
- 8.2.3. IT & Telecom
- 8.2.4. Government
- 8.2.5. Other End-user Verticals
- 8.1. Market Analysis, Insights and Forecast - by Component
- 9. Latin America In-memory Computing Industry Analysis, Insights and Forecast, 2019-2031
- 9.1. Market Analysis, Insights and Forecast - by Component
- 9.1.1. In-memory Data Management
- 9.1.2. In-memory Application
- 9.2. Market Analysis, Insights and Forecast - by End-user Vertical
- 9.2.1. BFSI
- 9.2.2. Healthcare
- 9.2.3. IT & Telecom
- 9.2.4. Government
- 9.2.5. Other End-user Verticals
- 9.1. Market Analysis, Insights and Forecast - by Component
- 10. Middle East and Africa In-memory Computing Industry Analysis, Insights and Forecast, 2019-2031
- 10.1. Market Analysis, Insights and Forecast - by Component
- 10.1.1. In-memory Data Management
- 10.1.2. In-memory Application
- 10.2. Market Analysis, Insights and Forecast - by End-user Vertical
- 10.2.1. BFSI
- 10.2.2. Healthcare
- 10.2.3. IT & Telecom
- 10.2.4. Government
- 10.2.5. Other End-user Verticals
- 10.1. Market Analysis, Insights and Forecast - by Component
- 11. North America In-memory Computing Industry Analysis, Insights and Forecast, 2019-2031
- 11.1. Market Analysis, Insights and Forecast - By Country/Sub-region
- 11.1.1.
- 12. Europe In-memory Computing Industry Analysis, Insights and Forecast, 2019-2031
- 12.1. Market Analysis, Insights and Forecast - By Country/Sub-region
- 12.1.1.
- 13. Asia Pacific In-memory Computing Industry Analysis, Insights and Forecast, 2019-2031
- 13.1. Market Analysis, Insights and Forecast - By Country/Sub-region
- 13.1.1.
- 14. Latin America In-memory Computing Industry Analysis, Insights and Forecast, 2019-2031
- 14.1. Market Analysis, Insights and Forecast - By Country/Sub-region
- 14.1.1.
- 15. Middle East and Africa In-memory Computing Industry Analysis, Insights and Forecast, 2019-2031
- 15.1. Market Analysis, Insights and Forecast - By Country/Sub-region
- 15.1.1.
- 16. Competitive Analysis
- 16.1. Global Market Share Analysis 2024
- 16.2. Company Profiles
- 16.2.1 TIBCO Software Inc
- 16.2.1.1. Overview
- 16.2.1.2. Products
- 16.2.1.3. SWOT Analysis
- 16.2.1.4. Recent Developments
- 16.2.1.5. Financials (Based on Availability)
- 16.2.2 IBM Corporation
- 16.2.2.1. Overview
- 16.2.2.2. Products
- 16.2.2.3. SWOT Analysis
- 16.2.2.4. Recent Developments
- 16.2.2.5. Financials (Based on Availability)
- 16.2.3 Software AG
- 16.2.3.1. Overview
- 16.2.3.2. Products
- 16.2.3.3. SWOT Analysis
- 16.2.3.4. Recent Developments
- 16.2.3.5. Financials (Based on Availability)
- 16.2.4 Mongodb
- 16.2.4.1. Overview
- 16.2.4.2. Products
- 16.2.4.3. SWOT Analysis
- 16.2.4.4. Recent Developments
- 16.2.4.5. Financials (Based on Availability)
- 16.2.5 Microsoft Corporation
- 16.2.5.1. Overview
- 16.2.5.2. Products
- 16.2.5.3. SWOT Analysis
- 16.2.5.4. Recent Developments
- 16.2.5.5. Financials (Based on Availability)
- 16.2.6 Datastax Inc *List Not Exhaustive
- 16.2.6.1. Overview
- 16.2.6.2. Products
- 16.2.6.3. SWOT Analysis
- 16.2.6.4. Recent Developments
- 16.2.6.5. Financials (Based on Availability)
- 16.2.7 Altibase Corporation
- 16.2.7.1. Overview
- 16.2.7.2. Products
- 16.2.7.3. SWOT Analysis
- 16.2.7.4. Recent Developments
- 16.2.7.5. Financials (Based on Availability)
- 16.2.8 SAS Institute
- 16.2.8.1. Overview
- 16.2.8.2. Products
- 16.2.8.3. SWOT Analysis
- 16.2.8.4. Recent Developments
- 16.2.8.5. Financials (Based on Availability)
- 16.2.9 Gigaspaces Technologies Inc
- 16.2.9.1. Overview
- 16.2.9.2. Products
- 16.2.9.3. SWOT Analysis
- 16.2.9.4. Recent Developments
- 16.2.9.5. Financials (Based on Availability)
- 16.2.10 Oracle Corporation
- 16.2.10.1. Overview
- 16.2.10.2. Products
- 16.2.10.3. SWOT Analysis
- 16.2.10.4. Recent Developments
- 16.2.10.5. Financials (Based on Availability)
- 16.2.11 GridGain Systems inc
- 16.2.11.1. Overview
- 16.2.11.2. Products
- 16.2.11.3. SWOT Analysis
- 16.2.11.4. Recent Developments
- 16.2.11.5. Financials (Based on Availability)
- 16.2.12 Hazelcast Inc
- 16.2.12.1. Overview
- 16.2.12.2. Products
- 16.2.12.3. SWOT Analysis
- 16.2.12.4. Recent Developments
- 16.2.12.5. Financials (Based on Availability)
- 16.2.13 SAP SE
- 16.2.13.1. Overview
- 16.2.13.2. Products
- 16.2.13.3. SWOT Analysis
- 16.2.13.4. Recent Developments
- 16.2.13.5. Financials (Based on Availability)
- 16.2.1 TIBCO Software Inc
List of Figures
- Figure 1: Global In-memory Computing Industry Revenue Breakdown (Million, %) by Region 2024 & 2032
- Figure 2: North America In-memory Computing Industry Revenue (Million), by Country 2024 & 2032
- Figure 3: North America In-memory Computing Industry Revenue Share (%), by Country 2024 & 2032
- Figure 4: Europe In-memory Computing Industry Revenue (Million), by Country 2024 & 2032
- Figure 5: Europe In-memory Computing Industry Revenue Share (%), by Country 2024 & 2032
- Figure 6: Asia Pacific In-memory Computing Industry Revenue (Million), by Country 2024 & 2032
- Figure 7: Asia Pacific In-memory Computing Industry Revenue Share (%), by Country 2024 & 2032
- Figure 8: Latin America In-memory Computing Industry Revenue (Million), by Country 2024 & 2032
- Figure 9: Latin America In-memory Computing Industry Revenue Share (%), by Country 2024 & 2032
- Figure 10: Middle East and Africa In-memory Computing Industry Revenue (Million), by Country 2024 & 2032
- Figure 11: Middle East and Africa In-memory Computing Industry Revenue Share (%), by Country 2024 & 2032
- Figure 12: North America In-memory Computing Industry Revenue (Million), by Component 2024 & 2032
- Figure 13: North America In-memory Computing Industry Revenue Share (%), by Component 2024 & 2032
- Figure 14: North America In-memory Computing Industry Revenue (Million), by End-user Vertical 2024 & 2032
- Figure 15: North America In-memory Computing Industry Revenue Share (%), by End-user Vertical 2024 & 2032
- Figure 16: North America In-memory Computing Industry Revenue (Million), by Country 2024 & 2032
- Figure 17: North America In-memory Computing Industry Revenue Share (%), by Country 2024 & 2032
- Figure 18: Europe In-memory Computing Industry Revenue (Million), by Component 2024 & 2032
- Figure 19: Europe In-memory Computing Industry Revenue Share (%), by Component 2024 & 2032
- Figure 20: Europe In-memory Computing Industry Revenue (Million), by End-user Vertical 2024 & 2032
- Figure 21: Europe In-memory Computing Industry Revenue Share (%), by End-user Vertical 2024 & 2032
- Figure 22: Europe In-memory Computing Industry Revenue (Million), by Country 2024 & 2032
- Figure 23: Europe In-memory Computing Industry Revenue Share (%), by Country 2024 & 2032
- Figure 24: Asia Pacific In-memory Computing Industry Revenue (Million), by Component 2024 & 2032
- Figure 25: Asia Pacific In-memory Computing Industry Revenue Share (%), by Component 2024 & 2032
- Figure 26: Asia Pacific In-memory Computing Industry Revenue (Million), by End-user Vertical 2024 & 2032
- Figure 27: Asia Pacific In-memory Computing Industry Revenue Share (%), by End-user Vertical 2024 & 2032
- Figure 28: Asia Pacific In-memory Computing Industry Revenue (Million), by Country 2024 & 2032
- Figure 29: Asia Pacific In-memory Computing Industry Revenue Share (%), by Country 2024 & 2032
- Figure 30: Latin America In-memory Computing Industry Revenue (Million), by Component 2024 & 2032
- Figure 31: Latin America In-memory Computing Industry Revenue Share (%), by Component 2024 & 2032
- Figure 32: Latin America In-memory Computing Industry Revenue (Million), by End-user Vertical 2024 & 2032
- Figure 33: Latin America In-memory Computing Industry Revenue Share (%), by End-user Vertical 2024 & 2032
- Figure 34: Latin America In-memory Computing Industry Revenue (Million), by Country 2024 & 2032
- Figure 35: Latin America In-memory Computing Industry Revenue Share (%), by Country 2024 & 2032
- Figure 36: Middle East and Africa In-memory Computing Industry Revenue (Million), by Component 2024 & 2032
- Figure 37: Middle East and Africa In-memory Computing Industry Revenue Share (%), by Component 2024 & 2032
- Figure 38: Middle East and Africa In-memory Computing Industry Revenue (Million), by End-user Vertical 2024 & 2032
- Figure 39: Middle East and Africa In-memory Computing Industry Revenue Share (%), by End-user Vertical 2024 & 2032
- Figure 40: Middle East and Africa In-memory Computing Industry Revenue (Million), by Country 2024 & 2032
- Figure 41: Middle East and Africa In-memory Computing Industry Revenue Share (%), by Country 2024 & 2032
List of Tables
- Table 1: Global In-memory Computing Industry Revenue Million Forecast, by Region 2019 & 2032
- Table 2: Global In-memory Computing Industry Revenue Million Forecast, by Component 2019 & 2032
- Table 3: Global In-memory Computing Industry Revenue Million Forecast, by End-user Vertical 2019 & 2032
- Table 4: Global In-memory Computing Industry Revenue Million Forecast, by Region 2019 & 2032
- Table 5: Global In-memory Computing Industry Revenue Million Forecast, by Country 2019 & 2032
- Table 6: In-memory Computing Industry Revenue (Million) Forecast, by Application 2019 & 2032
- Table 7: Global In-memory Computing Industry Revenue Million Forecast, by Country 2019 & 2032
- Table 8: In-memory Computing Industry Revenue (Million) Forecast, by Application 2019 & 2032
- Table 9: Global In-memory Computing Industry Revenue Million Forecast, by Country 2019 & 2032
- Table 10: In-memory Computing Industry Revenue (Million) Forecast, by Application 2019 & 2032
- Table 11: Global In-memory Computing Industry Revenue Million Forecast, by Country 2019 & 2032
- Table 12: In-memory Computing Industry Revenue (Million) Forecast, by Application 2019 & 2032
- Table 13: Global In-memory Computing Industry Revenue Million Forecast, by Country 2019 & 2032
- Table 14: In-memory Computing Industry Revenue (Million) Forecast, by Application 2019 & 2032
- Table 15: Global In-memory Computing Industry Revenue Million Forecast, by Component 2019 & 2032
- Table 16: Global In-memory Computing Industry Revenue Million Forecast, by End-user Vertical 2019 & 2032
- Table 17: Global In-memory Computing Industry Revenue Million Forecast, by Country 2019 & 2032
- Table 18: Global In-memory Computing Industry Revenue Million Forecast, by Component 2019 & 2032
- Table 19: Global In-memory Computing Industry Revenue Million Forecast, by End-user Vertical 2019 & 2032
- Table 20: Global In-memory Computing Industry Revenue Million Forecast, by Country 2019 & 2032
- Table 21: Global In-memory Computing Industry Revenue Million Forecast, by Component 2019 & 2032
- Table 22: Global In-memory Computing Industry Revenue Million Forecast, by End-user Vertical 2019 & 2032
- Table 23: Global In-memory Computing Industry Revenue Million Forecast, by Country 2019 & 2032
- Table 24: Global In-memory Computing Industry Revenue Million Forecast, by Component 2019 & 2032
- Table 25: Global In-memory Computing Industry Revenue Million Forecast, by End-user Vertical 2019 & 2032
- Table 26: Global In-memory Computing Industry Revenue Million Forecast, by Country 2019 & 2032
- Table 27: Global In-memory Computing Industry Revenue Million Forecast, by Component 2019 & 2032
- Table 28: Global In-memory Computing Industry Revenue Million Forecast, by End-user Vertical 2019 & 2032
- Table 29: Global In-memory Computing Industry Revenue Million Forecast, by Country 2019 & 2032
Frequently Asked Questions
1. What is the projected Compound Annual Growth Rate (CAGR) of the In-memory Computing Industry?
The projected CAGR is approximately 25.37%.
2. Which companies are prominent players in the In-memory Computing Industry?
Key companies in the market include TIBCO Software Inc, IBM Corporation, Software AG, Mongodb, Microsoft Corporation, Datastax Inc *List Not Exhaustive, Altibase Corporation, SAS Institute, Gigaspaces Technologies Inc, Oracle Corporation, GridGain Systems inc, Hazelcast Inc, SAP SE.
3. What are the main segments of the In-memory Computing Industry?
The market segments include Component, End-user Vertical.
4. Can you provide details about the market size?
The market size is estimated to be USD XX Million as of 2022.
5. What are some drivers contributing to market growth?
; Explosion of Big Data; Growing Need for Rapid Data Processing.
6. What are the notable trends driving market growth?
In-memory Data Management to Hold Significant Share.
7. Are there any restraints impacting market growth?
; Concerns Regarding Data Security and Data Breaching Globally.
8. Can you provide examples of recent developments in the market?
N/A
9. What pricing options are available for accessing the report?
Pricing options include single-user, multi-user, and enterprise licenses priced at USD 4750, USD 5250, and USD 8750 respectively.
10. Is the market size provided in terms of value or volume?
The market size is provided in terms of value, measured in Million.
11. Are there any specific market keywords associated with the report?
Yes, the market keyword associated with the report is "In-memory Computing Industry," which aids in identifying and referencing the specific market segment covered.
12. How do I determine which pricing option suits my needs best?
The pricing options vary based on user requirements and access needs. Individual users may opt for single-user licenses, while businesses requiring broader access may choose multi-user or enterprise licenses for cost-effective access to the report.
13. Are there any additional resources or data provided in the In-memory Computing Industry report?
While the report offers comprehensive insights, it's advisable to review the specific contents or supplementary materials provided to ascertain if additional resources or data are available.
14. How can I stay updated on further developments or reports in the In-memory Computing Industry?
To stay informed about further developments, trends, and reports in the In-memory Computing Industry, consider subscribing to industry newsletters, following relevant companies and organizations, or regularly checking reputable industry news sources and publications.
Methodology
Step 1 - Identification of Relevant Samples Size from Population Database


Step 2 - Approaches for Defining Global Market Size (Value, Volume* & Price*)

Note*: In applicable scenarios
Step 3 - Data Sources
Primary Research
- Web Analytics
- Survey Reports
- Research Institute
- Latest Research Reports
- Opinion Leaders
Secondary Research
- Annual Reports
- White Paper
- Latest Press Release
- Industry Association
- Paid Database
- Investor Presentations

Step 4 - Data Triangulation
Involves using different sources of information in order to increase the validity of a study
These sources are likely to be stakeholders in a program - participants, other researchers, program staff, other community members, and so on.
Then we put all data in single framework & apply various statistical tools to find out the dynamic on the market.
During the analysis stage, feedback from the stakeholder groups would be compared to determine areas of agreement as well as areas of divergence


