
Key Insights
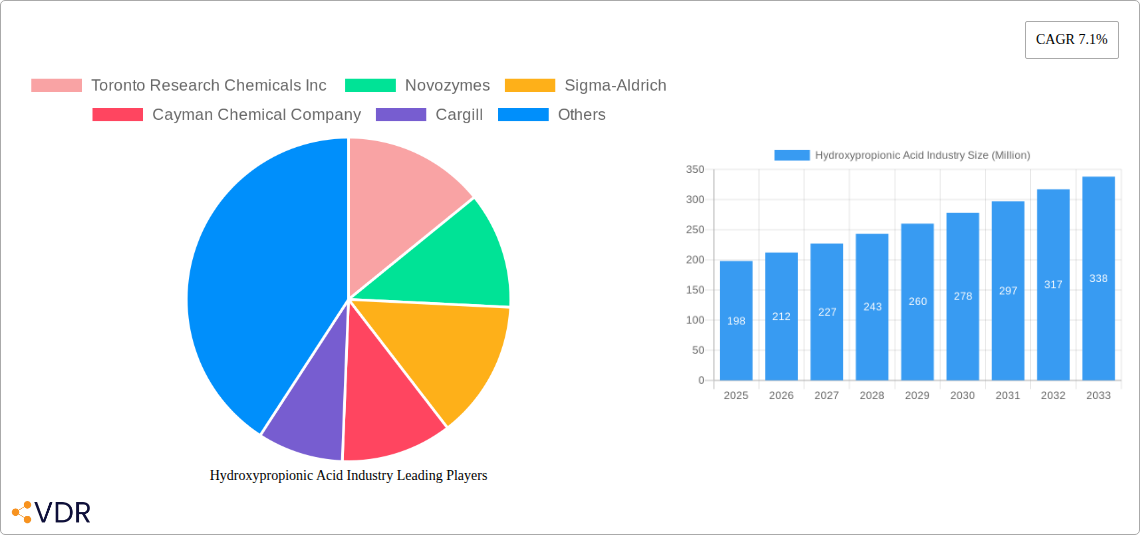
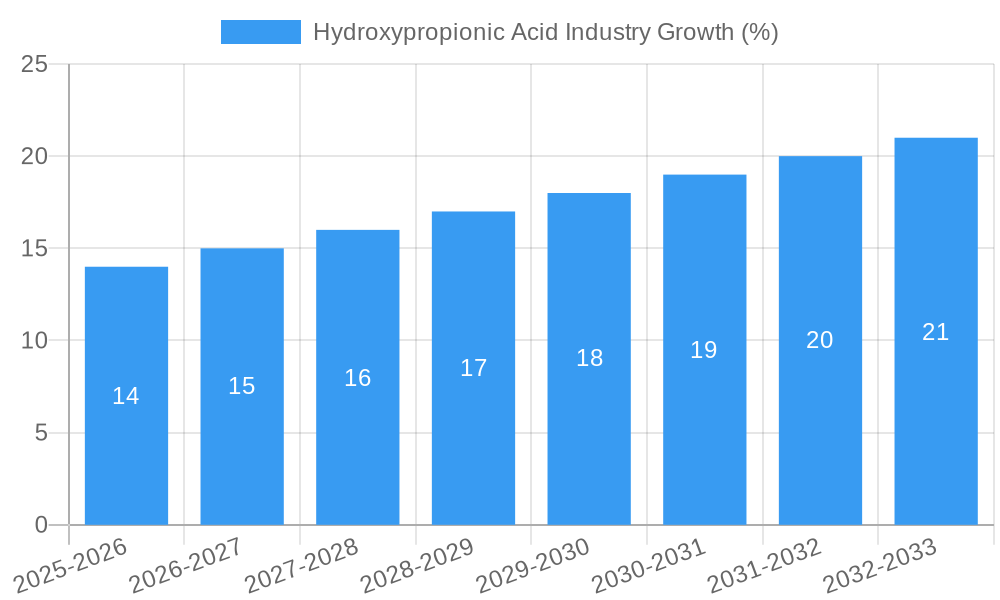
The Hydroxypropionic Acid (HPA) market, valued at $198 million in 2025, is projected to experience robust growth, driven by increasing demand from key application sectors. A Compound Annual Growth Rate (CAGR) of 7.1% from 2025 to 2033 signifies a considerable expansion of this market. The primary drivers include the burgeoning paints and coatings industry, which utilizes HPA as a crucial component in various formulations, enhancing properties like adhesion and durability. The growing polymer and adhesives and sealants markets also contribute significantly to HPA demand, reflecting the material's versatility in providing desirable properties like flexibility and strength. Technological advancements in synthesis methods, leading to improved efficiency and cost reduction, are further fueling market expansion. While specific restraint data is unavailable, potential challenges might include fluctuations in raw material prices and the emergence of alternative chemicals. However, the ongoing research and development efforts focused on improving HPA's performance characteristics and broadening its applications suggest continued market growth. The market is segmented by product type (powder, liquid) and application (paints and coatings, polymers, adhesives and sealants, others). Major players like BASF SE, Sigma-Aldrich, and Novozymes are driving innovation and shaping market dynamics through their research, production capacity, and strategic partnerships. The geographical distribution shows a strong presence across North America, Europe, and Asia Pacific, with these regions expected to retain significant market shares during the forecast period.
The substantial growth potential of the HPA market lies in exploring newer applications and expanding its presence in emerging economies. Strategic alliances between manufacturers and end-users can facilitate technology transfer and market penetration. Furthermore, research focused on sustainable and environmentally friendly production methods will be critical in ensuring the long-term viability and growth of this market. The competitive landscape is characterized by established players and emerging companies, resulting in innovation and the introduction of specialized HPA products tailored to specific application needs. The forecast period indicates substantial growth opportunities, with regional variations influenced by factors such as industrial development, regulatory landscapes, and the adoption of advanced technologies. Overall, the HPA market's future appears promising, with continued expansion fuelled by diverse applications and technological advancements.
Hydroxypropionic Acid Industry Market Report: 2019-2033
This comprehensive report provides an in-depth analysis of the Hydroxypropionic Acid industry, covering market dynamics, growth trends, regional performance, product landscape, key players, and future outlook. The report utilizes data from the historical period (2019-2024), base year (2025), and estimated year (2025) to forecast market trends through 2033. This crucial insight is invaluable for industry professionals, investors, and strategic decision-makers seeking to understand and capitalize on opportunities within this dynamic market. The parent market is considered to be the broader chemical industry, while child markets include paints and coatings, polymers, and adhesives & sealants.
Hydroxypropionic Acid Industry Market Dynamics & Structure
This section analyzes the competitive landscape of the Hydroxypropionic Acid market, examining market concentration, technological innovation, regulatory influences, and industry dynamics. The study period of 2019-2033 reveals significant shifts in market share and evolving competitive strategies.
Market Concentration: The market is moderately fragmented, with several key players holding significant shares. The top 5 companies collectively hold approximately xx% of the market share in 2025 (estimated). This suggests both opportunities for growth and potential challenges from competitive pressure.
Technological Innovation: Innovation in synthesis methods and downstream applications are key drivers. Improvements in efficiency and cost-effectiveness are continuously being pursued. However, barriers to entry exist due to specialized knowledge and high R&D costs.
Regulatory Frameworks: Stringent regulations related to chemical safety and environmental protection influence market growth and product development strategies. Compliance costs can affect profitability, while stricter regulations could lead to consolidation.
Competitive Product Substitutes: The existence of substitute materials necessitates ongoing innovation and differentiation strategies. Pricing and performance comparison with alternatives are crucial competitive factors. Market analysis reveals that xx million units of substitute materials were consumed in 2024.
End-User Demographics: The primary end-users include manufacturers in the paints and coatings, polymer, and adhesives & sealants sectors. Growth in these end-use industries directly correlates with Hydroxypropionic Acid demand.
M&A Trends: The past five years have seen xx M&A deals within the Hydroxypropionic Acid industry (2019-2024). Consolidation is expected to continue, driven by the need for economies of scale and access to new technologies.
Hydroxypropionic Acid Industry Growth Trends & Insights
This section presents a detailed analysis of market size evolution, adoption rates, and influential factors impacting the growth trajectory of the Hydroxypropionic Acid industry. Using XXX (specify data source e.g., market research databases, industry reports) the market size is projected to expand from xx million units in 2025 to xx million units by 2033, exhibiting a CAGR of xx%. This growth is primarily driven by increased demand from the paints and coatings, and polymer sectors, fueled by the rising construction and automotive industries. Technological advancements resulting in improved product performance and cost-efficiency are further accelerating adoption rates. Consumer behavior shifts toward sustainable and eco-friendly materials also positively influence the market. However, potential economic downturns or fluctuations in raw material prices pose risks to sustained growth.
Dominant Regions, Countries, or Segments in Hydroxypropionic Acid Industry
This section identifies the leading regions, countries, and segments within the Hydroxypropionic Acid market, focusing on the driving forces behind their dominance.
Product: The powder segment currently holds the largest market share (xx%), driven by its ease of handling and storage. However, the liquid segment is projected to witness faster growth due to its ease of processing in certain applications.
Application: The paints and coatings segment dominates the application landscape (xx%), primarily because of Hydroxypropionic Acid’s properties as a crosslinker and film-former. Polymer applications are also a significant segment, projected to expand at a faster rate due to innovations in biodegradable plastics and composites. Adhesives and sealants also exhibit promising growth potential.
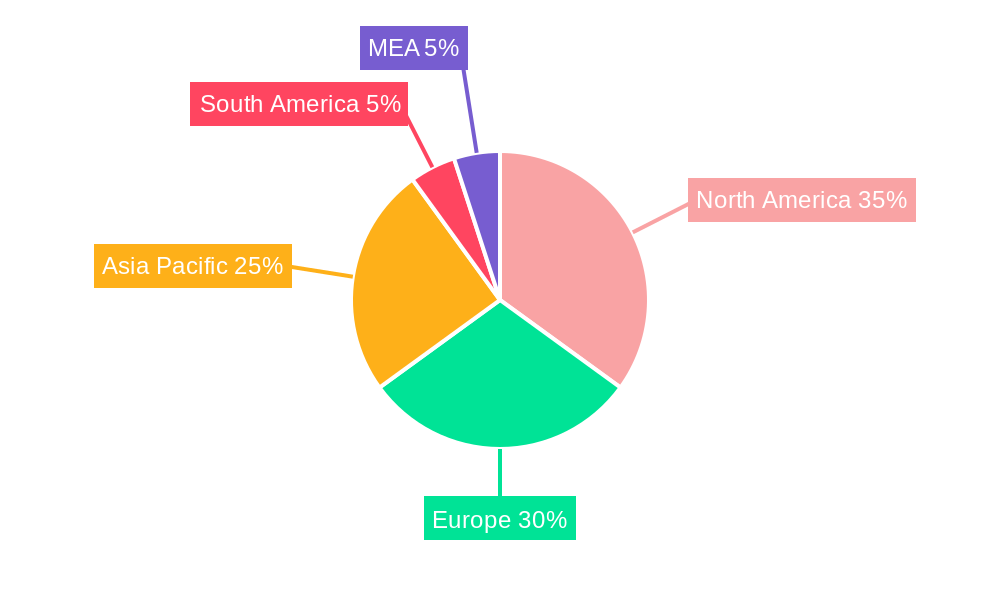
Geographic Dominance: North America currently holds the largest market share (xx%) due to its established chemical industry and significant presence of key players. However, the Asia-Pacific region is expected to exhibit the fastest growth, driven by increasing industrialization and construction activities.
Key drivers for regional growth include supportive government policies, developing infrastructure, and rising disposable incomes. Factors like robust economic growth, availability of raw materials, and supportive regulatory environments significantly influence market dominance.
Hydroxypropionic Acid Industry Product Landscape
Hydroxypropionic Acid is available in powder and liquid forms, catering to diverse application needs. Recent innovations focus on enhancing its performance characteristics, such as improved crosslinking efficiency and reduced viscosity for better processability. Unique selling propositions include its biodegradability, relatively low toxicity, and cost-effectiveness compared to some alternative chemicals. The development of new formulations tailored for specific applications is also driving market growth.
Key Drivers, Barriers & Challenges in Hydroxypropionic Acid Industry
Key Drivers:
- Growing demand from the paints and coatings, polymer, and adhesives & sealants industries.
- Technological advancements leading to improved product performance and cost-efficiency.
- Increasing awareness and adoption of sustainable and eco-friendly materials.
Challenges & Restraints:
- Volatility in raw material prices impacting production costs.
- Stringent environmental regulations requiring significant compliance investment.
- Intense competition from established chemical manufacturers and potential substitute materials. Price competition is estimated to reduce profit margins by xx% in the next 5 years.
Emerging Opportunities in Hydroxypropionic Acid Industry
Emerging opportunities include:
- Expansion into untapped markets such as bioplastics and biodegradable packaging.
- Development of novel applications in areas like personal care and pharmaceuticals.
- Strategic partnerships and collaborations to enhance product innovation and market reach.
Growth Accelerators in the Hydroxypropionic Acid Industry Industry
Technological breakthroughs in synthesis methods, strategic alliances for market access, and the development of new high-performance formulations are key catalysts for long-term growth. Expansion into new application areas and the development of customized solutions for specific customer needs will further accelerate market expansion.
Key Players Shaping the Hydroxypropionic Acid Industry Market
- Toronto Research Chemicals Inc
- Novozymes
- Sigma-Aldrich
- Cayman Chemical Company
- Cargill
- TCI N V
- BASF SE
- Dalton Research Molecules
- Spectrum Chemical Manufacturing Corp
- Alfa Aesar (Thermo Fisher Scientific)
- SynQuest Laboratories
- Capot chemical
- Oakwood Products Inc
Notable Milestones in Hydroxypropionic Acid Industry Sector
- 2021, Q3: Launch of a new high-performance Hydroxypropionic Acid formulation by BASF SE.
- 2022, Q1: Acquisition of a smaller Hydroxypropionic Acid manufacturer by Sigma-Aldrich.
- 2023, Q2: Introduction of a sustainable production process by Novozymes, reducing environmental impact. (Further milestones need to be added based on available data.)
In-Depth Hydroxypropionic Acid Industry Market Outlook
The Hydroxypropionic Acid market is poised for robust growth in the forecast period (2025-2033), driven by factors such as increasing demand from key end-use industries, continuous innovation in product performance, and expanding applications in new sectors. Strategic partnerships, investments in R&D, and the exploration of untapped market segments present significant opportunities for players in this dynamic sector. The market is projected to reach xx million units by 2033, offering lucrative prospects for companies with innovative products and effective market strategies.
Hydroxypropionic Acid Industry Segmentation
-
1. Product
- 1.1. Powder
- 1.2. Liquid
-
2. Application
- 2.1. Paints and Coatings
- 2.2. Polymer
- 2.3. Adhesives and Sealants
- 2.4. Others
Hydroxypropionic Acid Industry Segmentation By Geography
-
1. Asia Pacific
- 1.1. China
- 1.2. India
- 1.3. Japan
- 1.4. South Korea
- 1.5. Rest of Asia Pacific
-
2. North America
- 2.1. United States
- 2.2. Canada
- 2.3. Mexico
-
3. Europe
- 3.1. Germany
- 3.2. United Kingdom
- 3.3. France
- 3.4. Italy
- 3.5. Rest of Europe
-
4. South America
- 4.1. Brazil
- 4.2. Argentina
- 4.3. Rest of South America
-
5. Middle East and Africa
- 5.1. Saudi Arabia
- 5.2. South Africa
- 5.3. Rest of Middle East and Africa
Hydroxypropionic Acid Industry REPORT HIGHLIGHTS
| Aspects | Details |
|---|---|
| Study Period | 2019-2033 |
| Base Year | 2024 |
| Estimated Year | 2025 |
| Forecast Period | 2025-2033 |
| Historical Period | 2019-2024 |
| Growth Rate | CAGR of 7.1% from 2019-2033 |
| Segmentation |
|
Table of Contents
- 1. Introduction
- 1.1. Research Scope
- 1.2. Market Segmentation
- 1.3. Research Methodology
- 1.4. Definitions and Assumptions
- 2. Executive Summary
- 2.1. Introduction
- 3. Market Dynamics
- 3.1. Introduction
- 3.2. Market Drivers
- 3.2.1. ; Growing Demand from Paints and Coatings Sector; Other Drivers
- 3.3. Market Restrains
- 3.3.1. ; Unfavorable Conditions Arising Due to COVID-19 Outbreak; Other Restraints
- 3.4. Market Trends
- 3.4.1. Paints and Coatings Sector to Dominate the Market
- 4. Market Factor Analysis
- 4.1. Porters Five Forces
- 4.2. Supply/Value Chain
- 4.3. PESTEL analysis
- 4.4. Market Entropy
- 4.5. Patent/Trademark Analysis
- 5. Global Hydroxypropionic Acid Industry Analysis, Insights and Forecast, 2019-2031
- 5.1. Market Analysis, Insights and Forecast - by Product
- 5.1.1. Powder
- 5.1.2. Liquid
- 5.2. Market Analysis, Insights and Forecast - by Application
- 5.2.1. Paints and Coatings
- 5.2.2. Polymer
- 5.2.3. Adhesives and Sealants
- 5.2.4. Others
- 5.3. Market Analysis, Insights and Forecast - by Region
- 5.3.1. Asia Pacific
- 5.3.2. North America
- 5.3.3. Europe
- 5.3.4. South America
- 5.3.5. Middle East and Africa
- 5.1. Market Analysis, Insights and Forecast - by Product
- 6. Asia Pacific Hydroxypropionic Acid Industry Analysis, Insights and Forecast, 2019-2031
- 6.1. Market Analysis, Insights and Forecast - by Product
- 6.1.1. Powder
- 6.1.2. Liquid
- 6.2. Market Analysis, Insights and Forecast - by Application
- 6.2.1. Paints and Coatings
- 6.2.2. Polymer
- 6.2.3. Adhesives and Sealants
- 6.2.4. Others
- 6.1. Market Analysis, Insights and Forecast - by Product
- 7. North America Hydroxypropionic Acid Industry Analysis, Insights and Forecast, 2019-2031
- 7.1. Market Analysis, Insights and Forecast - by Product
- 7.1.1. Powder
- 7.1.2. Liquid
- 7.2. Market Analysis, Insights and Forecast - by Application
- 7.2.1. Paints and Coatings
- 7.2.2. Polymer
- 7.2.3. Adhesives and Sealants
- 7.2.4. Others
- 7.1. Market Analysis, Insights and Forecast - by Product
- 8. Europe Hydroxypropionic Acid Industry Analysis, Insights and Forecast, 2019-2031
- 8.1. Market Analysis, Insights and Forecast - by Product
- 8.1.1. Powder
- 8.1.2. Liquid
- 8.2. Market Analysis, Insights and Forecast - by Application
- 8.2.1. Paints and Coatings
- 8.2.2. Polymer
- 8.2.3. Adhesives and Sealants
- 8.2.4. Others
- 8.1. Market Analysis, Insights and Forecast - by Product
- 9. South America Hydroxypropionic Acid Industry Analysis, Insights and Forecast, 2019-2031
- 9.1. Market Analysis, Insights and Forecast - by Product
- 9.1.1. Powder
- 9.1.2. Liquid
- 9.2. Market Analysis, Insights and Forecast - by Application
- 9.2.1. Paints and Coatings
- 9.2.2. Polymer
- 9.2.3. Adhesives and Sealants
- 9.2.4. Others
- 9.1. Market Analysis, Insights and Forecast - by Product
- 10. Middle East and Africa Hydroxypropionic Acid Industry Analysis, Insights and Forecast, 2019-2031
- 10.1. Market Analysis, Insights and Forecast - by Product
- 10.1.1. Powder
- 10.1.2. Liquid
- 10.2. Market Analysis, Insights and Forecast - by Application
- 10.2.1. Paints and Coatings
- 10.2.2. Polymer
- 10.2.3. Adhesives and Sealants
- 10.2.4. Others
- 10.1. Market Analysis, Insights and Forecast - by Product
- 11. North America Hydroxypropionic Acid Industry Analysis, Insights and Forecast, 2019-2031
- 11.1. Market Analysis, Insights and Forecast - By Country/Sub-region
- 11.1.1 United States
- 11.1.2 Canada
- 11.1.3 Mexico
- 12. Europe Hydroxypropionic Acid Industry Analysis, Insights and Forecast, 2019-2031
- 12.1. Market Analysis, Insights and Forecast - By Country/Sub-region
- 12.1.1 Germany
- 12.1.2 France
- 12.1.3 Italy
- 12.1.4 United Kingdom
- 12.1.5 Netherlands
- 12.1.6 Rest of Europe
- 13. Asia Pacific Hydroxypropionic Acid Industry Analysis, Insights and Forecast, 2019-2031
- 13.1. Market Analysis, Insights and Forecast - By Country/Sub-region
- 13.1.1 China
- 13.1.2 Japan
- 13.1.3 India
- 13.1.4 South Korea
- 13.1.5 Taiwan
- 13.1.6 Australia
- 13.1.7 Rest of Asia-Pacific
- 14. South America Hydroxypropionic Acid Industry Analysis, Insights and Forecast, 2019-2031
- 14.1. Market Analysis, Insights and Forecast - By Country/Sub-region
- 14.1.1 Brazil
- 14.1.2 Argentina
- 14.1.3 Rest of South America
- 15. MEA Hydroxypropionic Acid Industry Analysis, Insights and Forecast, 2019-2031
- 15.1. Market Analysis, Insights and Forecast - By Country/Sub-region
- 15.1.1 Middle East
- 15.1.2 Africa
- 16. Competitive Analysis
- 16.1. Global Market Share Analysis 2024
- 16.2. Company Profiles
- 16.2.1 Toronto Research Chemicals Inc
- 16.2.1.1. Overview
- 16.2.1.2. Products
- 16.2.1.3. SWOT Analysis
- 16.2.1.4. Recent Developments
- 16.2.1.5. Financials (Based on Availability)
- 16.2.2 Novozymes
- 16.2.2.1. Overview
- 16.2.2.2. Products
- 16.2.2.3. SWOT Analysis
- 16.2.2.4. Recent Developments
- 16.2.2.5. Financials (Based on Availability)
- 16.2.3 Sigma-Aldrich
- 16.2.3.1. Overview
- 16.2.3.2. Products
- 16.2.3.3. SWOT Analysis
- 16.2.3.4. Recent Developments
- 16.2.3.5. Financials (Based on Availability)
- 16.2.4 Cayman Chemical Company
- 16.2.4.1. Overview
- 16.2.4.2. Products
- 16.2.4.3. SWOT Analysis
- 16.2.4.4. Recent Developments
- 16.2.4.5. Financials (Based on Availability)
- 16.2.5 Cargill
- 16.2.5.1. Overview
- 16.2.5.2. Products
- 16.2.5.3. SWOT Analysis
- 16.2.5.4. Recent Developments
- 16.2.5.5. Financials (Based on Availability)
- 16.2.6 TCI N V
- 16.2.6.1. Overview
- 16.2.6.2. Products
- 16.2.6.3. SWOT Analysis
- 16.2.6.4. Recent Developments
- 16.2.6.5. Financials (Based on Availability)
- 16.2.7 BASF SE
- 16.2.7.1. Overview
- 16.2.7.2. Products
- 16.2.7.3. SWOT Analysis
- 16.2.7.4. Recent Developments
- 16.2.7.5. Financials (Based on Availability)
- 16.2.8 Dalton Research Molecules
- 16.2.8.1. Overview
- 16.2.8.2. Products
- 16.2.8.3. SWOT Analysis
- 16.2.8.4. Recent Developments
- 16.2.8.5. Financials (Based on Availability)
- 16.2.9 Spectrum Chemical Manufacturing Corp
- 16.2.9.1. Overview
- 16.2.9.2. Products
- 16.2.9.3. SWOT Analysis
- 16.2.9.4. Recent Developments
- 16.2.9.5. Financials (Based on Availability)
- 16.2.10 Alfa Aesar (Thermo Fisher Scientific)
- 16.2.10.1. Overview
- 16.2.10.2. Products
- 16.2.10.3. SWOT Analysis
- 16.2.10.4. Recent Developments
- 16.2.10.5. Financials (Based on Availability)
- 16.2.11 SynQuest Laboratories
- 16.2.11.1. Overview
- 16.2.11.2. Products
- 16.2.11.3. SWOT Analysis
- 16.2.11.4. Recent Developments
- 16.2.11.5. Financials (Based on Availability)
- 16.2.12 Capot chemical
- 16.2.12.1. Overview
- 16.2.12.2. Products
- 16.2.12.3. SWOT Analysis
- 16.2.12.4. Recent Developments
- 16.2.12.5. Financials (Based on Availability)
- 16.2.13 Oakwood Products Inc
- 16.2.13.1. Overview
- 16.2.13.2. Products
- 16.2.13.3. SWOT Analysis
- 16.2.13.4. Recent Developments
- 16.2.13.5. Financials (Based on Availability)
- 16.2.1 Toronto Research Chemicals Inc
List of Figures
- Figure 1: Global Hydroxypropionic Acid Industry Revenue Breakdown (Million, %) by Region 2024 & 2032
- Figure 2: Global Hydroxypropionic Acid Industry Volume Breakdown (K Tons, %) by Region 2024 & 2032
- Figure 3: North America Hydroxypropionic Acid Industry Revenue (Million), by Country 2024 & 2032
- Figure 4: North America Hydroxypropionic Acid Industry Volume (K Tons), by Country 2024 & 2032
- Figure 5: North America Hydroxypropionic Acid Industry Revenue Share (%), by Country 2024 & 2032
- Figure 6: North America Hydroxypropionic Acid Industry Volume Share (%), by Country 2024 & 2032
- Figure 7: Europe Hydroxypropionic Acid Industry Revenue (Million), by Country 2024 & 2032
- Figure 8: Europe Hydroxypropionic Acid Industry Volume (K Tons), by Country 2024 & 2032
- Figure 9: Europe Hydroxypropionic Acid Industry Revenue Share (%), by Country 2024 & 2032
- Figure 10: Europe Hydroxypropionic Acid Industry Volume Share (%), by Country 2024 & 2032
- Figure 11: Asia Pacific Hydroxypropionic Acid Industry Revenue (Million), by Country 2024 & 2032
- Figure 12: Asia Pacific Hydroxypropionic Acid Industry Volume (K Tons), by Country 2024 & 2032
- Figure 13: Asia Pacific Hydroxypropionic Acid Industry Revenue Share (%), by Country 2024 & 2032
- Figure 14: Asia Pacific Hydroxypropionic Acid Industry Volume Share (%), by Country 2024 & 2032
- Figure 15: South America Hydroxypropionic Acid Industry Revenue (Million), by Country 2024 & 2032
- Figure 16: South America Hydroxypropionic Acid Industry Volume (K Tons), by Country 2024 & 2032
- Figure 17: South America Hydroxypropionic Acid Industry Revenue Share (%), by Country 2024 & 2032
- Figure 18: South America Hydroxypropionic Acid Industry Volume Share (%), by Country 2024 & 2032
- Figure 19: MEA Hydroxypropionic Acid Industry Revenue (Million), by Country 2024 & 2032
- Figure 20: MEA Hydroxypropionic Acid Industry Volume (K Tons), by Country 2024 & 2032
- Figure 21: MEA Hydroxypropionic Acid Industry Revenue Share (%), by Country 2024 & 2032
- Figure 22: MEA Hydroxypropionic Acid Industry Volume Share (%), by Country 2024 & 2032
- Figure 23: Asia Pacific Hydroxypropionic Acid Industry Revenue (Million), by Product 2024 & 2032
- Figure 24: Asia Pacific Hydroxypropionic Acid Industry Volume (K Tons), by Product 2024 & 2032
- Figure 25: Asia Pacific Hydroxypropionic Acid Industry Revenue Share (%), by Product 2024 & 2032
- Figure 26: Asia Pacific Hydroxypropionic Acid Industry Volume Share (%), by Product 2024 & 2032
- Figure 27: Asia Pacific Hydroxypropionic Acid Industry Revenue (Million), by Application 2024 & 2032
- Figure 28: Asia Pacific Hydroxypropionic Acid Industry Volume (K Tons), by Application 2024 & 2032
- Figure 29: Asia Pacific Hydroxypropionic Acid Industry Revenue Share (%), by Application 2024 & 2032
- Figure 30: Asia Pacific Hydroxypropionic Acid Industry Volume Share (%), by Application 2024 & 2032
- Figure 31: Asia Pacific Hydroxypropionic Acid Industry Revenue (Million), by Country 2024 & 2032
- Figure 32: Asia Pacific Hydroxypropionic Acid Industry Volume (K Tons), by Country 2024 & 2032
- Figure 33: Asia Pacific Hydroxypropionic Acid Industry Revenue Share (%), by Country 2024 & 2032
- Figure 34: Asia Pacific Hydroxypropionic Acid Industry Volume Share (%), by Country 2024 & 2032
- Figure 35: North America Hydroxypropionic Acid Industry Revenue (Million), by Product 2024 & 2032
- Figure 36: North America Hydroxypropionic Acid Industry Volume (K Tons), by Product 2024 & 2032
- Figure 37: North America Hydroxypropionic Acid Industry Revenue Share (%), by Product 2024 & 2032
- Figure 38: North America Hydroxypropionic Acid Industry Volume Share (%), by Product 2024 & 2032
- Figure 39: North America Hydroxypropionic Acid Industry Revenue (Million), by Application 2024 & 2032
- Figure 40: North America Hydroxypropionic Acid Industry Volume (K Tons), by Application 2024 & 2032
- Figure 41: North America Hydroxypropionic Acid Industry Revenue Share (%), by Application 2024 & 2032
- Figure 42: North America Hydroxypropionic Acid Industry Volume Share (%), by Application 2024 & 2032
- Figure 43: North America Hydroxypropionic Acid Industry Revenue (Million), by Country 2024 & 2032
- Figure 44: North America Hydroxypropionic Acid Industry Volume (K Tons), by Country 2024 & 2032
- Figure 45: North America Hydroxypropionic Acid Industry Revenue Share (%), by Country 2024 & 2032
- Figure 46: North America Hydroxypropionic Acid Industry Volume Share (%), by Country 2024 & 2032
- Figure 47: Europe Hydroxypropionic Acid Industry Revenue (Million), by Product 2024 & 2032
- Figure 48: Europe Hydroxypropionic Acid Industry Volume (K Tons), by Product 2024 & 2032
- Figure 49: Europe Hydroxypropionic Acid Industry Revenue Share (%), by Product 2024 & 2032
- Figure 50: Europe Hydroxypropionic Acid Industry Volume Share (%), by Product 2024 & 2032
- Figure 51: Europe Hydroxypropionic Acid Industry Revenue (Million), by Application 2024 & 2032
- Figure 52: Europe Hydroxypropionic Acid Industry Volume (K Tons), by Application 2024 & 2032
- Figure 53: Europe Hydroxypropionic Acid Industry Revenue Share (%), by Application 2024 & 2032
- Figure 54: Europe Hydroxypropionic Acid Industry Volume Share (%), by Application 2024 & 2032
- Figure 55: Europe Hydroxypropionic Acid Industry Revenue (Million), by Country 2024 & 2032
- Figure 56: Europe Hydroxypropionic Acid Industry Volume (K Tons), by Country 2024 & 2032
- Figure 57: Europe Hydroxypropionic Acid Industry Revenue Share (%), by Country 2024 & 2032
- Figure 58: Europe Hydroxypropionic Acid Industry Volume Share (%), by Country 2024 & 2032
- Figure 59: South America Hydroxypropionic Acid Industry Revenue (Million), by Product 2024 & 2032
- Figure 60: South America Hydroxypropionic Acid Industry Volume (K Tons), by Product 2024 & 2032
- Figure 61: South America Hydroxypropionic Acid Industry Revenue Share (%), by Product 2024 & 2032
- Figure 62: South America Hydroxypropionic Acid Industry Volume Share (%), by Product 2024 & 2032
- Figure 63: South America Hydroxypropionic Acid Industry Revenue (Million), by Application 2024 & 2032
- Figure 64: South America Hydroxypropionic Acid Industry Volume (K Tons), by Application 2024 & 2032
- Figure 65: South America Hydroxypropionic Acid Industry Revenue Share (%), by Application 2024 & 2032
- Figure 66: South America Hydroxypropionic Acid Industry Volume Share (%), by Application 2024 & 2032
- Figure 67: South America Hydroxypropionic Acid Industry Revenue (Million), by Country 2024 & 2032
- Figure 68: South America Hydroxypropionic Acid Industry Volume (K Tons), by Country 2024 & 2032
- Figure 69: South America Hydroxypropionic Acid Industry Revenue Share (%), by Country 2024 & 2032
- Figure 70: South America Hydroxypropionic Acid Industry Volume Share (%), by Country 2024 & 2032
- Figure 71: Middle East and Africa Hydroxypropionic Acid Industry Revenue (Million), by Product 2024 & 2032
- Figure 72: Middle East and Africa Hydroxypropionic Acid Industry Volume (K Tons), by Product 2024 & 2032
- Figure 73: Middle East and Africa Hydroxypropionic Acid Industry Revenue Share (%), by Product 2024 & 2032
- Figure 74: Middle East and Africa Hydroxypropionic Acid Industry Volume Share (%), by Product 2024 & 2032
- Figure 75: Middle East and Africa Hydroxypropionic Acid Industry Revenue (Million), by Application 2024 & 2032
- Figure 76: Middle East and Africa Hydroxypropionic Acid Industry Volume (K Tons), by Application 2024 & 2032
- Figure 77: Middle East and Africa Hydroxypropionic Acid Industry Revenue Share (%), by Application 2024 & 2032
- Figure 78: Middle East and Africa Hydroxypropionic Acid Industry Volume Share (%), by Application 2024 & 2032
- Figure 79: Middle East and Africa Hydroxypropionic Acid Industry Revenue (Million), by Country 2024 & 2032
- Figure 80: Middle East and Africa Hydroxypropionic Acid Industry Volume (K Tons), by Country 2024 & 2032
- Figure 81: Middle East and Africa Hydroxypropionic Acid Industry Revenue Share (%), by Country 2024 & 2032
- Figure 82: Middle East and Africa Hydroxypropionic Acid Industry Volume Share (%), by Country 2024 & 2032
List of Tables
- Table 1: Global Hydroxypropionic Acid Industry Revenue Million Forecast, by Region 2019 & 2032
- Table 2: Global Hydroxypropionic Acid Industry Volume K Tons Forecast, by Region 2019 & 2032
- Table 3: Global Hydroxypropionic Acid Industry Revenue Million Forecast, by Product 2019 & 2032
- Table 4: Global Hydroxypropionic Acid Industry Volume K Tons Forecast, by Product 2019 & 2032
- Table 5: Global Hydroxypropionic Acid Industry Revenue Million Forecast, by Application 2019 & 2032
- Table 6: Global Hydroxypropionic Acid Industry Volume K Tons Forecast, by Application 2019 & 2032
- Table 7: Global Hydroxypropionic Acid Industry Revenue Million Forecast, by Region 2019 & 2032
- Table 8: Global Hydroxypropionic Acid Industry Volume K Tons Forecast, by Region 2019 & 2032
- Table 9: Global Hydroxypropionic Acid Industry Revenue Million Forecast, by Country 2019 & 2032
- Table 10: Global Hydroxypropionic Acid Industry Volume K Tons Forecast, by Country 2019 & 2032
- Table 11: United States Hydroxypropionic Acid Industry Revenue (Million) Forecast, by Application 2019 & 2032
- Table 12: United States Hydroxypropionic Acid Industry Volume (K Tons) Forecast, by Application 2019 & 2032
- Table 13: Canada Hydroxypropionic Acid Industry Revenue (Million) Forecast, by Application 2019 & 2032
- Table 14: Canada Hydroxypropionic Acid Industry Volume (K Tons) Forecast, by Application 2019 & 2032
- Table 15: Mexico Hydroxypropionic Acid Industry Revenue (Million) Forecast, by Application 2019 & 2032
- Table 16: Mexico Hydroxypropionic Acid Industry Volume (K Tons) Forecast, by Application 2019 & 2032
- Table 17: Global Hydroxypropionic Acid Industry Revenue Million Forecast, by Country 2019 & 2032
- Table 18: Global Hydroxypropionic Acid Industry Volume K Tons Forecast, by Country 2019 & 2032
- Table 19: Germany Hydroxypropionic Acid Industry Revenue (Million) Forecast, by Application 2019 & 2032
- Table 20: Germany Hydroxypropionic Acid Industry Volume (K Tons) Forecast, by Application 2019 & 2032
- Table 21: France Hydroxypropionic Acid Industry Revenue (Million) Forecast, by Application 2019 & 2032
- Table 22: France Hydroxypropionic Acid Industry Volume (K Tons) Forecast, by Application 2019 & 2032
- Table 23: Italy Hydroxypropionic Acid Industry Revenue (Million) Forecast, by Application 2019 & 2032
- Table 24: Italy Hydroxypropionic Acid Industry Volume (K Tons) Forecast, by Application 2019 & 2032
- Table 25: United Kingdom Hydroxypropionic Acid Industry Revenue (Million) Forecast, by Application 2019 & 2032
- Table 26: United Kingdom Hydroxypropionic Acid Industry Volume (K Tons) Forecast, by Application 2019 & 2032
- Table 27: Netherlands Hydroxypropionic Acid Industry Revenue (Million) Forecast, by Application 2019 & 2032
- Table 28: Netherlands Hydroxypropionic Acid Industry Volume (K Tons) Forecast, by Application 2019 & 2032
- Table 29: Rest of Europe Hydroxypropionic Acid Industry Revenue (Million) Forecast, by Application 2019 & 2032
- Table 30: Rest of Europe Hydroxypropionic Acid Industry Volume (K Tons) Forecast, by Application 2019 & 2032
- Table 31: Global Hydroxypropionic Acid Industry Revenue Million Forecast, by Country 2019 & 2032
- Table 32: Global Hydroxypropionic Acid Industry Volume K Tons Forecast, by Country 2019 & 2032
- Table 33: China Hydroxypropionic Acid Industry Revenue (Million) Forecast, by Application 2019 & 2032
- Table 34: China Hydroxypropionic Acid Industry Volume (K Tons) Forecast, by Application 2019 & 2032
- Table 35: Japan Hydroxypropionic Acid Industry Revenue (Million) Forecast, by Application 2019 & 2032
- Table 36: Japan Hydroxypropionic Acid Industry Volume (K Tons) Forecast, by Application 2019 & 2032
- Table 37: India Hydroxypropionic Acid Industry Revenue (Million) Forecast, by Application 2019 & 2032
- Table 38: India Hydroxypropionic Acid Industry Volume (K Tons) Forecast, by Application 2019 & 2032
- Table 39: South Korea Hydroxypropionic Acid Industry Revenue (Million) Forecast, by Application 2019 & 2032
- Table 40: South Korea Hydroxypropionic Acid Industry Volume (K Tons) Forecast, by Application 2019 & 2032
- Table 41: Taiwan Hydroxypropionic Acid Industry Revenue (Million) Forecast, by Application 2019 & 2032
- Table 42: Taiwan Hydroxypropionic Acid Industry Volume (K Tons) Forecast, by Application 2019 & 2032
- Table 43: Australia Hydroxypropionic Acid Industry Revenue (Million) Forecast, by Application 2019 & 2032
- Table 44: Australia Hydroxypropionic Acid Industry Volume (K Tons) Forecast, by Application 2019 & 2032
- Table 45: Rest of Asia-Pacific Hydroxypropionic Acid Industry Revenue (Million) Forecast, by Application 2019 & 2032
- Table 46: Rest of Asia-Pacific Hydroxypropionic Acid Industry Volume (K Tons) Forecast, by Application 2019 & 2032
- Table 47: Global Hydroxypropionic Acid Industry Revenue Million Forecast, by Country 2019 & 2032
- Table 48: Global Hydroxypropionic Acid Industry Volume K Tons Forecast, by Country 2019 & 2032
- Table 49: Brazil Hydroxypropionic Acid Industry Revenue (Million) Forecast, by Application 2019 & 2032
- Table 50: Brazil Hydroxypropionic Acid Industry Volume (K Tons) Forecast, by Application 2019 & 2032
- Table 51: Argentina Hydroxypropionic Acid Industry Revenue (Million) Forecast, by Application 2019 & 2032
- Table 52: Argentina Hydroxypropionic Acid Industry Volume (K Tons) Forecast, by Application 2019 & 2032
- Table 53: Rest of South America Hydroxypropionic Acid Industry Revenue (Million) Forecast, by Application 2019 & 2032
- Table 54: Rest of South America Hydroxypropionic Acid Industry Volume (K Tons) Forecast, by Application 2019 & 2032
- Table 55: Global Hydroxypropionic Acid Industry Revenue Million Forecast, by Country 2019 & 2032
- Table 56: Global Hydroxypropionic Acid Industry Volume K Tons Forecast, by Country 2019 & 2032
- Table 57: Middle East Hydroxypropionic Acid Industry Revenue (Million) Forecast, by Application 2019 & 2032
- Table 58: Middle East Hydroxypropionic Acid Industry Volume (K Tons) Forecast, by Application 2019 & 2032
- Table 59: Africa Hydroxypropionic Acid Industry Revenue (Million) Forecast, by Application 2019 & 2032
- Table 60: Africa Hydroxypropionic Acid Industry Volume (K Tons) Forecast, by Application 2019 & 2032
- Table 61: Global Hydroxypropionic Acid Industry Revenue Million Forecast, by Product 2019 & 2032
- Table 62: Global Hydroxypropionic Acid Industry Volume K Tons Forecast, by Product 2019 & 2032
- Table 63: Global Hydroxypropionic Acid Industry Revenue Million Forecast, by Application 2019 & 2032
- Table 64: Global Hydroxypropionic Acid Industry Volume K Tons Forecast, by Application 2019 & 2032
- Table 65: Global Hydroxypropionic Acid Industry Revenue Million Forecast, by Country 2019 & 2032
- Table 66: Global Hydroxypropionic Acid Industry Volume K Tons Forecast, by Country 2019 & 2032
- Table 67: China Hydroxypropionic Acid Industry Revenue (Million) Forecast, by Application 2019 & 2032
- Table 68: China Hydroxypropionic Acid Industry Volume (K Tons) Forecast, by Application 2019 & 2032
- Table 69: India Hydroxypropionic Acid Industry Revenue (Million) Forecast, by Application 2019 & 2032
- Table 70: India Hydroxypropionic Acid Industry Volume (K Tons) Forecast, by Application 2019 & 2032
- Table 71: Japan Hydroxypropionic Acid Industry Revenue (Million) Forecast, by Application 2019 & 2032
- Table 72: Japan Hydroxypropionic Acid Industry Volume (K Tons) Forecast, by Application 2019 & 2032
- Table 73: South Korea Hydroxypropionic Acid Industry Revenue (Million) Forecast, by Application 2019 & 2032
- Table 74: South Korea Hydroxypropionic Acid Industry Volume (K Tons) Forecast, by Application 2019 & 2032
- Table 75: Rest of Asia Pacific Hydroxypropionic Acid Industry Revenue (Million) Forecast, by Application 2019 & 2032
- Table 76: Rest of Asia Pacific Hydroxypropionic Acid Industry Volume (K Tons) Forecast, by Application 2019 & 2032
- Table 77: Global Hydroxypropionic Acid Industry Revenue Million Forecast, by Product 2019 & 2032
- Table 78: Global Hydroxypropionic Acid Industry Volume K Tons Forecast, by Product 2019 & 2032
- Table 79: Global Hydroxypropionic Acid Industry Revenue Million Forecast, by Application 2019 & 2032
- Table 80: Global Hydroxypropionic Acid Industry Volume K Tons Forecast, by Application 2019 & 2032
- Table 81: Global Hydroxypropionic Acid Industry Revenue Million Forecast, by Country 2019 & 2032
- Table 82: Global Hydroxypropionic Acid Industry Volume K Tons Forecast, by Country 2019 & 2032
- Table 83: United States Hydroxypropionic Acid Industry Revenue (Million) Forecast, by Application 2019 & 2032
- Table 84: United States Hydroxypropionic Acid Industry Volume (K Tons) Forecast, by Application 2019 & 2032
- Table 85: Canada Hydroxypropionic Acid Industry Revenue (Million) Forecast, by Application 2019 & 2032
- Table 86: Canada Hydroxypropionic Acid Industry Volume (K Tons) Forecast, by Application 2019 & 2032
- Table 87: Mexico Hydroxypropionic Acid Industry Revenue (Million) Forecast, by Application 2019 & 2032
- Table 88: Mexico Hydroxypropionic Acid Industry Volume (K Tons) Forecast, by Application 2019 & 2032
- Table 89: Global Hydroxypropionic Acid Industry Revenue Million Forecast, by Product 2019 & 2032
- Table 90: Global Hydroxypropionic Acid Industry Volume K Tons Forecast, by Product 2019 & 2032
- Table 91: Global Hydroxypropionic Acid Industry Revenue Million Forecast, by Application 2019 & 2032
- Table 92: Global Hydroxypropionic Acid Industry Volume K Tons Forecast, by Application 2019 & 2032
- Table 93: Global Hydroxypropionic Acid Industry Revenue Million Forecast, by Country 2019 & 2032
- Table 94: Global Hydroxypropionic Acid Industry Volume K Tons Forecast, by Country 2019 & 2032
- Table 95: Germany Hydroxypropionic Acid Industry Revenue (Million) Forecast, by Application 2019 & 2032
- Table 96: Germany Hydroxypropionic Acid Industry Volume (K Tons) Forecast, by Application 2019 & 2032
- Table 97: United Kingdom Hydroxypropionic Acid Industry Revenue (Million) Forecast, by Application 2019 & 2032
- Table 98: United Kingdom Hydroxypropionic Acid Industry Volume (K Tons) Forecast, by Application 2019 & 2032
- Table 99: France Hydroxypropionic Acid Industry Revenue (Million) Forecast, by Application 2019 & 2032
- Table 100: France Hydroxypropionic Acid Industry Volume (K Tons) Forecast, by Application 2019 & 2032
- Table 101: Italy Hydroxypropionic Acid Industry Revenue (Million) Forecast, by Application 2019 & 2032
- Table 102: Italy Hydroxypropionic Acid Industry Volume (K Tons) Forecast, by Application 2019 & 2032
- Table 103: Rest of Europe Hydroxypropionic Acid Industry Revenue (Million) Forecast, by Application 2019 & 2032
- Table 104: Rest of Europe Hydroxypropionic Acid Industry Volume (K Tons) Forecast, by Application 2019 & 2032
- Table 105: Global Hydroxypropionic Acid Industry Revenue Million Forecast, by Product 2019 & 2032
- Table 106: Global Hydroxypropionic Acid Industry Volume K Tons Forecast, by Product 2019 & 2032
- Table 107: Global Hydroxypropionic Acid Industry Revenue Million Forecast, by Application 2019 & 2032
- Table 108: Global Hydroxypropionic Acid Industry Volume K Tons Forecast, by Application 2019 & 2032
- Table 109: Global Hydroxypropionic Acid Industry Revenue Million Forecast, by Country 2019 & 2032
- Table 110: Global Hydroxypropionic Acid Industry Volume K Tons Forecast, by Country 2019 & 2032
- Table 111: Brazil Hydroxypropionic Acid Industry Revenue (Million) Forecast, by Application 2019 & 2032
- Table 112: Brazil Hydroxypropionic Acid Industry Volume (K Tons) Forecast, by Application 2019 & 2032
- Table 113: Argentina Hydroxypropionic Acid Industry Revenue (Million) Forecast, by Application 2019 & 2032
- Table 114: Argentina Hydroxypropionic Acid Industry Volume (K Tons) Forecast, by Application 2019 & 2032
- Table 115: Rest of South America Hydroxypropionic Acid Industry Revenue (Million) Forecast, by Application 2019 & 2032
- Table 116: Rest of South America Hydroxypropionic Acid Industry Volume (K Tons) Forecast, by Application 2019 & 2032
- Table 117: Global Hydroxypropionic Acid Industry Revenue Million Forecast, by Product 2019 & 2032
- Table 118: Global Hydroxypropionic Acid Industry Volume K Tons Forecast, by Product 2019 & 2032
- Table 119: Global Hydroxypropionic Acid Industry Revenue Million Forecast, by Application 2019 & 2032
- Table 120: Global Hydroxypropionic Acid Industry Volume K Tons Forecast, by Application 2019 & 2032
- Table 121: Global Hydroxypropionic Acid Industry Revenue Million Forecast, by Country 2019 & 2032
- Table 122: Global Hydroxypropionic Acid Industry Volume K Tons Forecast, by Country 2019 & 2032
- Table 123: Saudi Arabia Hydroxypropionic Acid Industry Revenue (Million) Forecast, by Application 2019 & 2032
- Table 124: Saudi Arabia Hydroxypropionic Acid Industry Volume (K Tons) Forecast, by Application 2019 & 2032
- Table 125: South Africa Hydroxypropionic Acid Industry Revenue (Million) Forecast, by Application 2019 & 2032
- Table 126: South Africa Hydroxypropionic Acid Industry Volume (K Tons) Forecast, by Application 2019 & 2032
- Table 127: Rest of Middle East and Africa Hydroxypropionic Acid Industry Revenue (Million) Forecast, by Application 2019 & 2032
- Table 128: Rest of Middle East and Africa Hydroxypropionic Acid Industry Volume (K Tons) Forecast, by Application 2019 & 2032
Frequently Asked Questions
1. What is the projected Compound Annual Growth Rate (CAGR) of the Hydroxypropionic Acid Industry?
The projected CAGR is approximately 7.1%.
2. Which companies are prominent players in the Hydroxypropionic Acid Industry?
Key companies in the market include Toronto Research Chemicals Inc , Novozymes, Sigma-Aldrich, Cayman Chemical Company, Cargill, TCI N V, BASF SE, Dalton Research Molecules, Spectrum Chemical Manufacturing Corp, Alfa Aesar (Thermo Fisher Scientific), SynQuest Laboratories, Capot chemical, Oakwood Products Inc.
3. What are the main segments of the Hydroxypropionic Acid Industry?
The market segments include Product, Application.
4. Can you provide details about the market size?
The market size is estimated to be USD 198 Million as of 2022.
5. What are some drivers contributing to market growth?
; Growing Demand from Paints and Coatings Sector; Other Drivers.
6. What are the notable trends driving market growth?
Paints and Coatings Sector to Dominate the Market.
7. Are there any restraints impacting market growth?
; Unfavorable Conditions Arising Due to COVID-19 Outbreak; Other Restraints.
8. Can you provide examples of recent developments in the market?
N/A
9. What pricing options are available for accessing the report?
Pricing options include single-user, multi-user, and enterprise licenses priced at USD 4750, USD 5250, and USD 8750 respectively.
10. Is the market size provided in terms of value or volume?
The market size is provided in terms of value, measured in Million and volume, measured in K Tons.
11. Are there any specific market keywords associated with the report?
Yes, the market keyword associated with the report is "Hydroxypropionic Acid Industry," which aids in identifying and referencing the specific market segment covered.
12. How do I determine which pricing option suits my needs best?
The pricing options vary based on user requirements and access needs. Individual users may opt for single-user licenses, while businesses requiring broader access may choose multi-user or enterprise licenses for cost-effective access to the report.
13. Are there any additional resources or data provided in the Hydroxypropionic Acid Industry report?
While the report offers comprehensive insights, it's advisable to review the specific contents or supplementary materials provided to ascertain if additional resources or data are available.
14. How can I stay updated on further developments or reports in the Hydroxypropionic Acid Industry?
To stay informed about further developments, trends, and reports in the Hydroxypropionic Acid Industry, consider subscribing to industry newsletters, following relevant companies and organizations, or regularly checking reputable industry news sources and publications.
Methodology
Step 1 - Identification of Relevant Samples Size from Population Database


Step 2 - Approaches for Defining Global Market Size (Value, Volume* & Price*)

Note*: In applicable scenarios
Step 3 - Data Sources
Primary Research
- Web Analytics
- Survey Reports
- Research Institute
- Latest Research Reports
- Opinion Leaders
Secondary Research
- Annual Reports
- White Paper
- Latest Press Release
- Industry Association
- Paid Database
- Investor Presentations

Step 4 - Data Triangulation
Involves using different sources of information in order to increase the validity of a study
These sources are likely to be stakeholders in a program - participants, other researchers, program staff, other community members, and so on.
Then we put all data in single framework & apply various statistical tools to find out the dynamic on the market.
During the analysis stage, feedback from the stakeholder groups would be compared to determine areas of agreement as well as areas of divergence


