

Key Insights
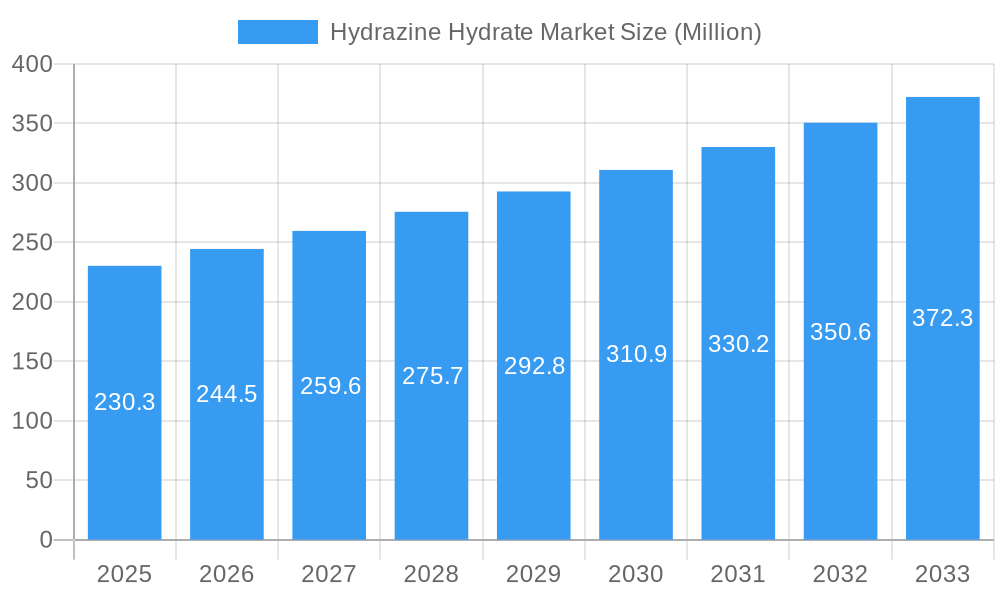
The hydrazine hydrate market, valued at $230.3 million in 2025, is projected to experience robust growth, driven by increasing demand across diverse sectors. Pharmaceuticals, a major application segment, utilize hydrazine hydrate in the synthesis of various drugs and APIs, fueling market expansion. The burgeoning agrochemical industry also contributes significantly, with hydrazine hydrate used as a precursor for several pesticides and herbicides. Furthermore, the expanding water treatment sector is adopting hydrazine hydrate for its oxygen scavenging capabilities, enhancing its overall market appeal. Growth is further fueled by advancements in polymerization and blowing agent technologies, requiring high-purity hydrazine hydrate for efficient processes. While the market faces some restraints, such as stringent safety regulations surrounding its handling and potential toxicity concerns necessitating careful application and disposal procedures, these are largely mitigated by the development of safer handling techniques and increased awareness of responsible usage. The industrial grade segment currently dominates the market due to its cost-effectiveness, but the demand for reagent grade and higher purity levels is expected to grow significantly over the forecast period due to increasing requirements for specialized applications. Geographically, the Asia-Pacific region, particularly China and India, is anticipated to showcase significant growth owing to increasing industrial activities and expanding chemical production capacities in these regions. North America and Europe, while mature markets, are also expected to maintain steady growth fueled by ongoing pharmaceutical and industrial innovations.
Hydrazine Hydrate Market Market Size (In Million)
The forecast period (2025-2033) anticipates a continued CAGR of 5.9%, resulting in substantial market expansion. This growth will be influenced by several factors. Technological advancements leading to improved production efficiency and the development of novel applications in emerging sectors will be pivotal. Moreover, strategic collaborations and expansions by key players are likely to shape the competitive landscape and contribute to market growth. However, the market's trajectory will also depend on fluctuations in raw material prices, economic conditions, and evolving environmental regulations. Monitoring these external factors will be crucial for accurate market forecasting and strategic decision-making within the hydrazine hydrate industry. The market segmentation by purity level reflects the varied requirements across different applications, highlighting the need for manufacturers to cater to specific customer needs regarding purity and grade.
Hydrazine Hydrate Market Company Market Share
Hydrazine Hydrate Market: A Comprehensive Market Report (2019-2033)
This in-depth report provides a comprehensive analysis of the Hydrazine Hydrate market, encompassing market dynamics, growth trends, regional analysis, competitive landscape, and future outlook. The report covers the parent market of industrial chemicals and the child market of specialty chemicals, offering a granular view of this crucial sector. With data spanning from 2019 to 2033 (Base Year: 2025, Forecast Period: 2025-2033), this report is an indispensable resource for industry professionals, investors, and strategic decision-makers. The market size is projected to reach XX million units by 2033.
Hydrazine Hydrate Market Dynamics & Structure
The Hydrazine Hydrate market is characterized by moderate concentration, with key players like LANXESS and Arkema Group holding significant market share. Technological innovation, particularly in synthesis methods and application-specific formulations, is a major driver. Stringent regulatory frameworks governing hazardous chemicals influence market dynamics, necessitating compliance and impacting production costs. Competitive substitutes, such as alternative blowing agents and water treatment chemicals, pose challenges. The end-user demographics are diverse, encompassing pharmaceutical, agrochemical, and industrial sectors. M&A activity remains relatively low, with recent deals focused primarily on supply chain optimization.
- Market Concentration: Moderately concentrated, with top 5 players holding approximately xx% market share in 2024.
- Technological Innovation: Focus on improving synthesis efficiency and developing specialized formulations for niche applications.
- Regulatory Landscape: Stringent regulations regarding handling and disposal of hazardous chemicals.
- Competitive Substitutes: Alternative blowing agents, water treatment solutions, and other specialized chemicals.
- M&A Activity: Low to moderate, driven largely by supply chain optimization and expansion strategies. Examples include Matrix Fine Chemicals’ cooperation agreement in November 2022.
Hydrazine Hydrate Market Growth Trends & Insights
The Hydrazine Hydrate market experienced a CAGR of xx% during the historical period (2019-2024) and is projected to maintain a CAGR of xx% during the forecast period (2025-2033). Growth is primarily fueled by increasing demand from the pharmaceutical and agrochemical industries, driven by expanding healthcare sectors and agricultural production. Technological advancements in synthesis and purification processes contribute to cost reduction and improved product quality, further stimulating market growth. Consumer behavior shifts towards more sustainable and environmentally friendly solutions are creating new opportunities for specialized hydrazine hydrate formulations. Market penetration in emerging economies is also a key factor in driving overall growth. The adoption rate for Hydrazine Hydrate in new applications shows promising growth particularly in the water treatment segment.
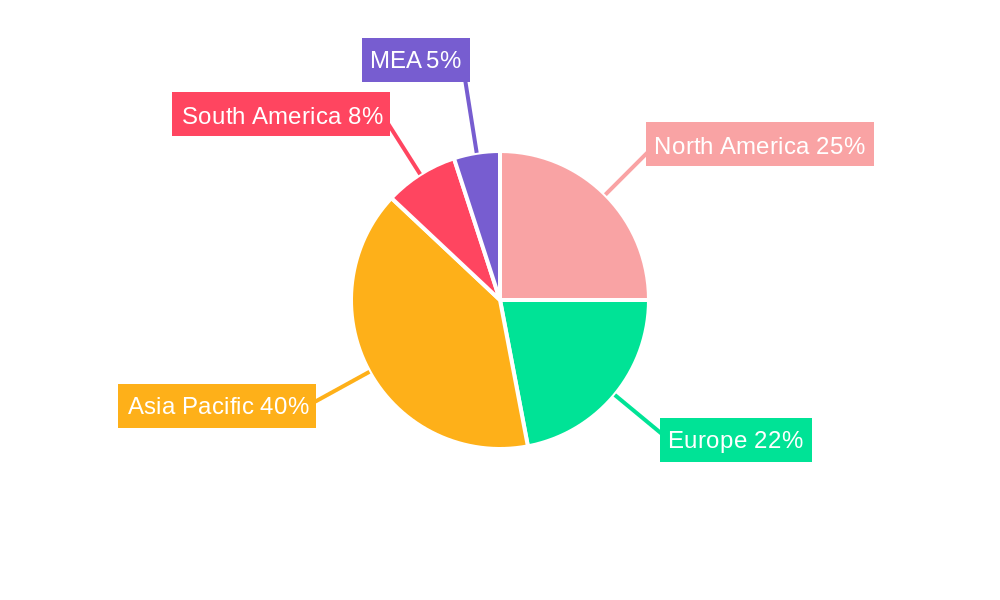
Dominant Regions, Countries, or Segments in Hydrazine Hydrate Market
The Asia-Pacific region is currently the leading market for Hydrazine Hydrate, driven by robust industrial growth, particularly in China and India. Within applications, Pharmaceuticals and Polymerization & Blowing Agents are the largest segments, accounting for approximately xx% and xx% of the total market respectively, in 2024. Industrial Grade hydrazine hydrate dominates the grade type segment due to its extensive use in various industries. Purity levels between 60%-85% are most prevalent, meeting the demands of various applications.
- Key Drivers (Asia-Pacific): Rapid industrialization, expanding pharmaceutical and agrochemical sectors, and supportive government policies.
- Dominant Application: Pharmaceuticals (driven by increasing demand for drug synthesis) and Polymerization & Blowing Agents (driven by the growth of the polymer industry).
- Dominant Grade Type: Industrial Grade (due to its cost-effectiveness).
- Dominant Purity: 60%-85% (meets the requirements of most industrial applications).
Hydrazine Hydrate Market Product Landscape
Hydrazine hydrate is primarily offered in various purities (24%-35%, 40%-55%, 60%-85%, 100%) and grades (industrial, reagent, others), catering to different applications. Recent innovations focus on improving purity levels, enhancing stability, and developing specialized formulations for specific applications. Unique selling propositions include tailored purity levels, improved handling safety, and enhanced performance in target applications. Technological advancements are focused on sustainable and efficient manufacturing processes.
Key Drivers, Barriers & Challenges in Hydrazine Hydrate Market
Key Drivers:
- Growing demand from pharmaceutical and agrochemical industries.
- Technological advancements leading to cost-effective production.
- Expansion of the polymer and water treatment sectors.
Challenges:
- Stringent safety regulations and handling requirements.
- Potential environmental concerns related to its hazardous nature.
- Price volatility due to fluctuations in raw material costs. The impact of these challenges is estimated to decrease the market size by approximately xx million units by 2033.
Emerging Opportunities in Hydrazine Hydrate Market
Emerging opportunities lie in the development of specialized hydrazine hydrate formulations for niche applications in advanced materials and water treatment. Untapped markets in developing economies present significant growth potential. Evolving consumer preferences for sustainable solutions are driving demand for eco-friendly production processes and applications.
Growth Accelerators in the Hydrazine Hydrate Market Industry
Long-term growth is accelerated by strategic partnerships aimed at expanding market reach and distribution networks. Technological breakthroughs in synthesis and purification techniques further contribute to cost reduction and enhanced product quality. Market expansion into developing economies holds immense growth potential, especially through targeted investments in local production facilities and partnerships.
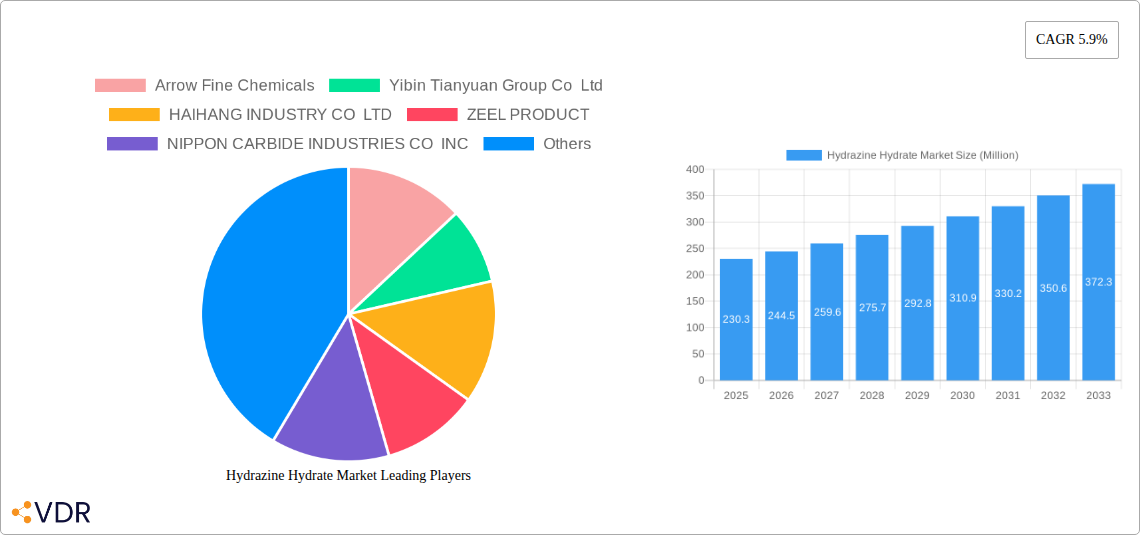
Key Players Shaping the Hydrazine Hydrate Market Market
- Arrow Fine Chemicals
- Yibin Tianyuan Group Co Ltd
- HAIHANG INDUSTRY CO LTD
- ZEEL PRODUCT
- NIPPON CARBIDE INDUSTRIES CO INC
- Hangzhou Dayangchem Co Ltd
- LANXESS
- Hunan Zhuzhou Chemical Industry Group
- Arkema Group
- Weifang Yaxing Chemical Co Ltd
- Capot Chemical Co Ltd
- Matrix Fine Chemicals GmbH
- Lonza
- Toronto Research Chemicals
- Otsuka-MGC Chemical Company Inc
- Anbros Consultants And Engineers
- Japan Finechem Inc
Notable Milestones in Hydrazine Hydrate Market Sector
- October 2022: Gujarat Alkalies and Chemicals Ltd. commences production at its new hydrazine hydrate plant in Gujarat, India, significantly reducing the nation's reliance on imports.
- November 2022: Matrix Fine Chemicals establishes a new warehouse in southern Germany, enhancing its logistics capabilities for handling hazardous materials.
In-Depth Hydrazine Hydrate Market Market Outlook
The Hydrazine Hydrate market exhibits significant long-term growth potential, driven by continued expansion in key application segments and emerging markets. Strategic investments in research and development, coupled with collaborations to optimize supply chains, will further accelerate market growth. The market is poised for substantial expansion, with projected growth fueled by technological advancements and increasing demand across various industries.
Hydrazine Hydrate Market Segmentation
-
1. Application
- 1.1. Pharmaceuticals
- 1.2. Polymerization and Blowing Agents
- 1.3. Agrochemicals
- 1.4. Water Treatment
- 1.5. Other Applications
Hydrazine Hydrate Market Segmentation By Geography
-
1. Asia Pacific
- 1.1. China
- 1.2. India
- 1.3. Japan
- 1.4. South Korea
- 1.5. Rest of Asia Pacific
-
2. North America
- 2.1. United States
- 2.2. Canada
- 2.3. Mexico
-
3. Europe
- 3.1. Germany
- 3.2. United Kingdom
- 3.3. Italy
- 3.4. France
- 3.5. Rest of Europe
-
4. South America
- 4.1. Brazil
- 4.2. Argentina
- 4.3. Rest of South America
-
5. Middle East and Africa
- 5.1. Saudi Arabia
- 5.2. South Africa
- 5.3. Rest of Middle East and Africa
Hydrazine Hydrate Market Regional Market Share
Geographic Coverage of Hydrazine Hydrate Market
Hydrazine Hydrate Market REPORT HIGHLIGHTS
| Aspects | Details |
|---|---|
| Study Period | 2020-2034 |
| Base Year | 2025 |
| Estimated Year | 2026 |
| Forecast Period | 2026-2034 |
| Historical Period | 2020-2025 |
| Growth Rate | CAGR of 5.9% from 2020-2034 |
| Segmentation |
|
Table of Contents
- 1. Introduction
- 1.1. Research Scope
- 1.2. Market Segmentation
- 1.3. Research Objective
- 1.4. Definitions and Assumptions
- 2. Executive Summary
- 2.1. Market Snapshot
- 3. Market Dynamics
- 3.1. Market Drivers
- 3.2. Market Restrains
- 3.3. Market Trends
- 3.4. Market Opportunities
- 4. Market Factor Analysis
- 4.1. Porters Five Forces
- 4.1.1. Bargaining Power of Suppliers
- 4.1.2. Bargaining Power of Buyers
- 4.1.3. Threat of New Entrants
- 4.1.4. Threat of Substitutes
- 4.1.5. Competitive Rivalry
- 4.2. PESTEL analysis
- 4.3. BCG Analysis
- 4.3.1. Stars (High Growth, High Market Share)
- 4.3.2. Cash Cows (Low Growth, High Market Share)
- 4.3.3. Question Mark (High Growth, Low Market Share)
- 4.3.4. Dogs (Low Growth, Low Market Share)
- 4.4. Ansoff Matrix Analysis
- 4.5. Supply Chain Analysis
- 4.6. Regulatory Landscape
- 4.7. Current Market Potential and Opportunity Assessment (TAM–SAM–SOM Framework)
- 4.8. VDR Analyst Note
- 4.1. Porters Five Forces
- 5. Market Analysis, Insights and Forecast 2021-2033
- 5.1. Market Analysis, Insights and Forecast - by Application
- 5.1.1. Pharmaceuticals
- 5.1.2. Polymerization and Blowing Agents
- 5.1.3. Agrochemicals
- 5.1.4. Water Treatment
- 5.1.5. Other Applications
- 5.2. Market Analysis, Insights and Forecast - by Region
- 5.2.1. Asia Pacific
- 5.2.2. North America
- 5.2.3. Europe
- 5.2.4. South America
- 5.2.5. Middle East and Africa
- 5.1. Market Analysis, Insights and Forecast - by Application
- 6. Global Hydrazine Hydrate Market Analysis, Insights and Forecast, 2021-2033
- 6.1. Market Analysis, Insights and Forecast - by Application
- 6.1.1. Pharmaceuticals
- 6.1.2. Polymerization and Blowing Agents
- 6.1.3. Agrochemicals
- 6.1.4. Water Treatment
- 6.1.5. Other Applications
- 6.1. Market Analysis, Insights and Forecast - by Application
- 7. Asia Pacific Hydrazine Hydrate Market Analysis, Insights and Forecast, 2021-2033
- 7.1. Market Analysis, Insights and Forecast - by Application
- 7.1.1. Pharmaceuticals
- 7.1.2. Polymerization and Blowing Agents
- 7.1.3. Agrochemicals
- 7.1.4. Water Treatment
- 7.1.5. Other Applications
- 7.1. Market Analysis, Insights and Forecast - by Application
- 8. North America Hydrazine Hydrate Market Analysis, Insights and Forecast, 2021-2033
- 8.1. Market Analysis, Insights and Forecast - by Application
- 8.1.1. Pharmaceuticals
- 8.1.2. Polymerization and Blowing Agents
- 8.1.3. Agrochemicals
- 8.1.4. Water Treatment
- 8.1.5. Other Applications
- 8.1. Market Analysis, Insights and Forecast - by Application
- 9. Europe Hydrazine Hydrate Market Analysis, Insights and Forecast, 2021-2033
- 9.1. Market Analysis, Insights and Forecast - by Application
- 9.1.1. Pharmaceuticals
- 9.1.2. Polymerization and Blowing Agents
- 9.1.3. Agrochemicals
- 9.1.4. Water Treatment
- 9.1.5. Other Applications
- 9.1. Market Analysis, Insights and Forecast - by Application
- 10. South America Hydrazine Hydrate Market Analysis, Insights and Forecast, 2021-2033
- 10.1. Market Analysis, Insights and Forecast - by Application
- 10.1.1. Pharmaceuticals
- 10.1.2. Polymerization and Blowing Agents
- 10.1.3. Agrochemicals
- 10.1.4. Water Treatment
- 10.1.5. Other Applications
- 10.1. Market Analysis, Insights and Forecast - by Application
- 11. Middle East and Africa Hydrazine Hydrate Market Analysis, Insights and Forecast, 2021-2033
- 11.1. Market Analysis, Insights and Forecast - by Application
- 11.1.1. Pharmaceuticals
- 11.1.2. Polymerization and Blowing Agents
- 11.1.3. Agrochemicals
- 11.1.4. Water Treatment
- 11.1.5. Other Applications
- 11.1. Market Analysis, Insights and Forecast - by Application
- 12. Competitive Analysis
- 12.1. Company Profiles
- 12.1.1 Arrow Fine Chemicals
- 12.1.1.1. Company Overview
- 12.1.1.2. Products
- 12.1.1.3. Company Financials
- 12.1.1.4. SWOT Analysis
- 12.1.2 Yibin Tianyuan Group Co Ltd
- 12.1.2.1. Company Overview
- 12.1.2.2. Products
- 12.1.2.3. Company Financials
- 12.1.2.4. SWOT Analysis
- 12.1.3 HAIHANG INDUSTRY CO LTD
- 12.1.3.1. Company Overview
- 12.1.3.2. Products
- 12.1.3.3. Company Financials
- 12.1.3.4. SWOT Analysis
- 12.1.4 ZEEL PRODUCT
- 12.1.4.1. Company Overview
- 12.1.4.2. Products
- 12.1.4.3. Company Financials
- 12.1.4.4. SWOT Analysis
- 12.1.5 NIPPON CARBIDE INDUSTRIES CO INC
- 12.1.5.1. Company Overview
- 12.1.5.2. Products
- 12.1.5.3. Company Financials
- 12.1.5.4. SWOT Analysis
- 12.1.6 Hangzhou Dayangchem Co Ltd
- 12.1.6.1. Company Overview
- 12.1.6.2. Products
- 12.1.6.3. Company Financials
- 12.1.6.4. SWOT Analysis
- 12.1.7 LANXESS
- 12.1.7.1. Company Overview
- 12.1.7.2. Products
- 12.1.7.3. Company Financials
- 12.1.7.4. SWOT Analysis
- 12.1.8 Hunan Zhuzhou Chemical Industry Group
- 12.1.8.1. Company Overview
- 12.1.8.2. Products
- 12.1.8.3. Company Financials
- 12.1.8.4. SWOT Analysis
- 12.1.9 Arkema Group
- 12.1.9.1. Company Overview
- 12.1.9.2. Products
- 12.1.9.3. Company Financials
- 12.1.9.4. SWOT Analysis
- 12.1.10 Weifang Yaxing Chemical Co Ltd
- 12.1.10.1. Company Overview
- 12.1.10.2. Products
- 12.1.10.3. Company Financials
- 12.1.10.4. SWOT Analysis
- 12.1.11 Capot Chemical Co Ltd
- 12.1.11.1. Company Overview
- 12.1.11.2. Products
- 12.1.11.3. Company Financials
- 12.1.11.4. SWOT Analysis
- 12.1.12 Matrix Fine Chemicals GmbH
- 12.1.12.1. Company Overview
- 12.1.12.2. Products
- 12.1.12.3. Company Financials
- 12.1.12.4. SWOT Analysis
- 12.1.13 Lonza
- 12.1.13.1. Company Overview
- 12.1.13.2. Products
- 12.1.13.3. Company Financials
- 12.1.13.4. SWOT Analysis
- 12.1.14 Toronto Research Chemicals
- 12.1.14.1. Company Overview
- 12.1.14.2. Products
- 12.1.14.3. Company Financials
- 12.1.14.4. SWOT Analysis
- 12.1.15 Otsuka-MGC Chemical Company Inc
- 12.1.15.1. Company Overview
- 12.1.15.2. Products
- 12.1.15.3. Company Financials
- 12.1.15.4. SWOT Analysis
- 12.1.16 Anbros Consultants And Engineers
- 12.1.16.1. Company Overview
- 12.1.16.2. Products
- 12.1.16.3. Company Financials
- 12.1.16.4. SWOT Analysis
- 12.1.17 Japan Finechem Inc
- 12.1.17.1. Company Overview
- 12.1.17.2. Products
- 12.1.17.3. Company Financials
- 12.1.17.4. SWOT Analysis
- 12.1.1 Arrow Fine Chemicals
- 12.2. Market Entropy
- 12.2.1 Company's Key Areas Served
- 12.2.2 Recent Developments
- 12.3. Company Market Share Analysis 2025
- 12.3.1 Top 5 Companies Market Share Analysis
- 12.3.2 Top 3 Companies Market Share Analysis
- 12.4. List of Potential Customers
- 13. Research Methodology
List of Figures
- Figure 1: Global Hydrazine Hydrate Market Revenue Breakdown (Million, %) by Region 2025 & 2033
- Figure 2: Global Hydrazine Hydrate Market Volume Breakdown (K Tons, %) by Region 2025 & 2033
- Figure 3: Asia Pacific Hydrazine Hydrate Market Revenue (Million), by Application 2025 & 2033
- Figure 4: Asia Pacific Hydrazine Hydrate Market Volume (K Tons), by Application 2025 & 2033
- Figure 5: Asia Pacific Hydrazine Hydrate Market Revenue Share (%), by Application 2025 & 2033
- Figure 6: Asia Pacific Hydrazine Hydrate Market Volume Share (%), by Application 2025 & 2033
- Figure 7: Asia Pacific Hydrazine Hydrate Market Revenue (Million), by Country 2025 & 2033
- Figure 8: Asia Pacific Hydrazine Hydrate Market Volume (K Tons), by Country 2025 & 2033
- Figure 9: Asia Pacific Hydrazine Hydrate Market Revenue Share (%), by Country 2025 & 2033
- Figure 10: Asia Pacific Hydrazine Hydrate Market Volume Share (%), by Country 2025 & 2033
- Figure 11: North America Hydrazine Hydrate Market Revenue (Million), by Application 2025 & 2033
- Figure 12: North America Hydrazine Hydrate Market Volume (K Tons), by Application 2025 & 2033
- Figure 13: North America Hydrazine Hydrate Market Revenue Share (%), by Application 2025 & 2033
- Figure 14: North America Hydrazine Hydrate Market Volume Share (%), by Application 2025 & 2033
- Figure 15: North America Hydrazine Hydrate Market Revenue (Million), by Country 2025 & 2033
- Figure 16: North America Hydrazine Hydrate Market Volume (K Tons), by Country 2025 & 2033
- Figure 17: North America Hydrazine Hydrate Market Revenue Share (%), by Country 2025 & 2033
- Figure 18: North America Hydrazine Hydrate Market Volume Share (%), by Country 2025 & 2033
- Figure 19: Europe Hydrazine Hydrate Market Revenue (Million), by Application 2025 & 2033
- Figure 20: Europe Hydrazine Hydrate Market Volume (K Tons), by Application 2025 & 2033
- Figure 21: Europe Hydrazine Hydrate Market Revenue Share (%), by Application 2025 & 2033
- Figure 22: Europe Hydrazine Hydrate Market Volume Share (%), by Application 2025 & 2033
- Figure 23: Europe Hydrazine Hydrate Market Revenue (Million), by Country 2025 & 2033
- Figure 24: Europe Hydrazine Hydrate Market Volume (K Tons), by Country 2025 & 2033
- Figure 25: Europe Hydrazine Hydrate Market Revenue Share (%), by Country 2025 & 2033
- Figure 26: Europe Hydrazine Hydrate Market Volume Share (%), by Country 2025 & 2033
- Figure 27: South America Hydrazine Hydrate Market Revenue (Million), by Application 2025 & 2033
- Figure 28: South America Hydrazine Hydrate Market Volume (K Tons), by Application 2025 & 2033
- Figure 29: South America Hydrazine Hydrate Market Revenue Share (%), by Application 2025 & 2033
- Figure 30: South America Hydrazine Hydrate Market Volume Share (%), by Application 2025 & 2033
- Figure 31: South America Hydrazine Hydrate Market Revenue (Million), by Country 2025 & 2033
- Figure 32: South America Hydrazine Hydrate Market Volume (K Tons), by Country 2025 & 2033
- Figure 33: South America Hydrazine Hydrate Market Revenue Share (%), by Country 2025 & 2033
- Figure 34: South America Hydrazine Hydrate Market Volume Share (%), by Country 2025 & 2033
- Figure 35: Middle East and Africa Hydrazine Hydrate Market Revenue (Million), by Application 2025 & 2033
- Figure 36: Middle East and Africa Hydrazine Hydrate Market Volume (K Tons), by Application 2025 & 2033
- Figure 37: Middle East and Africa Hydrazine Hydrate Market Revenue Share (%), by Application 2025 & 2033
- Figure 38: Middle East and Africa Hydrazine Hydrate Market Volume Share (%), by Application 2025 & 2033
- Figure 39: Middle East and Africa Hydrazine Hydrate Market Revenue (Million), by Country 2025 & 2033
- Figure 40: Middle East and Africa Hydrazine Hydrate Market Volume (K Tons), by Country 2025 & 2033
- Figure 41: Middle East and Africa Hydrazine Hydrate Market Revenue Share (%), by Country 2025 & 2033
- Figure 42: Middle East and Africa Hydrazine Hydrate Market Volume Share (%), by Country 2025 & 2033
List of Tables
- Table 1: Global Hydrazine Hydrate Market Revenue Million Forecast, by Application 2020 & 2033
- Table 2: Global Hydrazine Hydrate Market Volume K Tons Forecast, by Application 2020 & 2033
- Table 3: Global Hydrazine Hydrate Market Revenue Million Forecast, by Region 2020 & 2033
- Table 4: Global Hydrazine Hydrate Market Volume K Tons Forecast, by Region 2020 & 2033
- Table 5: Global Hydrazine Hydrate Market Revenue Million Forecast, by Application 2020 & 2033
- Table 6: Global Hydrazine Hydrate Market Volume K Tons Forecast, by Application 2020 & 2033
- Table 7: Global Hydrazine Hydrate Market Revenue Million Forecast, by Country 2020 & 2033
- Table 8: Global Hydrazine Hydrate Market Volume K Tons Forecast, by Country 2020 & 2033
- Table 9: China Hydrazine Hydrate Market Revenue (Million) Forecast, by Application 2020 & 2033
- Table 10: China Hydrazine Hydrate Market Volume (K Tons) Forecast, by Application 2020 & 2033
- Table 11: India Hydrazine Hydrate Market Revenue (Million) Forecast, by Application 2020 & 2033
- Table 12: India Hydrazine Hydrate Market Volume (K Tons) Forecast, by Application 2020 & 2033
- Table 13: Japan Hydrazine Hydrate Market Revenue (Million) Forecast, by Application 2020 & 2033
- Table 14: Japan Hydrazine Hydrate Market Volume (K Tons) Forecast, by Application 2020 & 2033
- Table 15: South Korea Hydrazine Hydrate Market Revenue (Million) Forecast, by Application 2020 & 2033
- Table 16: South Korea Hydrazine Hydrate Market Volume (K Tons) Forecast, by Application 2020 & 2033
- Table 17: Rest of Asia Pacific Hydrazine Hydrate Market Revenue (Million) Forecast, by Application 2020 & 2033
- Table 18: Rest of Asia Pacific Hydrazine Hydrate Market Volume (K Tons) Forecast, by Application 2020 & 2033
- Table 19: Global Hydrazine Hydrate Market Revenue Million Forecast, by Application 2020 & 2033
- Table 20: Global Hydrazine Hydrate Market Volume K Tons Forecast, by Application 2020 & 2033
- Table 21: Global Hydrazine Hydrate Market Revenue Million Forecast, by Country 2020 & 2033
- Table 22: Global Hydrazine Hydrate Market Volume K Tons Forecast, by Country 2020 & 2033
- Table 23: United States Hydrazine Hydrate Market Revenue (Million) Forecast, by Application 2020 & 2033
- Table 24: United States Hydrazine Hydrate Market Volume (K Tons) Forecast, by Application 2020 & 2033
- Table 25: Canada Hydrazine Hydrate Market Revenue (Million) Forecast, by Application 2020 & 2033
- Table 26: Canada Hydrazine Hydrate Market Volume (K Tons) Forecast, by Application 2020 & 2033
- Table 27: Mexico Hydrazine Hydrate Market Revenue (Million) Forecast, by Application 2020 & 2033
- Table 28: Mexico Hydrazine Hydrate Market Volume (K Tons) Forecast, by Application 2020 & 2033
- Table 29: Global Hydrazine Hydrate Market Revenue Million Forecast, by Application 2020 & 2033
- Table 30: Global Hydrazine Hydrate Market Volume K Tons Forecast, by Application 2020 & 2033
- Table 31: Global Hydrazine Hydrate Market Revenue Million Forecast, by Country 2020 & 2033
- Table 32: Global Hydrazine Hydrate Market Volume K Tons Forecast, by Country 2020 & 2033
- Table 33: Germany Hydrazine Hydrate Market Revenue (Million) Forecast, by Application 2020 & 2033
- Table 34: Germany Hydrazine Hydrate Market Volume (K Tons) Forecast, by Application 2020 & 2033
- Table 35: United Kingdom Hydrazine Hydrate Market Revenue (Million) Forecast, by Application 2020 & 2033
- Table 36: United Kingdom Hydrazine Hydrate Market Volume (K Tons) Forecast, by Application 2020 & 2033
- Table 37: Italy Hydrazine Hydrate Market Revenue (Million) Forecast, by Application 2020 & 2033
- Table 38: Italy Hydrazine Hydrate Market Volume (K Tons) Forecast, by Application 2020 & 2033
- Table 39: France Hydrazine Hydrate Market Revenue (Million) Forecast, by Application 2020 & 2033
- Table 40: France Hydrazine Hydrate Market Volume (K Tons) Forecast, by Application 2020 & 2033
- Table 41: Rest of Europe Hydrazine Hydrate Market Revenue (Million) Forecast, by Application 2020 & 2033
- Table 42: Rest of Europe Hydrazine Hydrate Market Volume (K Tons) Forecast, by Application 2020 & 2033
- Table 43: Global Hydrazine Hydrate Market Revenue Million Forecast, by Application 2020 & 2033
- Table 44: Global Hydrazine Hydrate Market Volume K Tons Forecast, by Application 2020 & 2033
- Table 45: Global Hydrazine Hydrate Market Revenue Million Forecast, by Country 2020 & 2033
- Table 46: Global Hydrazine Hydrate Market Volume K Tons Forecast, by Country 2020 & 2033
- Table 47: Brazil Hydrazine Hydrate Market Revenue (Million) Forecast, by Application 2020 & 2033
- Table 48: Brazil Hydrazine Hydrate Market Volume (K Tons) Forecast, by Application 2020 & 2033
- Table 49: Argentina Hydrazine Hydrate Market Revenue (Million) Forecast, by Application 2020 & 2033
- Table 50: Argentina Hydrazine Hydrate Market Volume (K Tons) Forecast, by Application 2020 & 2033
- Table 51: Rest of South America Hydrazine Hydrate Market Revenue (Million) Forecast, by Application 2020 & 2033
- Table 52: Rest of South America Hydrazine Hydrate Market Volume (K Tons) Forecast, by Application 2020 & 2033
- Table 53: Global Hydrazine Hydrate Market Revenue Million Forecast, by Application 2020 & 2033
- Table 54: Global Hydrazine Hydrate Market Volume K Tons Forecast, by Application 2020 & 2033
- Table 55: Global Hydrazine Hydrate Market Revenue Million Forecast, by Country 2020 & 2033
- Table 56: Global Hydrazine Hydrate Market Volume K Tons Forecast, by Country 2020 & 2033
- Table 57: Saudi Arabia Hydrazine Hydrate Market Revenue (Million) Forecast, by Application 2020 & 2033
- Table 58: Saudi Arabia Hydrazine Hydrate Market Volume (K Tons) Forecast, by Application 2020 & 2033
- Table 59: South Africa Hydrazine Hydrate Market Revenue (Million) Forecast, by Application 2020 & 2033
- Table 60: South Africa Hydrazine Hydrate Market Volume (K Tons) Forecast, by Application 2020 & 2033
- Table 61: Rest of Middle East and Africa Hydrazine Hydrate Market Revenue (Million) Forecast, by Application 2020 & 2033
- Table 62: Rest of Middle East and Africa Hydrazine Hydrate Market Volume (K Tons) Forecast, by Application 2020 & 2033
Frequently Asked Questions
1. What is the projected Compound Annual Growth Rate (CAGR) of the Hydrazine Hydrate Market?
The projected CAGR is approximately 5.9%.
2. Which companies are prominent players in the Hydrazine Hydrate Market?
Key companies in the market include Arrow Fine Chemicals, Yibin Tianyuan Group Co Ltd, HAIHANG INDUSTRY CO LTD, ZEEL PRODUCT, NIPPON CARBIDE INDUSTRIES CO INC, Hangzhou Dayangchem Co Ltd, LANXESS, Hunan Zhuzhou Chemical Industry Group, Arkema Group, Weifang Yaxing Chemical Co Ltd, Capot Chemical Co Ltd, Matrix Fine Chemicals GmbH, Lonza, Toronto Research Chemicals, Otsuka-MGC Chemical Company Inc, Anbros Consultants And Engineers, Japan Finechem Inc.
3. What are the main segments of the Hydrazine Hydrate Market?
The market segments include Application.
4. Can you provide details about the market size?
The market size is estimated to be USD 230.3 Million as of 2022.
5. What are some drivers contributing to market growth?
Increasing Demand from Polymerization and Blowing Agents; Growing Demand from Pharmaceutical Sector.
6. What are the notable trends driving market growth?
Increasing Demand from Polymerization and Blowing Agents Segment.
7. Are there any restraints impacting market growth?
Stringent Regulations Imposed on Hydrazine Hydrate; Other Restraints.
8. Can you provide examples of recent developments in the market?
November 2022: Matrix Fine Chemicals announced that it entered a new cooperation agreement with a global logistics provider. With this acquisition, the company can use a new warehouse in southern Germany to store hazardous and non-hazardous materials.
9. What pricing options are available for accessing the report?
Pricing options include single-user, multi-user, and enterprise licenses priced at USD 4750, USD 5250, and USD 8750 respectively.
10. Is the market size provided in terms of value or volume?
The market size is provided in terms of value, measured in Million and volume, measured in K Tons.
11. Are there any specific market keywords associated with the report?
Yes, the market keyword associated with the report is "Hydrazine Hydrate Market," which aids in identifying and referencing the specific market segment covered.
12. How do I determine which pricing option suits my needs best?
The pricing options vary based on user requirements and access needs. Individual users may opt for single-user licenses, while businesses requiring broader access may choose multi-user or enterprise licenses for cost-effective access to the report.
13. Are there any additional resources or data provided in the Hydrazine Hydrate Market report?
While the report offers comprehensive insights, it's advisable to review the specific contents or supplementary materials provided to ascertain if additional resources or data are available.
14. How can I stay updated on further developments or reports in the Hydrazine Hydrate Market?
To stay informed about further developments, trends, and reports in the Hydrazine Hydrate Market, consider subscribing to industry newsletters, following relevant companies and organizations, or regularly checking reputable industry news sources and publications.
Methodology
Step 1 - Identification of Relevant Samples Size from Population Database


Step 2 - Approaches for Defining Global Market Size (Value, Volume* & Price*)

Note*: In applicable scenarios
Step 3 - Data Sources
Primary Research
- Web Analytics
- Survey Reports
- Research Institute
- Latest Research Reports
- Opinion Leaders
Secondary Research
- Annual Reports
- White Paper
- Latest Press Release
- Industry Association
- Paid Database
- Investor Presentations

Step 4 - Data Triangulation
Involves using different sources of information in order to increase the validity of a study
These sources are likely to be stakeholders in a program - participants, other researchers, program staff, other community members, and so on.
Then we put all data in single framework & apply various statistical tools to find out the dynamic on the market.
During the analysis stage, feedback from the stakeholder groups would be compared to determine areas of agreement as well as areas of divergence