
Key Insights
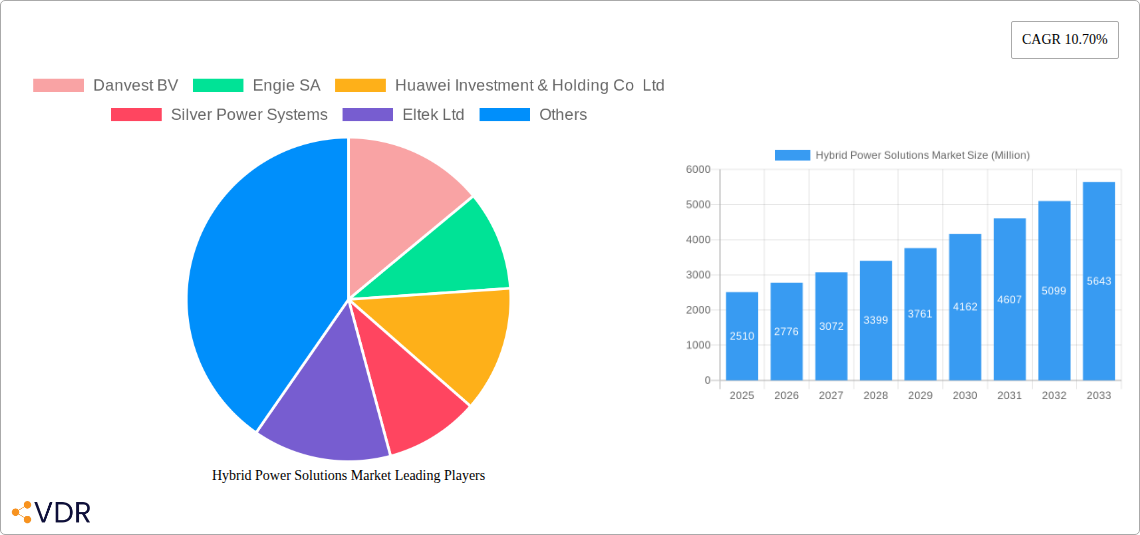
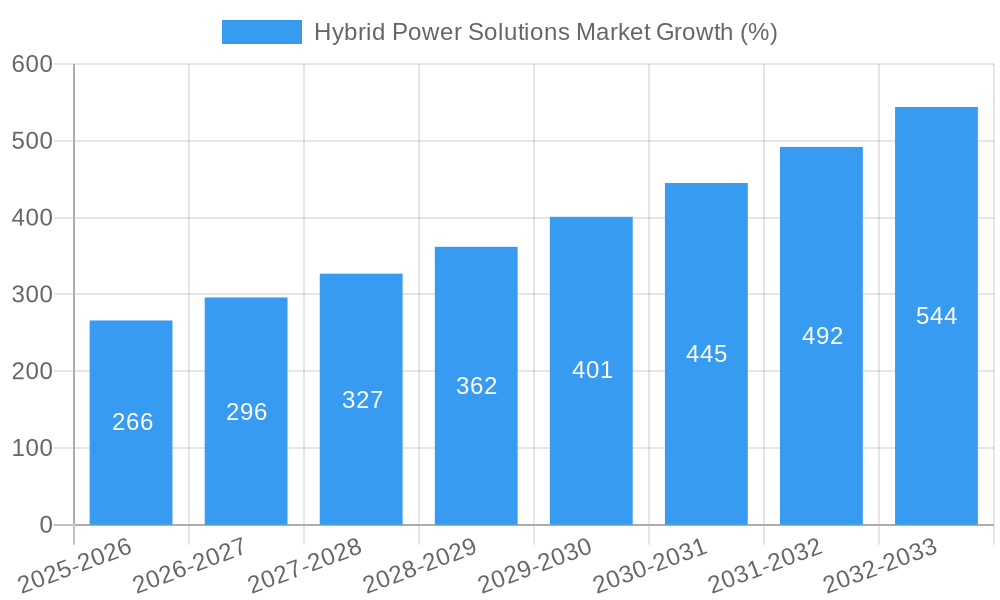
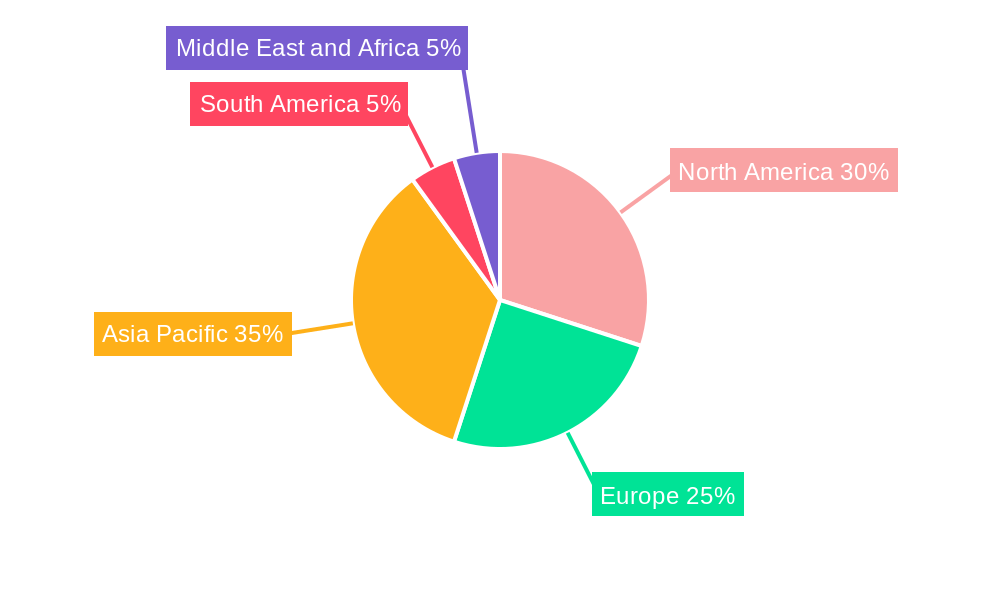
The global Hybrid Power Solutions market, valued at $2.51 billion in 2025, is projected to experience robust growth, driven by increasing demand for reliable and sustainable energy sources across various sectors. A Compound Annual Growth Rate (CAGR) of 10.70% from 2025 to 2033 indicates significant market expansion, primarily fueled by rising concerns about energy security and the escalating adoption of renewable energy technologies. The market's segmentation highlights strong growth potential in both commercial and industrial applications, where hybrid systems offer cost-effective solutions to manage energy consumption and reduce reliance on the grid. Residential adoption is also increasing, propelled by government incentives and growing awareness of environmental sustainability. The diverse configuration options, encompassing solar-plus-generator, wind-plus-generator, and combinations thereof, cater to diverse needs and geographical conditions. Key players like Danvest BV, Engie SA, and Huawei are actively shaping market dynamics through technological advancements and strategic partnerships, driving innovation and expanding market reach. Geographical expansion is expected across North America, Europe, and Asia-Pacific, with developing economies witnessing particularly strong growth due to expanding electrification and infrastructural development. However, challenges such as high initial investment costs and regulatory hurdles may present some restraints on market expansion in certain regions.
The diverse range of end-users further contributes to the market's dynamism. The commercial and industrial sectors are leading adopters, leveraging hybrid solutions to enhance energy efficiency, reduce operational costs, and ensure business continuity during grid outages. The residential segment is experiencing growth driven by government incentives, declining technology costs, and heightened environmental consciousness. Technological advancements are a key driver, with ongoing innovations leading to improved system efficiency, reduced costs, and enhanced integration capabilities. The growing emphasis on sustainable and resilient energy infrastructure in both developed and developing nations will continue to propel the growth of the hybrid power solutions market over the forecast period. The increasing availability of financing options and government support programs focused on promoting renewable energy integration are further catalysts for market expansion.
Hybrid Power Solutions Market: A Comprehensive Market Report (2019-2033)
This in-depth report provides a comprehensive analysis of the Hybrid Power Solutions market, encompassing market dynamics, growth trends, regional dominance, product landscape, challenges, opportunities, key players, and notable milestones. The study period covers 2019-2033, with 2025 as the base and estimated year. The report forecasts market trends from 2025-2033, utilizing data from the historical period of 2019-2024. The market is segmented by configuration (Solar Plus Generator, Wind Plus Generator, Solar Plus Wind Plus Generator, Other Types) and end-user (Commercial and Industrial, Residential, Utility). The total market size is projected to reach xx Million units by 2033.
Hybrid Power Solutions Market Dynamics & Structure
The Hybrid Power Solutions market is characterized by moderate concentration, with several major players vying for market share. Technological innovation, driven by advancements in renewable energy technologies and energy storage solutions, is a key driver. Stringent environmental regulations globally are further pushing adoption. The market witnesses considerable M&A activity, reflecting the strategic importance of hybrid power solutions. Competitive substitutes include traditional diesel generators, but the increasing cost and environmental concerns associated with them are favoring hybrid solutions. End-user demographics are shifting towards greater adoption by commercial & industrial sectors driven by cost savings and sustainability initiatives.
- Market Concentration: Moderately concentrated, with top 5 players holding approximately xx% market share in 2025.
- Technological Innovation: Focus on improving energy efficiency, storage capacity, and grid integration.
- Regulatory Framework: Stringent emission norms and government incentives favoring renewable energy are major growth catalysts.
- Competitive Substitutes: Traditional diesel generators, facing increasing pressure due to rising fuel costs and environmental regulations.
- M&A Trends: A significant number of acquisitions and mergers (xx deals in the last 5 years) indicates consolidation and expansion within the market.
- Innovation Barriers: High initial investment costs and lack of awareness in certain regions pose challenges.
Hybrid Power Solutions Market Growth Trends & Insights
The Hybrid Power Solutions market has exhibited robust growth in recent years, driven by increasing energy demands, rising awareness of environmental concerns, and favorable government policies. The market size was valued at xx Million units in 2024 and is projected to register a CAGR of xx% during the forecast period (2025-2033), reaching xx Million units by 2033. This growth is fueled by technological advancements, decreasing costs of renewable energy technologies, and the growing adoption of hybrid solutions across various end-user segments. Consumer behavior is shifting towards environmentally friendly and cost-effective power solutions, further boosting market growth. The penetration rate of hybrid power solutions in the residential sector is expected to increase from xx% in 2024 to xx% by 2033.
Dominant Regions, Countries, or Segments in Hybrid Power Solutions Market
North America currently dominates the Hybrid Power Solutions market, driven by robust government support for renewable energy initiatives and high adoption rates in the commercial and industrial sectors. However, Asia-Pacific is expected to witness the fastest growth during the forecast period, propelled by increasing energy demand and supportive government policies.
Leading Segments:
- Configuration: Solar Plus Generator holds the largest market share, followed by Wind Plus Generator and Solar Plus Wind Plus Generator. The Other Types segment is expected to exhibit significant growth owing to ongoing technological advancements and innovation in niche applications.
- End-User: The Commercial and Industrial sector currently dominates the market, driven by the increasing need for reliable and cost-effective power solutions. However, the Utility segment shows significant growth potential in the coming years.
Key Drivers:
- North America: Strong government support for renewable energy, high adoption rates in the commercial and industrial sectors.
- Asia-Pacific: Rapid industrialization, increasing urbanization, growing energy demand.
- Europe: Stringent emission regulations, significant investments in renewable energy infrastructure.
Hybrid Power Solutions Market Product Landscape
Hybrid power solutions are evolving rapidly, incorporating advanced technologies such as AI-powered energy management systems, improved battery storage technologies, and advanced power electronics. This allows for better grid integration, enhanced energy efficiency, and higher system reliability. Products are differentiated based on power capacity, configuration, energy storage technology, and smart features. Key selling propositions include cost savings, improved reliability, reduced carbon footprint, and enhanced energy security.
Key Drivers, Barriers & Challenges in Hybrid Power Solutions Market
Key Drivers:
- Increasing demand for reliable and sustainable power solutions.
- Favorable government policies and incentives for renewable energy adoption.
- Decreasing cost of renewable energy technologies.
Challenges and Restraints:
- High initial investment costs, acting as a barrier for some end-users, particularly in the residential segment.
- Intermittency of renewable energy sources, posing challenges for grid stability and reliability.
- Supply chain disruptions for critical components, such as batteries and inverters.
Emerging Opportunities in Hybrid Power Solutions Market
Significant opportunities lie in emerging economies with growing energy demands and limited grid infrastructure. The integration of hybrid power systems with smart grids and energy storage solutions represents a substantial market opportunity. The growing demand for off-grid and microgrid solutions, particularly in remote areas, creates a large untapped market. Further opportunities arise from innovative applications such as providing power to electric vehicle charging stations and supporting the expansion of renewable energy capacity.
Growth Accelerators in the Hybrid Power Solutions Market Industry
Technological advancements like next-generation battery technologies, improved energy management systems, and enhanced power electronics are driving market growth. Strategic partnerships and collaborations between renewable energy companies and energy storage providers are also fueling market expansion. Government initiatives to promote renewable energy adoption and incentivize hybrid power solutions are further accelerating market growth. The expanding adoption of hybrid power solutions in various end-user sectors will further drive market growth.
Key Players Shaping the Hybrid Power Solutions Market Market
- Danvest BV
- Engie SA
- Huawei Investment & Holding Co Ltd
- Silver Power Systems
- Eltek Ltd
- Siemens Gamesa Renewable Energy SA
- Vergnet SA
- General Electric Company
- SMA Solar Technology AG
Notable Milestones in Hybrid Power Solutions Market Sector
- February 2023: Prolectric Services Ltd launched the ProPower 3-Phase Solar Hybrid Power unit, a 60 kW system for remote locations, emphasizing reduced carbon emissions.
- September 2022: Shell acquired Daystar Power, expanding its hybrid power solutions portfolio in West Africa, targeting commercial and industrial clients.
In-Depth Hybrid Power Solutions Market Market Outlook
The Hybrid Power Solutions market is poised for sustained growth over the next decade, driven by increasing energy demands, environmental concerns, and supportive government policies. Strategic partnerships, technological advancements, and expansion into new markets present significant opportunities for players in this dynamic sector. The market will likely witness further consolidation through mergers and acquisitions, leading to a more concentrated landscape. Focus on innovation, cost optimization, and customer-centric solutions will be crucial for success.
Hybrid Power Solutions Market Segmentation
-
1. Configuration
- 1.1. Solar Plus Generator
- 1.2. Wind Plus Generator
- 1.3. Solar Plus Wind Plus Generator
- 1.4. Other Types
-
2. End-User
- 2.1. Commercial and Industrial
- 2.2. Residential
- 2.3. Utility
Hybrid Power Solutions Market Segmentation By Geography
-
1. North America
- 1.1. United States
- 1.2. Canada
- 1.3. Rest of North America
-
2. Europe
- 2.1. Germany
- 2.2. United Kingdom
- 2.3. Italy
- 2.4. France
- 2.5. Rest of Europe
-
3. Asia Pacific
- 3.1. China
- 3.2. India
- 3.3. Australia
- 3.4. Japan
- 3.5. South Korea
- 3.6. Rest of Asia Pacific
-
4. South America
- 4.1. Brazil
- 4.2. Argentina
- 4.3. Rest of South America
-
5. Middle East and Africa
- 5.1. Saudi Arabia
- 5.2. United Arab Emirates
- 5.3. Egypt
- 5.4. South Afrcia
- 5.5. Rest of Middle East and Africa
Hybrid Power Solutions Market REPORT HIGHLIGHTS
| Aspects | Details |
|---|---|
| Study Period | 2019-2033 |
| Base Year | 2024 |
| Estimated Year | 2025 |
| Forecast Period | 2025-2033 |
| Historical Period | 2019-2024 |
| Growth Rate | CAGR of 10.70% from 2019-2033 |
| Segmentation |
|
Table of Contents
- 1. Introduction
- 1.1. Research Scope
- 1.2. Market Segmentation
- 1.3. Research Methodology
- 1.4. Definitions and Assumptions
- 2. Executive Summary
- 2.1. Introduction
- 3. Market Dynamics
- 3.1. Introduction
- 3.2. Market Drivers
- 3.2.1. 4.; Growing Environmental Concerns4.; Supportive Government Policies
- 3.3. Market Restrains
- 3.3.1. 4.; High Initial Capital Investment
- 3.4. Market Trends
- 3.4.1. Solar Generator Hybrid Segment to Dominate the Market
- 4. Market Factor Analysis
- 4.1. Porters Five Forces
- 4.2. Supply/Value Chain
- 4.3. PESTEL analysis
- 4.4. Market Entropy
- 4.5. Patent/Trademark Analysis
- 5. Global Hybrid Power Solutions Market Analysis, Insights and Forecast, 2019-2031
- 5.1. Market Analysis, Insights and Forecast - by Configuration
- 5.1.1. Solar Plus Generator
- 5.1.2. Wind Plus Generator
- 5.1.3. Solar Plus Wind Plus Generator
- 5.1.4. Other Types
- 5.2. Market Analysis, Insights and Forecast - by End-User
- 5.2.1. Commercial and Industrial
- 5.2.2. Residential
- 5.2.3. Utility
- 5.3. Market Analysis, Insights and Forecast - by Region
- 5.3.1. North America
- 5.3.2. Europe
- 5.3.3. Asia Pacific
- 5.3.4. South America
- 5.3.5. Middle East and Africa
- 5.1. Market Analysis, Insights and Forecast - by Configuration
- 6. North America Hybrid Power Solutions Market Analysis, Insights and Forecast, 2019-2031
- 6.1. Market Analysis, Insights and Forecast - by Configuration
- 6.1.1. Solar Plus Generator
- 6.1.2. Wind Plus Generator
- 6.1.3. Solar Plus Wind Plus Generator
- 6.1.4. Other Types
- 6.2. Market Analysis, Insights and Forecast - by End-User
- 6.2.1. Commercial and Industrial
- 6.2.2. Residential
- 6.2.3. Utility
- 6.1. Market Analysis, Insights and Forecast - by Configuration
- 7. Europe Hybrid Power Solutions Market Analysis, Insights and Forecast, 2019-2031
- 7.1. Market Analysis, Insights and Forecast - by Configuration
- 7.1.1. Solar Plus Generator
- 7.1.2. Wind Plus Generator
- 7.1.3. Solar Plus Wind Plus Generator
- 7.1.4. Other Types
- 7.2. Market Analysis, Insights and Forecast - by End-User
- 7.2.1. Commercial and Industrial
- 7.2.2. Residential
- 7.2.3. Utility
- 7.1. Market Analysis, Insights and Forecast - by Configuration
- 8. Asia Pacific Hybrid Power Solutions Market Analysis, Insights and Forecast, 2019-2031
- 8.1. Market Analysis, Insights and Forecast - by Configuration
- 8.1.1. Solar Plus Generator
- 8.1.2. Wind Plus Generator
- 8.1.3. Solar Plus Wind Plus Generator
- 8.1.4. Other Types
- 8.2. Market Analysis, Insights and Forecast - by End-User
- 8.2.1. Commercial and Industrial
- 8.2.2. Residential
- 8.2.3. Utility
- 8.1. Market Analysis, Insights and Forecast - by Configuration
- 9. South America Hybrid Power Solutions Market Analysis, Insights and Forecast, 2019-2031
- 9.1. Market Analysis, Insights and Forecast - by Configuration
- 9.1.1. Solar Plus Generator
- 9.1.2. Wind Plus Generator
- 9.1.3. Solar Plus Wind Plus Generator
- 9.1.4. Other Types
- 9.2. Market Analysis, Insights and Forecast - by End-User
- 9.2.1. Commercial and Industrial
- 9.2.2. Residential
- 9.2.3. Utility
- 9.1. Market Analysis, Insights and Forecast - by Configuration
- 10. Middle East and Africa Hybrid Power Solutions Market Analysis, Insights and Forecast, 2019-2031
- 10.1. Market Analysis, Insights and Forecast - by Configuration
- 10.1.1. Solar Plus Generator
- 10.1.2. Wind Plus Generator
- 10.1.3. Solar Plus Wind Plus Generator
- 10.1.4. Other Types
- 10.2. Market Analysis, Insights and Forecast - by End-User
- 10.2.1. Commercial and Industrial
- 10.2.2. Residential
- 10.2.3. Utility
- 10.1. Market Analysis, Insights and Forecast - by Configuration
- 11. North America Hybrid Power Solutions Market Analysis, Insights and Forecast, 2019-2031
- 11.1. Market Analysis, Insights and Forecast - By Country/Sub-region
- 11.1.1 United States
- 11.1.2 Canada
- 11.1.3 Rest of North America
- 12. Europe Hybrid Power Solutions Market Analysis, Insights and Forecast, 2019-2031
- 12.1. Market Analysis, Insights and Forecast - By Country/Sub-region
- 12.1.1 Germany
- 12.1.2 United Kingdom
- 12.1.3 Italy
- 12.1.4 France
- 12.1.5 Rest of Europe
- 13. Asia Pacific Hybrid Power Solutions Market Analysis, Insights and Forecast, 2019-2031
- 13.1. Market Analysis, Insights and Forecast - By Country/Sub-region
- 13.1.1 China
- 13.1.2 India
- 13.1.3 Australia
- 13.1.4 Japan
- 13.1.5 South Korea
- 13.1.6 Rest of Asia Pacific
- 14. South America Hybrid Power Solutions Market Analysis, Insights and Forecast, 2019-2031
- 14.1. Market Analysis, Insights and Forecast - By Country/Sub-region
- 14.1.1 Brazil
- 14.1.2 Argentina
- 14.1.3 Rest of South America
- 15. Middle East and Africa Hybrid Power Solutions Market Analysis, Insights and Forecast, 2019-2031
- 15.1. Market Analysis, Insights and Forecast - By Country/Sub-region
- 15.1.1 Saudi Arabia
- 15.1.2 United Arab Emirates
- 15.1.3 Egypt
- 15.1.4 South Afrcia
- 15.1.5 Rest of Middle East and Africa
- 16. Competitive Analysis
- 16.1. Global Market Share Analysis 2024
- 16.2. Company Profiles
- 16.2.1 Danvest BV
- 16.2.1.1. Overview
- 16.2.1.2. Products
- 16.2.1.3. SWOT Analysis
- 16.2.1.4. Recent Developments
- 16.2.1.5. Financials (Based on Availability)
- 16.2.2 Engie SA
- 16.2.2.1. Overview
- 16.2.2.2. Products
- 16.2.2.3. SWOT Analysis
- 16.2.2.4. Recent Developments
- 16.2.2.5. Financials (Based on Availability)
- 16.2.3 Huawei Investment & Holding Co Ltd
- 16.2.3.1. Overview
- 16.2.3.2. Products
- 16.2.3.3. SWOT Analysis
- 16.2.3.4. Recent Developments
- 16.2.3.5. Financials (Based on Availability)
- 16.2.4 Silver Power Systems
- 16.2.4.1. Overview
- 16.2.4.2. Products
- 16.2.4.3. SWOT Analysis
- 16.2.4.4. Recent Developments
- 16.2.4.5. Financials (Based on Availability)
- 16.2.5 Eltek Ltd
- 16.2.5.1. Overview
- 16.2.5.2. Products
- 16.2.5.3. SWOT Analysis
- 16.2.5.4. Recent Developments
- 16.2.5.5. Financials (Based on Availability)
- 16.2.6 Siemens Gamesa Renewable Energy SA
- 16.2.6.1. Overview
- 16.2.6.2. Products
- 16.2.6.3. SWOT Analysis
- 16.2.6.4. Recent Developments
- 16.2.6.5. Financials (Based on Availability)
- 16.2.7 Vergnet SA*List Not Exhaustive
- 16.2.7.1. Overview
- 16.2.7.2. Products
- 16.2.7.3. SWOT Analysis
- 16.2.7.4. Recent Developments
- 16.2.7.5. Financials (Based on Availability)
- 16.2.8 General Electric Company
- 16.2.8.1. Overview
- 16.2.8.2. Products
- 16.2.8.3. SWOT Analysis
- 16.2.8.4. Recent Developments
- 16.2.8.5. Financials (Based on Availability)
- 16.2.9 SMA Solar Technology AG
- 16.2.9.1. Overview
- 16.2.9.2. Products
- 16.2.9.3. SWOT Analysis
- 16.2.9.4. Recent Developments
- 16.2.9.5. Financials (Based on Availability)
- 16.2.1 Danvest BV
List of Figures
- Figure 1: Global Hybrid Power Solutions Market Revenue Breakdown (Million, %) by Region 2024 & 2032
- Figure 2: North America Hybrid Power Solutions Market Revenue (Million), by Country 2024 & 2032
- Figure 3: North America Hybrid Power Solutions Market Revenue Share (%), by Country 2024 & 2032
- Figure 4: Europe Hybrid Power Solutions Market Revenue (Million), by Country 2024 & 2032
- Figure 5: Europe Hybrid Power Solutions Market Revenue Share (%), by Country 2024 & 2032
- Figure 6: Asia Pacific Hybrid Power Solutions Market Revenue (Million), by Country 2024 & 2032
- Figure 7: Asia Pacific Hybrid Power Solutions Market Revenue Share (%), by Country 2024 & 2032
- Figure 8: South America Hybrid Power Solutions Market Revenue (Million), by Country 2024 & 2032
- Figure 9: South America Hybrid Power Solutions Market Revenue Share (%), by Country 2024 & 2032
- Figure 10: Middle East and Africa Hybrid Power Solutions Market Revenue (Million), by Country 2024 & 2032
- Figure 11: Middle East and Africa Hybrid Power Solutions Market Revenue Share (%), by Country 2024 & 2032
- Figure 12: North America Hybrid Power Solutions Market Revenue (Million), by Configuration 2024 & 2032
- Figure 13: North America Hybrid Power Solutions Market Revenue Share (%), by Configuration 2024 & 2032
- Figure 14: North America Hybrid Power Solutions Market Revenue (Million), by End-User 2024 & 2032
- Figure 15: North America Hybrid Power Solutions Market Revenue Share (%), by End-User 2024 & 2032
- Figure 16: North America Hybrid Power Solutions Market Revenue (Million), by Country 2024 & 2032
- Figure 17: North America Hybrid Power Solutions Market Revenue Share (%), by Country 2024 & 2032
- Figure 18: Europe Hybrid Power Solutions Market Revenue (Million), by Configuration 2024 & 2032
- Figure 19: Europe Hybrid Power Solutions Market Revenue Share (%), by Configuration 2024 & 2032
- Figure 20: Europe Hybrid Power Solutions Market Revenue (Million), by End-User 2024 & 2032
- Figure 21: Europe Hybrid Power Solutions Market Revenue Share (%), by End-User 2024 & 2032
- Figure 22: Europe Hybrid Power Solutions Market Revenue (Million), by Country 2024 & 2032
- Figure 23: Europe Hybrid Power Solutions Market Revenue Share (%), by Country 2024 & 2032
- Figure 24: Asia Pacific Hybrid Power Solutions Market Revenue (Million), by Configuration 2024 & 2032
- Figure 25: Asia Pacific Hybrid Power Solutions Market Revenue Share (%), by Configuration 2024 & 2032
- Figure 26: Asia Pacific Hybrid Power Solutions Market Revenue (Million), by End-User 2024 & 2032
- Figure 27: Asia Pacific Hybrid Power Solutions Market Revenue Share (%), by End-User 2024 & 2032
- Figure 28: Asia Pacific Hybrid Power Solutions Market Revenue (Million), by Country 2024 & 2032
- Figure 29: Asia Pacific Hybrid Power Solutions Market Revenue Share (%), by Country 2024 & 2032
- Figure 30: South America Hybrid Power Solutions Market Revenue (Million), by Configuration 2024 & 2032
- Figure 31: South America Hybrid Power Solutions Market Revenue Share (%), by Configuration 2024 & 2032
- Figure 32: South America Hybrid Power Solutions Market Revenue (Million), by End-User 2024 & 2032
- Figure 33: South America Hybrid Power Solutions Market Revenue Share (%), by End-User 2024 & 2032
- Figure 34: South America Hybrid Power Solutions Market Revenue (Million), by Country 2024 & 2032
- Figure 35: South America Hybrid Power Solutions Market Revenue Share (%), by Country 2024 & 2032
- Figure 36: Middle East and Africa Hybrid Power Solutions Market Revenue (Million), by Configuration 2024 & 2032
- Figure 37: Middle East and Africa Hybrid Power Solutions Market Revenue Share (%), by Configuration 2024 & 2032
- Figure 38: Middle East and Africa Hybrid Power Solutions Market Revenue (Million), by End-User 2024 & 2032
- Figure 39: Middle East and Africa Hybrid Power Solutions Market Revenue Share (%), by End-User 2024 & 2032
- Figure 40: Middle East and Africa Hybrid Power Solutions Market Revenue (Million), by Country 2024 & 2032
- Figure 41: Middle East and Africa Hybrid Power Solutions Market Revenue Share (%), by Country 2024 & 2032
List of Tables
- Table 1: Global Hybrid Power Solutions Market Revenue Million Forecast, by Region 2019 & 2032
- Table 2: Global Hybrid Power Solutions Market Revenue Million Forecast, by Configuration 2019 & 2032
- Table 3: Global Hybrid Power Solutions Market Revenue Million Forecast, by End-User 2019 & 2032
- Table 4: Global Hybrid Power Solutions Market Revenue Million Forecast, by Region 2019 & 2032
- Table 5: Global Hybrid Power Solutions Market Revenue Million Forecast, by Country 2019 & 2032
- Table 6: United States Hybrid Power Solutions Market Revenue (Million) Forecast, by Application 2019 & 2032
- Table 7: Canada Hybrid Power Solutions Market Revenue (Million) Forecast, by Application 2019 & 2032
- Table 8: Rest of North America Hybrid Power Solutions Market Revenue (Million) Forecast, by Application 2019 & 2032
- Table 9: Global Hybrid Power Solutions Market Revenue Million Forecast, by Country 2019 & 2032
- Table 10: Germany Hybrid Power Solutions Market Revenue (Million) Forecast, by Application 2019 & 2032
- Table 11: United Kingdom Hybrid Power Solutions Market Revenue (Million) Forecast, by Application 2019 & 2032
- Table 12: Italy Hybrid Power Solutions Market Revenue (Million) Forecast, by Application 2019 & 2032
- Table 13: France Hybrid Power Solutions Market Revenue (Million) Forecast, by Application 2019 & 2032
- Table 14: Rest of Europe Hybrid Power Solutions Market Revenue (Million) Forecast, by Application 2019 & 2032
- Table 15: Global Hybrid Power Solutions Market Revenue Million Forecast, by Country 2019 & 2032
- Table 16: China Hybrid Power Solutions Market Revenue (Million) Forecast, by Application 2019 & 2032
- Table 17: India Hybrid Power Solutions Market Revenue (Million) Forecast, by Application 2019 & 2032
- Table 18: Australia Hybrid Power Solutions Market Revenue (Million) Forecast, by Application 2019 & 2032
- Table 19: Japan Hybrid Power Solutions Market Revenue (Million) Forecast, by Application 2019 & 2032
- Table 20: South Korea Hybrid Power Solutions Market Revenue (Million) Forecast, by Application 2019 & 2032
- Table 21: Rest of Asia Pacific Hybrid Power Solutions Market Revenue (Million) Forecast, by Application 2019 & 2032
- Table 22: Global Hybrid Power Solutions Market Revenue Million Forecast, by Country 2019 & 2032
- Table 23: Brazil Hybrid Power Solutions Market Revenue (Million) Forecast, by Application 2019 & 2032
- Table 24: Argentina Hybrid Power Solutions Market Revenue (Million) Forecast, by Application 2019 & 2032
- Table 25: Rest of South America Hybrid Power Solutions Market Revenue (Million) Forecast, by Application 2019 & 2032
- Table 26: Global Hybrid Power Solutions Market Revenue Million Forecast, by Country 2019 & 2032
- Table 27: Saudi Arabia Hybrid Power Solutions Market Revenue (Million) Forecast, by Application 2019 & 2032
- Table 28: United Arab Emirates Hybrid Power Solutions Market Revenue (Million) Forecast, by Application 2019 & 2032
- Table 29: Egypt Hybrid Power Solutions Market Revenue (Million) Forecast, by Application 2019 & 2032
- Table 30: South Afrcia Hybrid Power Solutions Market Revenue (Million) Forecast, by Application 2019 & 2032
- Table 31: Rest of Middle East and Africa Hybrid Power Solutions Market Revenue (Million) Forecast, by Application 2019 & 2032
- Table 32: Global Hybrid Power Solutions Market Revenue Million Forecast, by Configuration 2019 & 2032
- Table 33: Global Hybrid Power Solutions Market Revenue Million Forecast, by End-User 2019 & 2032
- Table 34: Global Hybrid Power Solutions Market Revenue Million Forecast, by Country 2019 & 2032
- Table 35: United States Hybrid Power Solutions Market Revenue (Million) Forecast, by Application 2019 & 2032
- Table 36: Canada Hybrid Power Solutions Market Revenue (Million) Forecast, by Application 2019 & 2032
- Table 37: Rest of North America Hybrid Power Solutions Market Revenue (Million) Forecast, by Application 2019 & 2032
- Table 38: Global Hybrid Power Solutions Market Revenue Million Forecast, by Configuration 2019 & 2032
- Table 39: Global Hybrid Power Solutions Market Revenue Million Forecast, by End-User 2019 & 2032
- Table 40: Global Hybrid Power Solutions Market Revenue Million Forecast, by Country 2019 & 2032
- Table 41: Germany Hybrid Power Solutions Market Revenue (Million) Forecast, by Application 2019 & 2032
- Table 42: United Kingdom Hybrid Power Solutions Market Revenue (Million) Forecast, by Application 2019 & 2032
- Table 43: Italy Hybrid Power Solutions Market Revenue (Million) Forecast, by Application 2019 & 2032
- Table 44: France Hybrid Power Solutions Market Revenue (Million) Forecast, by Application 2019 & 2032
- Table 45: Rest of Europe Hybrid Power Solutions Market Revenue (Million) Forecast, by Application 2019 & 2032
- Table 46: Global Hybrid Power Solutions Market Revenue Million Forecast, by Configuration 2019 & 2032
- Table 47: Global Hybrid Power Solutions Market Revenue Million Forecast, by End-User 2019 & 2032
- Table 48: Global Hybrid Power Solutions Market Revenue Million Forecast, by Country 2019 & 2032
- Table 49: China Hybrid Power Solutions Market Revenue (Million) Forecast, by Application 2019 & 2032
- Table 50: India Hybrid Power Solutions Market Revenue (Million) Forecast, by Application 2019 & 2032
- Table 51: Australia Hybrid Power Solutions Market Revenue (Million) Forecast, by Application 2019 & 2032
- Table 52: Japan Hybrid Power Solutions Market Revenue (Million) Forecast, by Application 2019 & 2032
- Table 53: South Korea Hybrid Power Solutions Market Revenue (Million) Forecast, by Application 2019 & 2032
- Table 54: Rest of Asia Pacific Hybrid Power Solutions Market Revenue (Million) Forecast, by Application 2019 & 2032
- Table 55: Global Hybrid Power Solutions Market Revenue Million Forecast, by Configuration 2019 & 2032
- Table 56: Global Hybrid Power Solutions Market Revenue Million Forecast, by End-User 2019 & 2032
- Table 57: Global Hybrid Power Solutions Market Revenue Million Forecast, by Country 2019 & 2032
- Table 58: Brazil Hybrid Power Solutions Market Revenue (Million) Forecast, by Application 2019 & 2032
- Table 59: Argentina Hybrid Power Solutions Market Revenue (Million) Forecast, by Application 2019 & 2032
- Table 60: Rest of South America Hybrid Power Solutions Market Revenue (Million) Forecast, by Application 2019 & 2032
- Table 61: Global Hybrid Power Solutions Market Revenue Million Forecast, by Configuration 2019 & 2032
- Table 62: Global Hybrid Power Solutions Market Revenue Million Forecast, by End-User 2019 & 2032
- Table 63: Global Hybrid Power Solutions Market Revenue Million Forecast, by Country 2019 & 2032
- Table 64: Saudi Arabia Hybrid Power Solutions Market Revenue (Million) Forecast, by Application 2019 & 2032
- Table 65: United Arab Emirates Hybrid Power Solutions Market Revenue (Million) Forecast, by Application 2019 & 2032
- Table 66: Egypt Hybrid Power Solutions Market Revenue (Million) Forecast, by Application 2019 & 2032
- Table 67: South Afrcia Hybrid Power Solutions Market Revenue (Million) Forecast, by Application 2019 & 2032
- Table 68: Rest of Middle East and Africa Hybrid Power Solutions Market Revenue (Million) Forecast, by Application 2019 & 2032
Frequently Asked Questions
1. What is the projected Compound Annual Growth Rate (CAGR) of the Hybrid Power Solutions Market?
The projected CAGR is approximately 10.70%.
2. Which companies are prominent players in the Hybrid Power Solutions Market?
Key companies in the market include Danvest BV, Engie SA, Huawei Investment & Holding Co Ltd, Silver Power Systems, Eltek Ltd, Siemens Gamesa Renewable Energy SA, Vergnet SA*List Not Exhaustive, General Electric Company, SMA Solar Technology AG.
3. What are the main segments of the Hybrid Power Solutions Market?
The market segments include Configuration, End-User.
4. Can you provide details about the market size?
The market size is estimated to be USD 2.51 Million as of 2022.
5. What are some drivers contributing to market growth?
4.; Growing Environmental Concerns4.; Supportive Government Policies.
6. What are the notable trends driving market growth?
Solar Generator Hybrid Segment to Dominate the Market.
7. Are there any restraints impacting market growth?
4.; High Initial Capital Investment.
8. Can you provide examples of recent developments in the market?
February 2023: Prolectric Services Ltd launched its latest solar energy hybrid power systems that can be deployed in remote locations. The power system ProPower 3-Phase Solar Hybrid Power unit is a high-performance system that brings 60 kw of hybrid (pass-through) power output to worksites, helping cut carbon emissions and reduce diesel use.
9. What pricing options are available for accessing the report?
Pricing options include single-user, multi-user, and enterprise licenses priced at USD 4750, USD 5250, and USD 8750 respectively.
10. Is the market size provided in terms of value or volume?
The market size is provided in terms of value, measured in Million.
11. Are there any specific market keywords associated with the report?
Yes, the market keyword associated with the report is "Hybrid Power Solutions Market," which aids in identifying and referencing the specific market segment covered.
12. How do I determine which pricing option suits my needs best?
The pricing options vary based on user requirements and access needs. Individual users may opt for single-user licenses, while businesses requiring broader access may choose multi-user or enterprise licenses for cost-effective access to the report.
13. Are there any additional resources or data provided in the Hybrid Power Solutions Market report?
While the report offers comprehensive insights, it's advisable to review the specific contents or supplementary materials provided to ascertain if additional resources or data are available.
14. How can I stay updated on further developments or reports in the Hybrid Power Solutions Market?
To stay informed about further developments, trends, and reports in the Hybrid Power Solutions Market, consider subscribing to industry newsletters, following relevant companies and organizations, or regularly checking reputable industry news sources and publications.
Methodology
Step 1 - Identification of Relevant Samples Size from Population Database


Step 2 - Approaches for Defining Global Market Size (Value, Volume* & Price*)

Note*: In applicable scenarios
Step 3 - Data Sources
Primary Research
- Web Analytics
- Survey Reports
- Research Institute
- Latest Research Reports
- Opinion Leaders
Secondary Research
- Annual Reports
- White Paper
- Latest Press Release
- Industry Association
- Paid Database
- Investor Presentations

Step 4 - Data Triangulation
Involves using different sources of information in order to increase the validity of a study
These sources are likely to be stakeholders in a program - participants, other researchers, program staff, other community members, and so on.
Then we put all data in single framework & apply various statistical tools to find out the dynamic on the market.
During the analysis stage, feedback from the stakeholder groups would be compared to determine areas of agreement as well as areas of divergence


