

Key Insights
The Hematopoietic Stem Cell Transplantation (HSCT) market is demonstrating significant expansion, propelled by the rising incidence of hematological malignancies, including leukemia and lymphoproliferative disorders. Enhanced transplantation methodologies and advanced supportive care further contribute to this growth trajectory. The market, valued at approximately $3.56 billion in 2025, is forecast to grow at a Compound Annual Growth Rate (CAGR) of 11.2% from 2025 to 2033. Key drivers include an aging global population with a higher susceptibility to blood cancers, increased public awareness, and improved diagnostic capabilities facilitating early detection and intervention. Furthermore, the development of less toxic conditioning regimens is reducing transplant-related complications. Allogeneic transplants represent a substantial market segment, offering broader therapeutic applications than autologous transplants. While bone marrow transplants currently lead in application, peripheral blood stem cell transplants are experiencing accelerated growth due to their minimally invasive nature and accessible stem cell source. North America and Europe maintain dominant market shares, attributed to well-established healthcare infrastructures and high HSCT procedure adoption rates. Conversely, the Asia-Pacific region is anticipated to witness substantial growth, driven by increasing disposable incomes and escalating investments in healthcare infrastructure within developing economies.
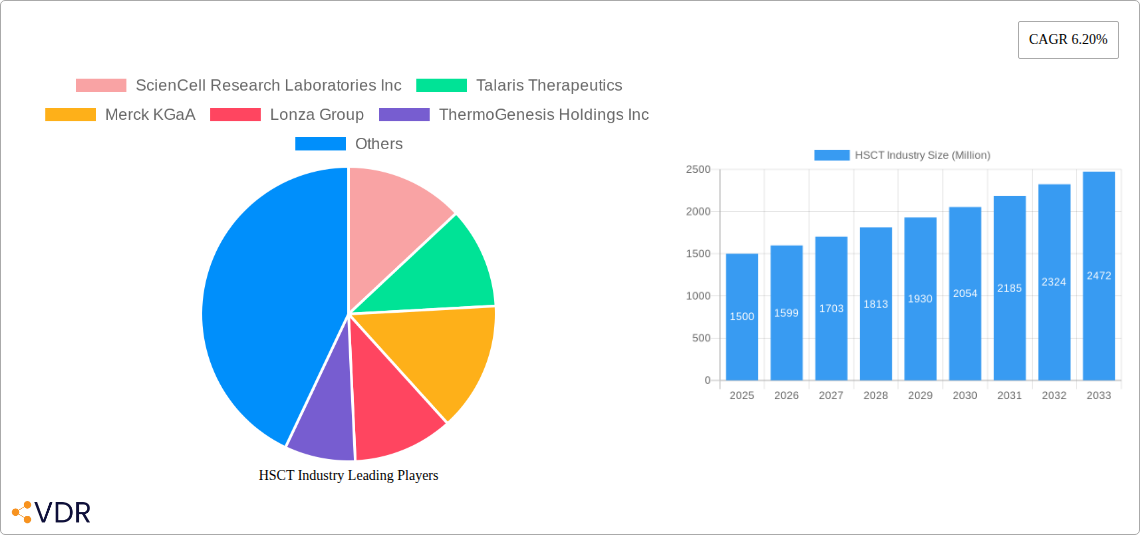
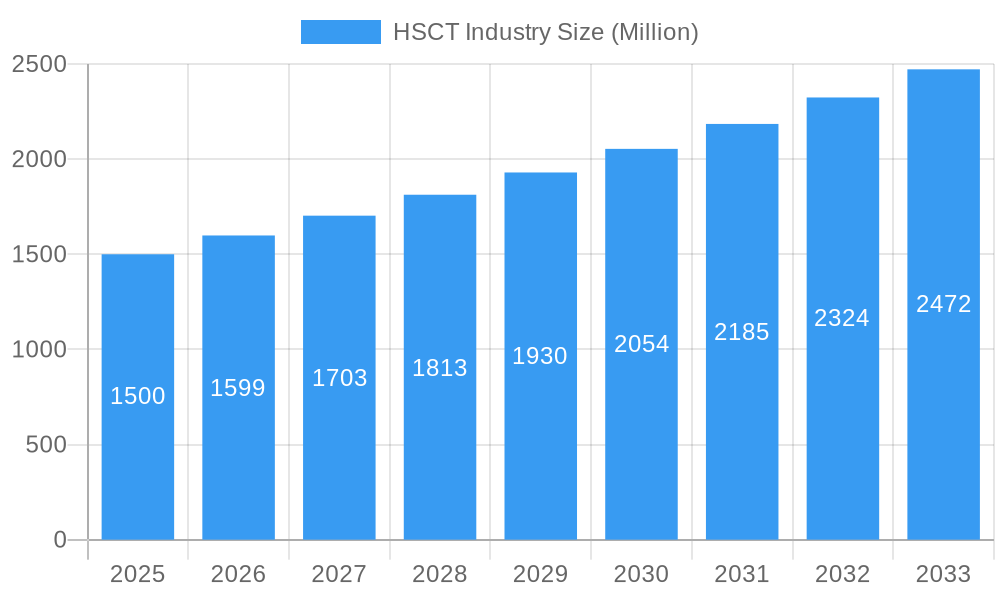
HSCT Industry Market Size (In Billion)
The competitive environment features a blend of global corporations and specialized biotechnology firms. Leading entities such as Merck KGaA, Lonza Group, and Thermo Fisher Scientific are solidifying their market standing through their expertise in cell processing and therapeutic solutions. Niche companies are innovating with new technologies and therapies to elevate treatment outcomes and broaden HSCT applications. Market impediments include the substantial cost of procedures, the intricate nature of transplantation requiring specialized expertise, and the potential for complications like graft-versus-host disease. Nevertheless, sustained research and development focused on improving transplant efficacy and safety, alongside a growing demand for effective cancer therapies, are expected to foster considerable market expansion throughout the projected period.
HSCT Industry Company Market Share
Hematopoietic Stem Cell Transplant (HSCT) Industry Market Report: 2019-2033
This comprehensive report provides a detailed analysis of the Hematopoietic Stem Cell Transplant (HSCT) industry, encompassing market dynamics, growth trends, competitive landscape, and future outlook. With a focus on the parent market of cell therapy and the child market of HSCT, this report is an invaluable resource for industry professionals, investors, and researchers seeking to understand this rapidly evolving sector. The study period covers 2019-2033, with 2025 as the base and estimated year. The forecast period is 2025-2033, and the historical period is 2019-2024. Market values are presented in million units.
HSCT Industry Market Dynamics & Structure
The HSCT market is characterized by moderate concentration, with key players driving innovation and market share. Technological advancements, particularly in cell processing and cryopreservation, are key growth drivers. Stringent regulatory frameworks, including FDA approvals, significantly influence market access and adoption. Competitive substitutes, such as alternative cancer therapies, exert pressure on market growth. The end-user demographic is primarily comprised of patients with hematological malignancies and other life-threatening conditions. Mergers and acquisitions (M&A) activity is expected to increase, consolidating market share and accelerating innovation.
- Market Concentration: Moderately concentrated, with top 10 players holding approximately xx% of market share in 2025.
- Technological Innovation: Focus on automation, improved cell processing techniques, and advanced cryopreservation methods.
- Regulatory Landscape: Stringent FDA approvals and international regulatory compliance requirements.
- Competitive Substitutes: Alternative cancer therapies, impacting market penetration.
- End-User Demographics: Predominantly patients with hematological malignancies (Leukemia, Lymphoma) and non-malignant disorders.
- M&A Activity: Projected increase in M&A activity over the forecast period, with xx deals expected between 2025 and 2033.
HSCT Industry Growth Trends & Insights
The global HSCT market is experiencing robust growth, driven by increasing prevalence of hematological malignancies, rising demand for effective treatment options, and technological advancements. The market size is projected to reach xx million units by 2033, exhibiting a CAGR of xx% during the forecast period (2025-2033). Adoption rates are increasing due to improved clinical outcomes and expanding indications. Technological disruptions, such as the development of novel cell processing technologies and personalized therapies, are further accelerating growth. Consumer behavior shifts toward personalized medicine and advanced treatments influence market dynamics.
Dominant Regions, Countries, or Segments in HSCT Industry
North America currently dominates the HSCT market, driven by high healthcare expenditure, advanced infrastructure, and a robust regulatory framework. Within North America, the United States holds the largest market share, followed by Canada. Europe is another significant market, with Germany and the UK leading the regional growth.
By Type: Allogeneic transplants are expected to witness higher growth owing to the expanding availability of matched unrelated donors and growing acceptance of this approach. By Indication: Leukemia remains the largest indication, followed by lymphoproliferative disorders. Non-malignant disorders are gaining traction. By Application: Bone marrow transplantation currently holds the largest segment of the market, while peripheral blood stem cell transplant is expected to show higher growth due to its minimal invasiveness.
- Key Drivers (North America): High healthcare expenditure, advanced medical infrastructure, strong regulatory support, higher prevalence of targeted diseases.
- Key Drivers (Europe): Increasing public awareness, government initiatives to improve healthcare access, a growing number of specialized transplant centers.
- Growth Potential: Significant growth potential exists in emerging markets in Asia-Pacific and Latin America.
HSCT Industry Product Landscape
The HSCT product landscape encompasses a wide range of products, including cell processing technologies, cryopreservation systems, and ancillary products. Recent innovations focus on improving cell viability, reducing processing time, and enhancing transplantation outcomes. Unique selling propositions center around improved efficacy, reduced toxicity, and personalized treatment approaches. Technological advancements include automation, closed-system processing, and point-of-care diagnostics.
Key Drivers, Barriers & Challenges in HSCT Industry
Key Drivers:
- Rising prevalence of hematological malignancies and other life-threatening conditions.
- Technological advancements leading to improved transplantation outcomes and reduced side effects.
- Increasing awareness and acceptance of HSCT as a treatment option.
Challenges:
- High cost of HSCT procedures, limiting access for patients in low-income countries.
- Stringent regulatory requirements and long approval processes.
- Potential risks and side effects associated with HSCT, including graft-versus-host disease (GVHD).
- Supply chain complexities and donor shortages (estimated impact: xx million units reduction in annual market potential).
Emerging Opportunities in HSCT Industry
- Expansion into emerging markets with unmet medical needs.
- Development of novel cell processing technologies and personalized therapies.
- Growing interest in cord blood transplantation and alternative stem cell sources.
- Increasing focus on improving patient outcomes and reducing treatment-related complications.
Growth Accelerators in the HSCT Industry
Technological breakthroughs in cell manipulation, improved cryopreservation techniques, and the development of new, less toxic conditioning regimens are significantly accelerating HSCT market growth. Strategic partnerships between pharmaceutical companies and research institutions are fostering innovation and expanding market access. Expansion into emerging markets and an increase in clinical trials focusing on novel applications are also contributing to market growth.
Key Players Shaping the HSCT Industry Market
- ScienCell Research Laboratories Inc
- Talaris Therapeutics
- Merck KGaA
- Lonza Group
- ThermoGenesis Holdings Inc
- STEMCELL Technologies Inc
- Pluristem Therapeutics Inc
- Sartorius CellGenix GmbH (CellGenix GmbH)
- Thermo Fisher Scientific
Notable Milestones in HSCT Industry Sector
- May 2022: Priothera received FDA clearance for a Phase 2b/3 study of mocravimod in AML patients undergoing allogeneic HSCT. This signifies progress in developing new therapies to improve outcomes in high-risk patients.
- December 2021: FDA approval of a treatment to prevent acute GVHD in patients ≥2 years old receiving HSCT from matched or single-HLA-mismatched unrelated donors. This significantly improves the safety and efficacy of HSCT procedures.
In-Depth HSCT Industry Market Outlook
The HSCT market is poised for significant growth over the next decade, driven by technological innovations, expanding indications, and increasing patient awareness. Strategic partnerships, acquisitions, and the development of novel cell therapies will shape the competitive landscape. The focus on personalized medicine and improved patient outcomes presents substantial opportunities for market players to develop innovative and effective HSCT solutions. The market is expected to achieve xx million units by 2033, representing significant growth potential for stakeholders.
HSCT Industry Segmentation
-
1. Type
- 1.1. Autologous Transplant
- 1.2. Allogenic Transplant
-
2. Indication
- 2.1. Leukemia
- 2.2. Lymphoproliferative Disorders
- 2.3. Non-Malignant Disorders
-
3. Application
- 3.1. Bone Marrow Transplant
- 3.2. Peripheral Blood Stem Cell Transplant
- 3.3. Cord Blood Transplant
HSCT Industry Segmentation By Geography
-
1. North America
- 1.1. United States
- 1.2. Canada
- 1.3. Mexico
-
2. Europe
- 2.1. Germany
- 2.2. United Kingdom
- 2.3. France
- 2.4. Italy
- 2.5. Spain
- 2.6. Rest of Europe
-
3. Asia Pacific
- 3.1. China
- 3.2. Japan
- 3.3. India
- 3.4. Australia
- 3.5. South Korea
- 3.6. Rest of Asia Pacific
-
4. Middle East and Africa
- 4.1. GCC
- 4.2. South Africa
- 4.3. Rest of Middle East and Africa
-
5. South America
- 5.1. Brazil
- 5.2. Argentina
- 5.3. Rest of South America
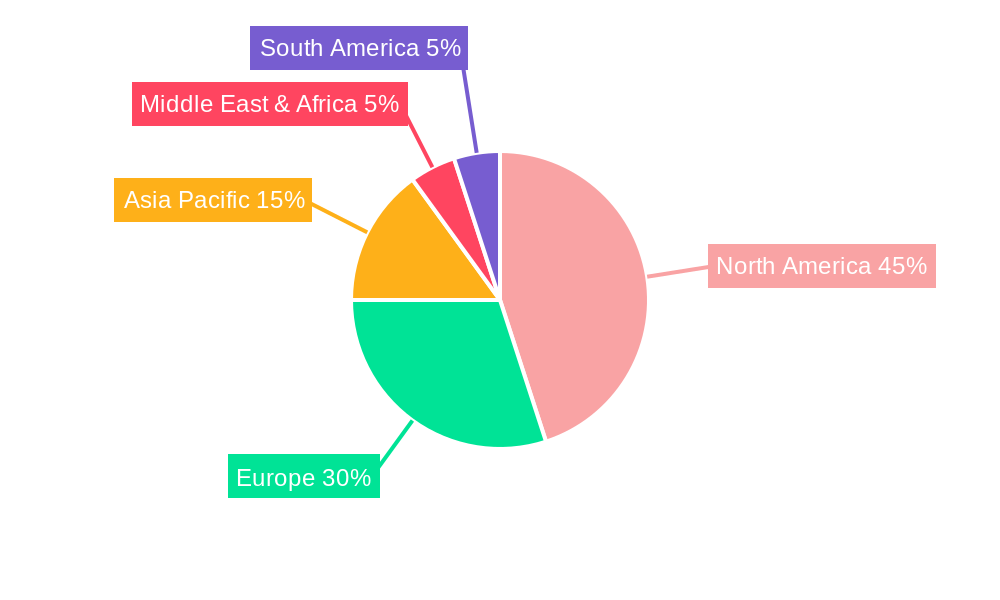
HSCT Industry Regional Market Share
Geographic Coverage of HSCT Industry
HSCT Industry REPORT HIGHLIGHTS
| Aspects | Details |
|---|---|
| Study Period | 2020-2034 |
| Base Year | 2025 |
| Estimated Year | 2026 |
| Forecast Period | 2026-2034 |
| Historical Period | 2020-2025 |
| Growth Rate | CAGR of 11.2% from 2020-2034 |
| Segmentation |
|
Table of Contents
- 1. Introduction
- 1.1. Research Scope
- 1.2. Market Segmentation
- 1.3. Research Objective
- 1.4. Definitions and Assumptions
- 2. Executive Summary
- 2.1. Market Snapshot
- 3. Market Dynamics
- 3.1. Market Drivers
- 3.2. Market Restrains
- 3.3. Market Trends
- 3.4. Market Opportunities
- 4. Market Factor Analysis
- 4.1. Porters Five Forces
- 4.1.1. Bargaining Power of Suppliers
- 4.1.2. Bargaining Power of Buyers
- 4.1.3. Threat of New Entrants
- 4.1.4. Threat of Substitutes
- 4.1.5. Competitive Rivalry
- 4.2. PESTEL analysis
- 4.3. BCG Analysis
- 4.3.1. Stars (High Growth, High Market Share)
- 4.3.2. Cash Cows (Low Growth, High Market Share)
- 4.3.3. Question Mark (High Growth, Low Market Share)
- 4.3.4. Dogs (Low Growth, Low Market Share)
- 4.4. Ansoff Matrix Analysis
- 4.5. Supply Chain Analysis
- 4.6. Regulatory Landscape
- 4.7. Current Market Potential and Opportunity Assessment (TAM–SAM–SOM Framework)
- 4.8. VDR Analyst Note
- 4.1. Porters Five Forces
- 5. Market Analysis, Insights and Forecast 2021-2033
- 5.1. Market Analysis, Insights and Forecast - by Type
- 5.1.1. Autologous Transplant
- 5.1.2. Allogenic Transplant
- 5.2. Market Analysis, Insights and Forecast - by Indication
- 5.2.1. Leukemia
- 5.2.2. Lymphoproliferative Disorders
- 5.2.3. Non-Malignant Disorders
- 5.3. Market Analysis, Insights and Forecast - by Application
- 5.3.1. Bone Marrow Transplant
- 5.3.2. Peripheral Blood Stem Cell Transplant
- 5.3.3. Cord Blood Transplant
- 5.4. Market Analysis, Insights and Forecast - by Region
- 5.4.1. North America
- 5.4.2. Europe
- 5.4.3. Asia Pacific
- 5.4.4. Middle East and Africa
- 5.4.5. South America
- 5.1. Market Analysis, Insights and Forecast - by Type
- 6. Global HSCT Industry Analysis, Insights and Forecast, 2021-2033
- 6.1. Market Analysis, Insights and Forecast - by Type
- 6.1.1. Autologous Transplant
- 6.1.2. Allogenic Transplant
- 6.2. Market Analysis, Insights and Forecast - by Indication
- 6.2.1. Leukemia
- 6.2.2. Lymphoproliferative Disorders
- 6.2.3. Non-Malignant Disorders
- 6.3. Market Analysis, Insights and Forecast - by Application
- 6.3.1. Bone Marrow Transplant
- 6.3.2. Peripheral Blood Stem Cell Transplant
- 6.3.3. Cord Blood Transplant
- 6.1. Market Analysis, Insights and Forecast - by Type
- 7. North America HSCT Industry Analysis, Insights and Forecast, 2021-2033
- 7.1. Market Analysis, Insights and Forecast - by Type
- 7.1.1. Autologous Transplant
- 7.1.2. Allogenic Transplant
- 7.2. Market Analysis, Insights and Forecast - by Indication
- 7.2.1. Leukemia
- 7.2.2. Lymphoproliferative Disorders
- 7.2.3. Non-Malignant Disorders
- 7.3. Market Analysis, Insights and Forecast - by Application
- 7.3.1. Bone Marrow Transplant
- 7.3.2. Peripheral Blood Stem Cell Transplant
- 7.3.3. Cord Blood Transplant
- 7.1. Market Analysis, Insights and Forecast - by Type
- 8. Europe HSCT Industry Analysis, Insights and Forecast, 2021-2033
- 8.1. Market Analysis, Insights and Forecast - by Type
- 8.1.1. Autologous Transplant
- 8.1.2. Allogenic Transplant
- 8.2. Market Analysis, Insights and Forecast - by Indication
- 8.2.1. Leukemia
- 8.2.2. Lymphoproliferative Disorders
- 8.2.3. Non-Malignant Disorders
- 8.3. Market Analysis, Insights and Forecast - by Application
- 8.3.1. Bone Marrow Transplant
- 8.3.2. Peripheral Blood Stem Cell Transplant
- 8.3.3. Cord Blood Transplant
- 8.1. Market Analysis, Insights and Forecast - by Type
- 9. Asia Pacific HSCT Industry Analysis, Insights and Forecast, 2021-2033
- 9.1. Market Analysis, Insights and Forecast - by Type
- 9.1.1. Autologous Transplant
- 9.1.2. Allogenic Transplant
- 9.2. Market Analysis, Insights and Forecast - by Indication
- 9.2.1. Leukemia
- 9.2.2. Lymphoproliferative Disorders
- 9.2.3. Non-Malignant Disorders
- 9.3. Market Analysis, Insights and Forecast - by Application
- 9.3.1. Bone Marrow Transplant
- 9.3.2. Peripheral Blood Stem Cell Transplant
- 9.3.3. Cord Blood Transplant
- 9.1. Market Analysis, Insights and Forecast - by Type
- 10. Middle East and Africa HSCT Industry Analysis, Insights and Forecast, 2021-2033
- 10.1. Market Analysis, Insights and Forecast - by Type
- 10.1.1. Autologous Transplant
- 10.1.2. Allogenic Transplant
- 10.2. Market Analysis, Insights and Forecast - by Indication
- 10.2.1. Leukemia
- 10.2.2. Lymphoproliferative Disorders
- 10.2.3. Non-Malignant Disorders
- 10.3. Market Analysis, Insights and Forecast - by Application
- 10.3.1. Bone Marrow Transplant
- 10.3.2. Peripheral Blood Stem Cell Transplant
- 10.3.3. Cord Blood Transplant
- 10.1. Market Analysis, Insights and Forecast - by Type
- 11. South America HSCT Industry Analysis, Insights and Forecast, 2021-2033
- 11.1. Market Analysis, Insights and Forecast - by Type
- 11.1.1. Autologous Transplant
- 11.1.2. Allogenic Transplant
- 11.2. Market Analysis, Insights and Forecast - by Indication
- 11.2.1. Leukemia
- 11.2.2. Lymphoproliferative Disorders
- 11.2.3. Non-Malignant Disorders
- 11.3. Market Analysis, Insights and Forecast - by Application
- 11.3.1. Bone Marrow Transplant
- 11.3.2. Peripheral Blood Stem Cell Transplant
- 11.3.3. Cord Blood Transplant
- 11.1. Market Analysis, Insights and Forecast - by Type
- 12. Competitive Analysis
- 12.1. Company Profiles
- 12.1.1 ScienCell Research Laboratories Inc
- 12.1.1.1. Company Overview
- 12.1.1.2. Products
- 12.1.1.3. Company Financials
- 12.1.1.4. SWOT Analysis
- 12.1.2 Talaris Therapeutics
- 12.1.2.1. Company Overview
- 12.1.2.2. Products
- 12.1.2.3. Company Financials
- 12.1.2.4. SWOT Analysis
- 12.1.3 Merck KGaA
- 12.1.3.1. Company Overview
- 12.1.3.2. Products
- 12.1.3.3. Company Financials
- 12.1.3.4. SWOT Analysis
- 12.1.4 Lonza Group
- 12.1.4.1. Company Overview
- 12.1.4.2. Products
- 12.1.4.3. Company Financials
- 12.1.4.4. SWOT Analysis
- 12.1.5 ThermoGenesis Holdings Inc
- 12.1.5.1. Company Overview
- 12.1.5.2. Products
- 12.1.5.3. Company Financials
- 12.1.5.4. SWOT Analysis
- 12.1.6 STEMCELL Technologies Inc
- 12.1.6.1. Company Overview
- 12.1.6.2. Products
- 12.1.6.3. Company Financials
- 12.1.6.4. SWOT Analysis
- 12.1.7 Pluristem Therapeutics Inc
- 12.1.7.1. Company Overview
- 12.1.7.2. Products
- 12.1.7.3. Company Financials
- 12.1.7.4. SWOT Analysis
- 12.1.8 Sartorius CellGenix GmbH (CellGenix GmbH)
- 12.1.8.1. Company Overview
- 12.1.8.2. Products
- 12.1.8.3. Company Financials
- 12.1.8.4. SWOT Analysis
- 12.1.9 Thermo Fisher Scientific
- 12.1.9.1. Company Overview
- 12.1.9.2. Products
- 12.1.9.3. Company Financials
- 12.1.9.4. SWOT Analysis
- 12.1.1 ScienCell Research Laboratories Inc
- 12.2. Market Entropy
- 12.2.1 Company's Key Areas Served
- 12.2.2 Recent Developments
- 12.3. Company Market Share Analysis 2025
- 12.3.1 Top 5 Companies Market Share Analysis
- 12.3.2 Top 3 Companies Market Share Analysis
- 12.4. List of Potential Customers
- 13. Research Methodology
List of Figures
- Figure 1: Global HSCT Industry Revenue Breakdown (billion, %) by Region 2025 & 2033
- Figure 2: Global HSCT Industry Volume Breakdown (K Unit, %) by Region 2025 & 2033
- Figure 3: North America HSCT Industry Revenue (billion), by Type 2025 & 2033
- Figure 4: North America HSCT Industry Volume (K Unit), by Type 2025 & 2033
- Figure 5: North America HSCT Industry Revenue Share (%), by Type 2025 & 2033
- Figure 6: North America HSCT Industry Volume Share (%), by Type 2025 & 2033
- Figure 7: North America HSCT Industry Revenue (billion), by Indication 2025 & 2033
- Figure 8: North America HSCT Industry Volume (K Unit), by Indication 2025 & 2033
- Figure 9: North America HSCT Industry Revenue Share (%), by Indication 2025 & 2033
- Figure 10: North America HSCT Industry Volume Share (%), by Indication 2025 & 2033
- Figure 11: North America HSCT Industry Revenue (billion), by Application 2025 & 2033
- Figure 12: North America HSCT Industry Volume (K Unit), by Application 2025 & 2033
- Figure 13: North America HSCT Industry Revenue Share (%), by Application 2025 & 2033
- Figure 14: North America HSCT Industry Volume Share (%), by Application 2025 & 2033
- Figure 15: North America HSCT Industry Revenue (billion), by Country 2025 & 2033
- Figure 16: North America HSCT Industry Volume (K Unit), by Country 2025 & 2033
- Figure 17: North America HSCT Industry Revenue Share (%), by Country 2025 & 2033
- Figure 18: North America HSCT Industry Volume Share (%), by Country 2025 & 2033
- Figure 19: Europe HSCT Industry Revenue (billion), by Type 2025 & 2033
- Figure 20: Europe HSCT Industry Volume (K Unit), by Type 2025 & 2033
- Figure 21: Europe HSCT Industry Revenue Share (%), by Type 2025 & 2033
- Figure 22: Europe HSCT Industry Volume Share (%), by Type 2025 & 2033
- Figure 23: Europe HSCT Industry Revenue (billion), by Indication 2025 & 2033
- Figure 24: Europe HSCT Industry Volume (K Unit), by Indication 2025 & 2033
- Figure 25: Europe HSCT Industry Revenue Share (%), by Indication 2025 & 2033
- Figure 26: Europe HSCT Industry Volume Share (%), by Indication 2025 & 2033
- Figure 27: Europe HSCT Industry Revenue (billion), by Application 2025 & 2033
- Figure 28: Europe HSCT Industry Volume (K Unit), by Application 2025 & 2033
- Figure 29: Europe HSCT Industry Revenue Share (%), by Application 2025 & 2033
- Figure 30: Europe HSCT Industry Volume Share (%), by Application 2025 & 2033
- Figure 31: Europe HSCT Industry Revenue (billion), by Country 2025 & 2033
- Figure 32: Europe HSCT Industry Volume (K Unit), by Country 2025 & 2033
- Figure 33: Europe HSCT Industry Revenue Share (%), by Country 2025 & 2033
- Figure 34: Europe HSCT Industry Volume Share (%), by Country 2025 & 2033
- Figure 35: Asia Pacific HSCT Industry Revenue (billion), by Type 2025 & 2033
- Figure 36: Asia Pacific HSCT Industry Volume (K Unit), by Type 2025 & 2033
- Figure 37: Asia Pacific HSCT Industry Revenue Share (%), by Type 2025 & 2033
- Figure 38: Asia Pacific HSCT Industry Volume Share (%), by Type 2025 & 2033
- Figure 39: Asia Pacific HSCT Industry Revenue (billion), by Indication 2025 & 2033
- Figure 40: Asia Pacific HSCT Industry Volume (K Unit), by Indication 2025 & 2033
- Figure 41: Asia Pacific HSCT Industry Revenue Share (%), by Indication 2025 & 2033
- Figure 42: Asia Pacific HSCT Industry Volume Share (%), by Indication 2025 & 2033
- Figure 43: Asia Pacific HSCT Industry Revenue (billion), by Application 2025 & 2033
- Figure 44: Asia Pacific HSCT Industry Volume (K Unit), by Application 2025 & 2033
- Figure 45: Asia Pacific HSCT Industry Revenue Share (%), by Application 2025 & 2033
- Figure 46: Asia Pacific HSCT Industry Volume Share (%), by Application 2025 & 2033
- Figure 47: Asia Pacific HSCT Industry Revenue (billion), by Country 2025 & 2033
- Figure 48: Asia Pacific HSCT Industry Volume (K Unit), by Country 2025 & 2033
- Figure 49: Asia Pacific HSCT Industry Revenue Share (%), by Country 2025 & 2033
- Figure 50: Asia Pacific HSCT Industry Volume Share (%), by Country 2025 & 2033
- Figure 51: Middle East and Africa HSCT Industry Revenue (billion), by Type 2025 & 2033
- Figure 52: Middle East and Africa HSCT Industry Volume (K Unit), by Type 2025 & 2033
- Figure 53: Middle East and Africa HSCT Industry Revenue Share (%), by Type 2025 & 2033
- Figure 54: Middle East and Africa HSCT Industry Volume Share (%), by Type 2025 & 2033
- Figure 55: Middle East and Africa HSCT Industry Revenue (billion), by Indication 2025 & 2033
- Figure 56: Middle East and Africa HSCT Industry Volume (K Unit), by Indication 2025 & 2033
- Figure 57: Middle East and Africa HSCT Industry Revenue Share (%), by Indication 2025 & 2033
- Figure 58: Middle East and Africa HSCT Industry Volume Share (%), by Indication 2025 & 2033
- Figure 59: Middle East and Africa HSCT Industry Revenue (billion), by Application 2025 & 2033
- Figure 60: Middle East and Africa HSCT Industry Volume (K Unit), by Application 2025 & 2033
- Figure 61: Middle East and Africa HSCT Industry Revenue Share (%), by Application 2025 & 2033
- Figure 62: Middle East and Africa HSCT Industry Volume Share (%), by Application 2025 & 2033
- Figure 63: Middle East and Africa HSCT Industry Revenue (billion), by Country 2025 & 2033
- Figure 64: Middle East and Africa HSCT Industry Volume (K Unit), by Country 2025 & 2033
- Figure 65: Middle East and Africa HSCT Industry Revenue Share (%), by Country 2025 & 2033
- Figure 66: Middle East and Africa HSCT Industry Volume Share (%), by Country 2025 & 2033
- Figure 67: South America HSCT Industry Revenue (billion), by Type 2025 & 2033
- Figure 68: South America HSCT Industry Volume (K Unit), by Type 2025 & 2033
- Figure 69: South America HSCT Industry Revenue Share (%), by Type 2025 & 2033
- Figure 70: South America HSCT Industry Volume Share (%), by Type 2025 & 2033
- Figure 71: South America HSCT Industry Revenue (billion), by Indication 2025 & 2033
- Figure 72: South America HSCT Industry Volume (K Unit), by Indication 2025 & 2033
- Figure 73: South America HSCT Industry Revenue Share (%), by Indication 2025 & 2033
- Figure 74: South America HSCT Industry Volume Share (%), by Indication 2025 & 2033
- Figure 75: South America HSCT Industry Revenue (billion), by Application 2025 & 2033
- Figure 76: South America HSCT Industry Volume (K Unit), by Application 2025 & 2033
- Figure 77: South America HSCT Industry Revenue Share (%), by Application 2025 & 2033
- Figure 78: South America HSCT Industry Volume Share (%), by Application 2025 & 2033
- Figure 79: South America HSCT Industry Revenue (billion), by Country 2025 & 2033
- Figure 80: South America HSCT Industry Volume (K Unit), by Country 2025 & 2033
- Figure 81: South America HSCT Industry Revenue Share (%), by Country 2025 & 2033
- Figure 82: South America HSCT Industry Volume Share (%), by Country 2025 & 2033
List of Tables
- Table 1: Global HSCT Industry Revenue billion Forecast, by Type 2020 & 2033
- Table 2: Global HSCT Industry Volume K Unit Forecast, by Type 2020 & 2033
- Table 3: Global HSCT Industry Revenue billion Forecast, by Indication 2020 & 2033
- Table 4: Global HSCT Industry Volume K Unit Forecast, by Indication 2020 & 2033
- Table 5: Global HSCT Industry Revenue billion Forecast, by Application 2020 & 2033
- Table 6: Global HSCT Industry Volume K Unit Forecast, by Application 2020 & 2033
- Table 7: Global HSCT Industry Revenue billion Forecast, by Region 2020 & 2033
- Table 8: Global HSCT Industry Volume K Unit Forecast, by Region 2020 & 2033
- Table 9: Global HSCT Industry Revenue billion Forecast, by Type 2020 & 2033
- Table 10: Global HSCT Industry Volume K Unit Forecast, by Type 2020 & 2033
- Table 11: Global HSCT Industry Revenue billion Forecast, by Indication 2020 & 2033
- Table 12: Global HSCT Industry Volume K Unit Forecast, by Indication 2020 & 2033
- Table 13: Global HSCT Industry Revenue billion Forecast, by Application 2020 & 2033
- Table 14: Global HSCT Industry Volume K Unit Forecast, by Application 2020 & 2033
- Table 15: Global HSCT Industry Revenue billion Forecast, by Country 2020 & 2033
- Table 16: Global HSCT Industry Volume K Unit Forecast, by Country 2020 & 2033
- Table 17: United States HSCT Industry Revenue (billion) Forecast, by Application 2020 & 2033
- Table 18: United States HSCT Industry Volume (K Unit) Forecast, by Application 2020 & 2033
- Table 19: Canada HSCT Industry Revenue (billion) Forecast, by Application 2020 & 2033
- Table 20: Canada HSCT Industry Volume (K Unit) Forecast, by Application 2020 & 2033
- Table 21: Mexico HSCT Industry Revenue (billion) Forecast, by Application 2020 & 2033
- Table 22: Mexico HSCT Industry Volume (K Unit) Forecast, by Application 2020 & 2033
- Table 23: Global HSCT Industry Revenue billion Forecast, by Type 2020 & 2033
- Table 24: Global HSCT Industry Volume K Unit Forecast, by Type 2020 & 2033
- Table 25: Global HSCT Industry Revenue billion Forecast, by Indication 2020 & 2033
- Table 26: Global HSCT Industry Volume K Unit Forecast, by Indication 2020 & 2033
- Table 27: Global HSCT Industry Revenue billion Forecast, by Application 2020 & 2033
- Table 28: Global HSCT Industry Volume K Unit Forecast, by Application 2020 & 2033
- Table 29: Global HSCT Industry Revenue billion Forecast, by Country 2020 & 2033
- Table 30: Global HSCT Industry Volume K Unit Forecast, by Country 2020 & 2033
- Table 31: Germany HSCT Industry Revenue (billion) Forecast, by Application 2020 & 2033
- Table 32: Germany HSCT Industry Volume (K Unit) Forecast, by Application 2020 & 2033
- Table 33: United Kingdom HSCT Industry Revenue (billion) Forecast, by Application 2020 & 2033
- Table 34: United Kingdom HSCT Industry Volume (K Unit) Forecast, by Application 2020 & 2033
- Table 35: France HSCT Industry Revenue (billion) Forecast, by Application 2020 & 2033
- Table 36: France HSCT Industry Volume (K Unit) Forecast, by Application 2020 & 2033
- Table 37: Italy HSCT Industry Revenue (billion) Forecast, by Application 2020 & 2033
- Table 38: Italy HSCT Industry Volume (K Unit) Forecast, by Application 2020 & 2033
- Table 39: Spain HSCT Industry Revenue (billion) Forecast, by Application 2020 & 2033
- Table 40: Spain HSCT Industry Volume (K Unit) Forecast, by Application 2020 & 2033
- Table 41: Rest of Europe HSCT Industry Revenue (billion) Forecast, by Application 2020 & 2033
- Table 42: Rest of Europe HSCT Industry Volume (K Unit) Forecast, by Application 2020 & 2033
- Table 43: Global HSCT Industry Revenue billion Forecast, by Type 2020 & 2033
- Table 44: Global HSCT Industry Volume K Unit Forecast, by Type 2020 & 2033
- Table 45: Global HSCT Industry Revenue billion Forecast, by Indication 2020 & 2033
- Table 46: Global HSCT Industry Volume K Unit Forecast, by Indication 2020 & 2033
- Table 47: Global HSCT Industry Revenue billion Forecast, by Application 2020 & 2033
- Table 48: Global HSCT Industry Volume K Unit Forecast, by Application 2020 & 2033
- Table 49: Global HSCT Industry Revenue billion Forecast, by Country 2020 & 2033
- Table 50: Global HSCT Industry Volume K Unit Forecast, by Country 2020 & 2033
- Table 51: China HSCT Industry Revenue (billion) Forecast, by Application 2020 & 2033
- Table 52: China HSCT Industry Volume (K Unit) Forecast, by Application 2020 & 2033
- Table 53: Japan HSCT Industry Revenue (billion) Forecast, by Application 2020 & 2033
- Table 54: Japan HSCT Industry Volume (K Unit) Forecast, by Application 2020 & 2033
- Table 55: India HSCT Industry Revenue (billion) Forecast, by Application 2020 & 2033
- Table 56: India HSCT Industry Volume (K Unit) Forecast, by Application 2020 & 2033
- Table 57: Australia HSCT Industry Revenue (billion) Forecast, by Application 2020 & 2033
- Table 58: Australia HSCT Industry Volume (K Unit) Forecast, by Application 2020 & 2033
- Table 59: South Korea HSCT Industry Revenue (billion) Forecast, by Application 2020 & 2033
- Table 60: South Korea HSCT Industry Volume (K Unit) Forecast, by Application 2020 & 2033
- Table 61: Rest of Asia Pacific HSCT Industry Revenue (billion) Forecast, by Application 2020 & 2033
- Table 62: Rest of Asia Pacific HSCT Industry Volume (K Unit) Forecast, by Application 2020 & 2033
- Table 63: Global HSCT Industry Revenue billion Forecast, by Type 2020 & 2033
- Table 64: Global HSCT Industry Volume K Unit Forecast, by Type 2020 & 2033
- Table 65: Global HSCT Industry Revenue billion Forecast, by Indication 2020 & 2033
- Table 66: Global HSCT Industry Volume K Unit Forecast, by Indication 2020 & 2033
- Table 67: Global HSCT Industry Revenue billion Forecast, by Application 2020 & 2033
- Table 68: Global HSCT Industry Volume K Unit Forecast, by Application 2020 & 2033
- Table 69: Global HSCT Industry Revenue billion Forecast, by Country 2020 & 2033
- Table 70: Global HSCT Industry Volume K Unit Forecast, by Country 2020 & 2033
- Table 71: GCC HSCT Industry Revenue (billion) Forecast, by Application 2020 & 2033
- Table 72: GCC HSCT Industry Volume (K Unit) Forecast, by Application 2020 & 2033
- Table 73: South Africa HSCT Industry Revenue (billion) Forecast, by Application 2020 & 2033
- Table 74: South Africa HSCT Industry Volume (K Unit) Forecast, by Application 2020 & 2033
- Table 75: Rest of Middle East and Africa HSCT Industry Revenue (billion) Forecast, by Application 2020 & 2033
- Table 76: Rest of Middle East and Africa HSCT Industry Volume (K Unit) Forecast, by Application 2020 & 2033
- Table 77: Global HSCT Industry Revenue billion Forecast, by Type 2020 & 2033
- Table 78: Global HSCT Industry Volume K Unit Forecast, by Type 2020 & 2033
- Table 79: Global HSCT Industry Revenue billion Forecast, by Indication 2020 & 2033
- Table 80: Global HSCT Industry Volume K Unit Forecast, by Indication 2020 & 2033
- Table 81: Global HSCT Industry Revenue billion Forecast, by Application 2020 & 2033
- Table 82: Global HSCT Industry Volume K Unit Forecast, by Application 2020 & 2033
- Table 83: Global HSCT Industry Revenue billion Forecast, by Country 2020 & 2033
- Table 84: Global HSCT Industry Volume K Unit Forecast, by Country 2020 & 2033
- Table 85: Brazil HSCT Industry Revenue (billion) Forecast, by Application 2020 & 2033
- Table 86: Brazil HSCT Industry Volume (K Unit) Forecast, by Application 2020 & 2033
- Table 87: Argentina HSCT Industry Revenue (billion) Forecast, by Application 2020 & 2033
- Table 88: Argentina HSCT Industry Volume (K Unit) Forecast, by Application 2020 & 2033
- Table 89: Rest of South America HSCT Industry Revenue (billion) Forecast, by Application 2020 & 2033
- Table 90: Rest of South America HSCT Industry Volume (K Unit) Forecast, by Application 2020 & 2033
Frequently Asked Questions
1. What is the projected Compound Annual Growth Rate (CAGR) of the HSCT Industry?
The projected CAGR is approximately 11.2%.
2. Which companies are prominent players in the HSCT Industry?
Key companies in the market include ScienCell Research Laboratories Inc, Talaris Therapeutics, Merck KGaA, Lonza Group, ThermoGenesis Holdings Inc , STEMCELL Technologies Inc, Pluristem Therapeutics Inc, Sartorius CellGenix GmbH (CellGenix GmbH), Thermo Fisher Scientific.
3. What are the main segments of the HSCT Industry?
The market segments include Type, Indication, Application.
4. Can you provide details about the market size?
The market size is estimated to be USD 3.56 billion as of 2022.
5. What are some drivers contributing to market growth?
Increasing Incidence of Leukemia and Lymphoproliferative Disorders; Increasing R&D Activities by Biotechnology Companies.
6. What are the notable trends driving market growth?
Bone Marrow Transplant Segment is Expected to Witness Growth Over the Forecast Period.
7. Are there any restraints impacting market growth?
High Cost Associated with the Transplantation Procedures.
8. Can you provide examples of recent developments in the market?
In May 2022, Priothera received the United States Food and Drug Administration clearance of investigational new drug (IND) to start Phase 2b/3 study with mocravimod in Acute Myeloid Leukemia (AML) Patients undergoing Allogeneic Hematopoietic Stem Cell Transplant (HSCT).
9. What pricing options are available for accessing the report?
Pricing options include single-user, multi-user, and enterprise licenses priced at USD 4750, USD 5250, and USD 8750 respectively.
10. Is the market size provided in terms of value or volume?
The market size is provided in terms of value, measured in billion and volume, measured in K Unit.
11. Are there any specific market keywords associated with the report?
Yes, the market keyword associated with the report is "HSCT Industry," which aids in identifying and referencing the specific market segment covered.
12. How do I determine which pricing option suits my needs best?
The pricing options vary based on user requirements and access needs. Individual users may opt for single-user licenses, while businesses requiring broader access may choose multi-user or enterprise licenses for cost-effective access to the report.
13. Are there any additional resources or data provided in the HSCT Industry report?
While the report offers comprehensive insights, it's advisable to review the specific contents or supplementary materials provided to ascertain if additional resources or data are available.
14. How can I stay updated on further developments or reports in the HSCT Industry?
To stay informed about further developments, trends, and reports in the HSCT Industry, consider subscribing to industry newsletters, following relevant companies and organizations, or regularly checking reputable industry news sources and publications.
Methodology
Step 1 - Identification of Relevant Samples Size from Population Database


Step 2 - Approaches for Defining Global Market Size (Value, Volume* & Price*)

Note*: In applicable scenarios
Step 3 - Data Sources
Primary Research
- Web Analytics
- Survey Reports
- Research Institute
- Latest Research Reports
- Opinion Leaders
Secondary Research
- Annual Reports
- White Paper
- Latest Press Release
- Industry Association
- Paid Database
- Investor Presentations

Step 4 - Data Triangulation
Involves using different sources of information in order to increase the validity of a study
These sources are likely to be stakeholders in a program - participants, other researchers, program staff, other community members, and so on.
Then we put all data in single framework & apply various statistical tools to find out the dynamic on the market.
During the analysis stage, feedback from the stakeholder groups would be compared to determine areas of agreement as well as areas of divergence