Innovations Driving High Purity Quartz Market Market 2025-2033

High Purity Quartz Market by Application (Semiconductor, Solar, Lighting, Telecom and Optics, Microelectronics, Others), by Asia Pacific (China, India, Japan, South Korea, Rest of Asia Pacific), by North America (United States, Canada, Mexico), by Europe (Germany, United Kingdom, Italy, France, Rest of Europe), by South America (Brazil, Argentina, Rest of South America), by Middle East and Africa (Saudi Arabia, South Africa, Rest of Middle East and Africa) Forecast 2025-2033

Jun 30 2025
Base Year: 2024

234 Pages
Main Logo

Innovations Driving High Purity Quartz Market Market 2025-2033


Home
Industries
Chemicals & Materials
sponsor image
sponsor image
sponsor image
sponsor image

Tailored for you

  • In-depth Analysis Tailored to Specified Regions or Segments
  • Company Profiles Customized to User Preferences
  • Comprehensive Insights Focused on Specific Segments or Regions
  • Customized Evaluation of Competitive Landscape to Meet Your Needs
  • Tailored Customization to Address Other Specific Requirements
Ask for customization


Key Insights

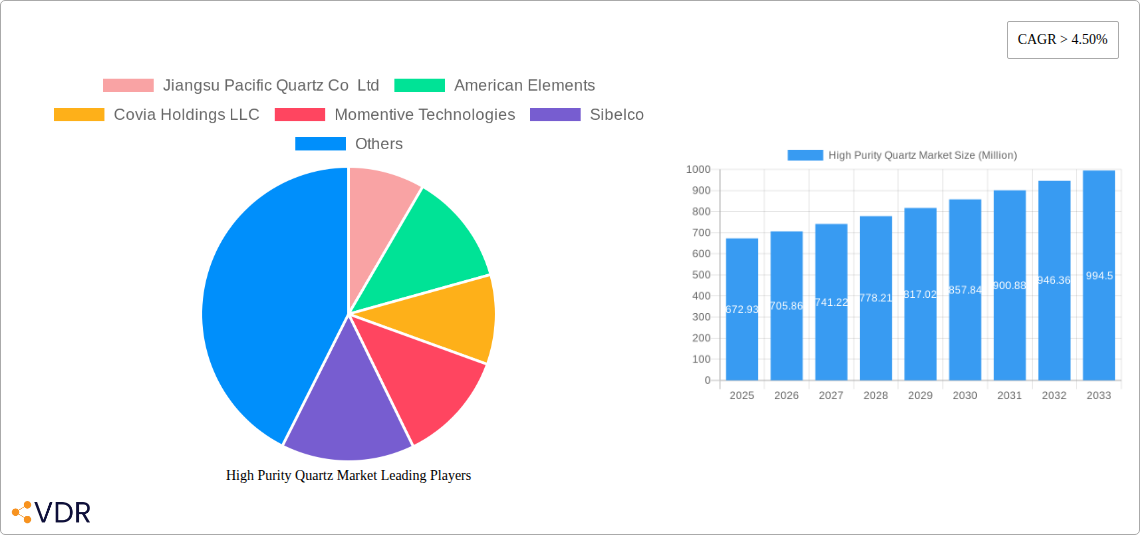
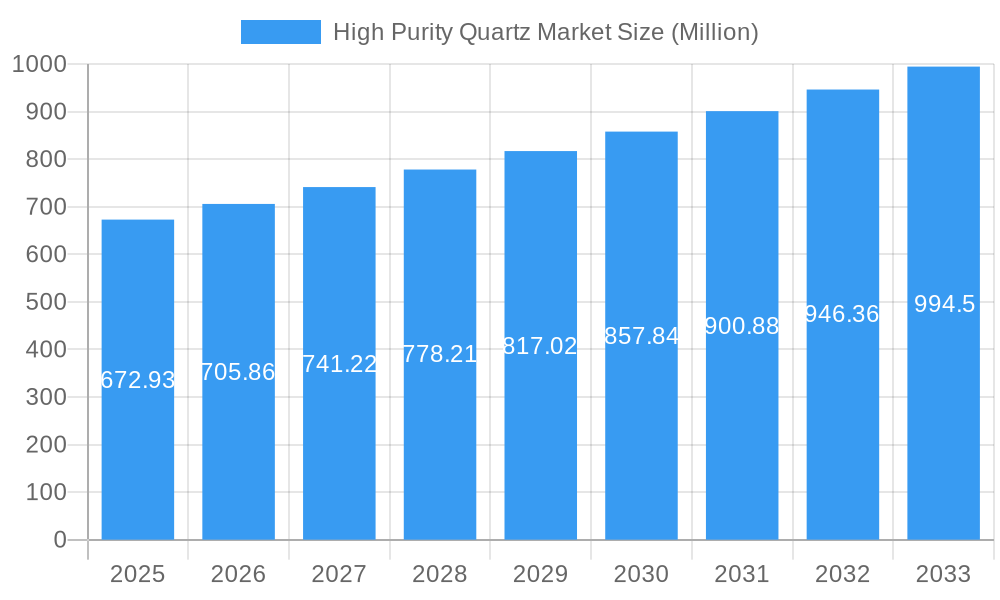
The High Purity Quartz market, valued at $672.93 million in 2025, is projected to experience robust growth, exhibiting a Compound Annual Growth Rate (CAGR) exceeding 4.50% from 2025 to 2033. This expansion is driven by the escalating demand for high-purity quartz in diverse applications, primarily within the semiconductor, solar, and optical fiber industries. The semiconductor sector's relentless pursuit of miniaturization and performance enhancement fuels the need for superior quality quartz components in manufacturing processes. Simultaneously, the burgeoning renewable energy sector, particularly solar power, necessitates large quantities of high-purity quartz for solar cell production. Advances in telecommunications and the expanding adoption of optical fibers further contribute to market growth. While the market faces constraints such as fluctuating raw material prices and the potential for supply chain disruptions, ongoing technological advancements and the increasing focus on sustainability are poised to mitigate these challenges. Specific regional growth patterns are expected, with Asia-Pacific anticipated to lead due to its significant manufacturing base and increasing investment in renewable energy technologies. North America and Europe will also maintain substantial market shares, driven by strong demand from advanced electronics and telecommunications sectors. The competitive landscape is characterized by both large multinational corporations and specialized regional players. Strategic alliances, mergers and acquisitions, and the development of innovative quartz processing techniques will shape the market's competitive dynamics in the coming years.

The market segmentation reveals the dominant roles of semiconductor and solar applications, followed by lighting, telecom and optics, and microelectronics. Growth within each segment will be influenced by specific technological trends. For instance, the increasing adoption of advanced semiconductor manufacturing processes (like EUV lithography) necessitates even higher purity quartz, driving market expansion in that specific niche. Similarly, improvements in solar cell efficiency will boost demand for high-quality quartz within the solar energy sector. Consequently, manufacturers are investing heavily in research and development to refine purification processes and improve the overall quality and yield of high-purity quartz products. This focus on innovation and continuous improvement will be a critical factor in determining future market leadership.

High Purity Quartz Market Research Report - Market Size, Growth & Forecast

High Purity Quartz Market: A Comprehensive Market Report (2019-2033)

This in-depth report provides a comprehensive analysis of the High Purity Quartz (HPQ) market, encompassing market dynamics, growth trends, regional analysis, competitive landscape, and future outlook. The report covers the period from 2019 to 2033, with 2025 as the base year and forecast period extending to 2033. The study includes detailed insights into the parent market (Quartz Market) and child market segments (Semiconductor, Solar, Lighting, Telecom & Optics, Microelectronics, and Others). The global HPQ market is projected to reach xx Million USD by 2033.

High Purity Quartz Market Market Dynamics & Structure

The High Purity Quartz market is characterized by moderate concentration, with key players holding significant market share. Technological innovations, particularly in refining processes to achieve higher purity levels, are crucial drivers. Stringent regulatory frameworks regarding material purity, especially in sectors like semiconductors and solar energy, influence market dynamics. Competitive substitutes, while limited, include synthetic quartz and other optical materials, posing a niche challenge. End-user demographics are heavily skewed towards technologically advanced nations, with robust demand from the electronics and energy sectors. M&A activities have been relatively limited in recent years, with a focus on capacity expansion rather than outright acquisitions.

  • Market Concentration: Moderately concentrated, with the top 5 players holding approximately xx% market share in 2024.
  • Technological Innovation: Focus on improving purity levels, reducing production costs, and enhancing crystal quality.
  • Regulatory Framework: Stringent regulations drive demand for higher purity levels, particularly in sensitive applications.
  • Competitive Substitutes: Limited but present, with synthetic quartz and alternative optical materials offering niche competition.
  • M&A Activity: Relatively low in recent years, with emphasis on organic growth and capacity expansion. Approx xx M&A deals occurred between 2019-2024.

High Purity Quartz Market Growth Trends & Insights

The High Purity Quartz market has exhibited steady growth over the historical period (2019-2024), driven primarily by the expanding electronics and renewable energy sectors. The market size has grown from xx Million USD in 2019 to xx Million USD in 2024, with a CAGR of xx%. This growth is projected to continue throughout the forecast period (2025-2033), fueled by increasing adoption of HPQ in high-tech applications and rising investments in renewable energy infrastructure. Technological advancements, leading to improved purity and efficiency, further contribute to market expansion. Consumer behavior shifts, such as increased demand for high-performance electronic devices and sustainable energy solutions, directly impact market growth. Market penetration in developing economies is expected to increase significantly, driving future expansion.

High Purity Quartz Market Growth

Dominant Regions, Countries, or Segments in High Purity Quartz Market

The Asia-Pacific region, particularly China and Japan, dominates the High Purity Quartz market, owing to the concentration of semiconductor and solar manufacturing facilities. North America and Europe also hold significant market share, driven by robust demand from electronics and telecommunications industries. The Semiconductor segment currently holds the largest market share amongst applications, followed by Solar.

  • Key Drivers in Asia-Pacific: Large-scale manufacturing facilities, government support for renewable energy, and a growing electronics industry.
  • Key Drivers in North America: Technological advancements, strong R&D investments, and a stable regulatory environment.
  • Key Drivers in Europe: High demand from the automotive and telecommunications industries, focus on sustainable energy.
  • Segment Dominance: Semiconductor application segment is the leading application segment, driven by increasing demand for advanced electronic devices.

High Purity Quartz Market Product Landscape

The HPQ market offers various product grades, categorized based on purity levels and applications. Innovations focus on achieving even higher purity levels (99.999% and above) and enhanced crystal properties for specific applications. Unique selling propositions include superior optical properties, high thermal stability, and precise dimensional accuracy, catering to stringent demands of demanding sectors.

Key Drivers, Barriers & Challenges in High Purity Quartz Market

Key Drivers: The increasing demand from the semiconductor and solar industries, coupled with government initiatives promoting renewable energy and technological advancements in production processes, are key drivers for market growth. Technological advancements in the refining processes are reducing production costs and improving the overall quality.

Key Challenges: Supply chain disruptions, particularly regarding raw material sourcing, and rising energy costs pose significant challenges. Stringent environmental regulations and competitive pressures from alternative materials further complicate market dynamics. These factors contribute to increased production costs, limiting market growth.

Emerging Opportunities in High Purity Quartz Market

Emerging opportunities lie in the burgeoning 5G infrastructure, expanding microelectronics industry, and growing adoption of HPQ in advanced optics and medical applications. Untapped markets in developing economies, coupled with innovative applications in advanced technologies, present significant growth potential.

Growth Accelerators in the High Purity Quartz Market Industry

Technological advancements in refining processes, coupled with strategic partnerships and collaborations amongst key players, are accelerating market growth. Expansion into new geographical markets and diversification into high-growth applications further contribute to long-term expansion.

Key Players Shaping the High Purity Quartz Market Market

  • Jiangsu Pacific Quartz Co Ltd
  • American Elements
  • Covia Holdings LLC
  • Momentive Technologies
  • Sibelco
  • Imerys
  • ULTRA HPQ
  • Russian Quartz LLC
  • Australian Silica Quartz Group Ltd
  • The Quartz Corp

Notable Milestones in High Purity Quartz Market Sector

  • April 2023: Sibelco announced an investment of approx. USD 200 million to double high purity quartz (HPQ) installed capacity at its Spruce Pine facility in North Carolina, United States. This significantly expands production capacity and strengthens Sibelco’s position in the HPQ market.

In-Depth High Purity Quartz Market Market Outlook

The High Purity Quartz market is poised for significant growth over the forecast period, driven by technological advancements, expanding applications, and increasing investments in key end-use sectors. Strategic partnerships, capacity expansions, and the exploration of new applications will further accelerate market growth. The market is expected to experience a robust CAGR of xx% during the forecast period, offering significant opportunities for existing and new market participants.

High Purity Quartz Market Segmentation

  • 1. Application
    • 1.1. Semiconductor
    • 1.2. Solar
    • 1.3. Lighting
    • 1.4. Telecom and Optics
    • 1.5. Microelectronics
    • 1.6. Others

High Purity Quartz Market Segmentation By Geography

  • 1. Asia Pacific
    • 1.1. China
    • 1.2. India
    • 1.3. Japan
    • 1.4. South Korea
    • 1.5. Rest of Asia Pacific
  • 2. North America
    • 2.1. United States
    • 2.2. Canada
    • 2.3. Mexico
  • 3. Europe
    • 3.1. Germany
    • 3.2. United Kingdom
    • 3.3. Italy
    • 3.4. France
    • 3.5. Rest of Europe
  • 4. South America
    • 4.1. Brazil
    • 4.2. Argentina
    • 4.3. Rest of South America
  • 5. Middle East and Africa
    • 5.1. Saudi Arabia
    • 5.2. South Africa
    • 5.3. Rest of Middle East and Africa
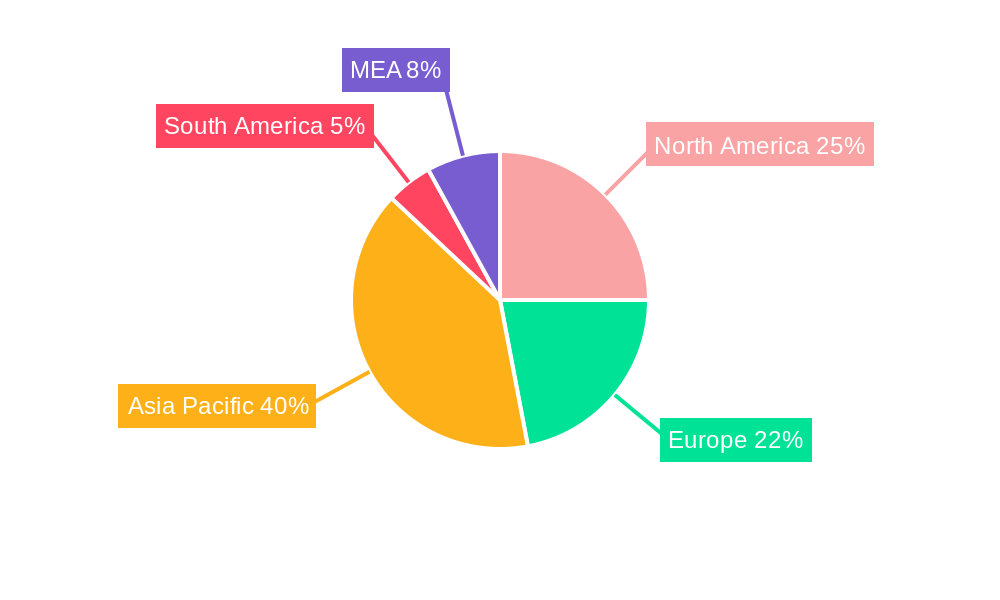
High Purity Quartz Market Regional Share


High Purity Quartz Market REPORT HIGHLIGHTS

AspectsDetails
Study Period 2019-2033
Base Year 2024
Estimated Year 2025
Forecast Period2025-2033
Historical Period2019-2024
Growth RateCAGR of > 4.50% from 2019-2033
Segmentation
    • By Application
      • Semiconductor
      • Solar
      • Lighting
      • Telecom and Optics
      • Microelectronics
      • Others
  • By Geography
    • Asia Pacific
      • China
      • India
      • Japan
      • South Korea
      • Rest of Asia Pacific
    • North America
      • United States
      • Canada
      • Mexico
    • Europe
      • Germany
      • United Kingdom
      • Italy
      • France
      • Rest of Europe
    • South America
      • Brazil
      • Argentina
      • Rest of South America
    • Middle East and Africa
      • Saudi Arabia
      • South Africa
      • Rest of Middle East and Africa


Table of Contents

  1. 1. Introduction
    • 1.1. Research Scope
    • 1.2. Market Segmentation
    • 1.3. Research Methodology
    • 1.4. Definitions and Assumptions
  2. 2. Executive Summary
    • 2.1. Introduction
  3. 3. Market Dynamics
    • 3.1. Introduction
      • 3.2. Market Drivers
        • 3.2.1. Growing Demand for Semiconductor ICs; Increasing Adoption in Solar Industry; Other Drivers
      • 3.3. Market Restrains
        • 3.3.1. The Fluctuating Prices of Raw Materials; Other Restraints
      • 3.4. Market Trends
        • 3.4.1. Growing Demand from Semiconductor Industry
  4. 4. Market Factor Analysis
    • 4.1. Porters Five Forces
    • 4.2. Supply/Value Chain
    • 4.3. PESTEL analysis
    • 4.4. Market Entropy
    • 4.5. Patent/Trademark Analysis
  5. 5. Global High Purity Quartz Market Analysis, Insights and Forecast, 2019-2031
    • 5.1. Market Analysis, Insights and Forecast - by Application
      • 5.1.1. Semiconductor
      • 5.1.2. Solar
      • 5.1.3. Lighting
      • 5.1.4. Telecom and Optics
      • 5.1.5. Microelectronics
      • 5.1.6. Others
    • 5.2. Market Analysis, Insights and Forecast - by Region
      • 5.2.1. Asia Pacific
      • 5.2.2. North America
      • 5.2.3. Europe
      • 5.2.4. South America
      • 5.2.5. Middle East and Africa
  6. 6. Asia Pacific High Purity Quartz Market Analysis, Insights and Forecast, 2019-2031
    • 6.1. Market Analysis, Insights and Forecast - by Application
      • 6.1.1. Semiconductor
      • 6.1.2. Solar
      • 6.1.3. Lighting
      • 6.1.4. Telecom and Optics
      • 6.1.5. Microelectronics
      • 6.1.6. Others
  7. 7. North America High Purity Quartz Market Analysis, Insights and Forecast, 2019-2031
    • 7.1. Market Analysis, Insights and Forecast - by Application
      • 7.1.1. Semiconductor
      • 7.1.2. Solar
      • 7.1.3. Lighting
      • 7.1.4. Telecom and Optics
      • 7.1.5. Microelectronics
      • 7.1.6. Others
  8. 8. Europe High Purity Quartz Market Analysis, Insights and Forecast, 2019-2031
    • 8.1. Market Analysis, Insights and Forecast - by Application
      • 8.1.1. Semiconductor
      • 8.1.2. Solar
      • 8.1.3. Lighting
      • 8.1.4. Telecom and Optics
      • 8.1.5. Microelectronics
      • 8.1.6. Others
  9. 9. South America High Purity Quartz Market Analysis, Insights and Forecast, 2019-2031
    • 9.1. Market Analysis, Insights and Forecast - by Application
      • 9.1.1. Semiconductor
      • 9.1.2. Solar
      • 9.1.3. Lighting
      • 9.1.4. Telecom and Optics
      • 9.1.5. Microelectronics
      • 9.1.6. Others
  10. 10. Middle East and Africa High Purity Quartz Market Analysis, Insights and Forecast, 2019-2031
    • 10.1. Market Analysis, Insights and Forecast - by Application
      • 10.1.1. Semiconductor
      • 10.1.2. Solar
      • 10.1.3. Lighting
      • 10.1.4. Telecom and Optics
      • 10.1.5. Microelectronics
      • 10.1.6. Others
  11. 11. North America High Purity Quartz Market Analysis, Insights and Forecast, 2019-2031
      • 11.1. Market Analysis, Insights and Forecast - By Country/Sub-region
        • 11.1.1 United States
        • 11.1.2 Canada
        • 11.1.3 Mexico
  12. 12. Europe High Purity Quartz Market Analysis, Insights and Forecast, 2019-2031
      • 12.1. Market Analysis, Insights and Forecast - By Country/Sub-region
        • 12.1.1 Germany
        • 12.1.2 France
        • 12.1.3 Italy
        • 12.1.4 United Kingdom
        • 12.1.5 Netherlands
        • 12.1.6 Rest of Europe
  13. 13. Asia Pacific High Purity Quartz Market Analysis, Insights and Forecast, 2019-2031
      • 13.1. Market Analysis, Insights and Forecast - By Country/Sub-region
        • 13.1.1 China
        • 13.1.2 Japan
        • 13.1.3 India
        • 13.1.4 South Korea
        • 13.1.5 Taiwan
        • 13.1.6 Australia
        • 13.1.7 Rest of Asia-Pacific
  14. 14. South America High Purity Quartz Market Analysis, Insights and Forecast, 2019-2031
      • 14.1. Market Analysis, Insights and Forecast - By Country/Sub-region
        • 14.1.1 Brazil
        • 14.1.2 Argentina
        • 14.1.3 Rest of South America
  15. 15. MEA High Purity Quartz Market Analysis, Insights and Forecast, 2019-2031
      • 15.1. Market Analysis, Insights and Forecast - By Country/Sub-region
        • 15.1.1 Middle East
        • 15.1.2 Africa
  16. 16. Competitive Analysis
    • 16.1. Global Market Share Analysis 2024
      • 16.2. Company Profiles
        • 16.2.1 Jiangsu Pacific Quartz Co Ltd
          • 16.2.1.1. Overview
          • 16.2.1.2. Products
          • 16.2.1.3. SWOT Analysis
          • 16.2.1.4. Recent Developments
          • 16.2.1.5. Financials (Based on Availability)
        • 16.2.2 American Elements
          • 16.2.2.1. Overview
          • 16.2.2.2. Products
          • 16.2.2.3. SWOT Analysis
          • 16.2.2.4. Recent Developments
          • 16.2.2.5. Financials (Based on Availability)
        • 16.2.3 Covia Holdings LLC
          • 16.2.3.1. Overview
          • 16.2.3.2. Products
          • 16.2.3.3. SWOT Analysis
          • 16.2.3.4. Recent Developments
          • 16.2.3.5. Financials (Based on Availability)
        • 16.2.4 Momentive Technologies
          • 16.2.4.1. Overview
          • 16.2.4.2. Products
          • 16.2.4.3. SWOT Analysis
          • 16.2.4.4. Recent Developments
          • 16.2.4.5. Financials (Based on Availability)
        • 16.2.5 Sibelco
          • 16.2.5.1. Overview
          • 16.2.5.2. Products
          • 16.2.5.3. SWOT Analysis
          • 16.2.5.4. Recent Developments
          • 16.2.5.5. Financials (Based on Availability)
        • 16.2.6 Imerys
          • 16.2.6.1. Overview
          • 16.2.6.2. Products
          • 16.2.6.3. SWOT Analysis
          • 16.2.6.4. Recent Developments
          • 16.2.6.5. Financials (Based on Availability)
        • 16.2.7 ULTRA HPQ
          • 16.2.7.1. Overview
          • 16.2.7.2. Products
          • 16.2.7.3. SWOT Analysis
          • 16.2.7.4. Recent Developments
          • 16.2.7.5. Financials (Based on Availability)
        • 16.2.8 Russian Quartz LLC
          • 16.2.8.1. Overview
          • 16.2.8.2. Products
          • 16.2.8.3. SWOT Analysis
          • 16.2.8.4. Recent Developments
          • 16.2.8.5. Financials (Based on Availability)
        • 16.2.9 Australian Silica Quartz Group Ltd
          • 16.2.9.1. Overview
          • 16.2.9.2. Products
          • 16.2.9.3. SWOT Analysis
          • 16.2.9.4. Recent Developments
          • 16.2.9.5. Financials (Based on Availability)
        • 16.2.10 The Quartz Corp
          • 16.2.10.1. Overview
          • 16.2.10.2. Products
          • 16.2.10.3. SWOT Analysis
          • 16.2.10.4. Recent Developments
          • 16.2.10.5. Financials (Based on Availability)

List of Figures

  1. Figure 1: Global High Purity Quartz Market Revenue Breakdown (Million, %) by Region 2024 & 2032
  2. Figure 2: Global High Purity Quartz Market Volume Breakdown (K Tons, %) by Region 2024 & 2032
  3. Figure 3: North America High Purity Quartz Market Revenue (Million), by Country 2024 & 2032
  4. Figure 4: North America High Purity Quartz Market Volume (K Tons), by Country 2024 & 2032
  5. Figure 5: North America High Purity Quartz Market Revenue Share (%), by Country 2024 & 2032
  6. Figure 6: North America High Purity Quartz Market Volume Share (%), by Country 2024 & 2032
  7. Figure 7: Europe High Purity Quartz Market Revenue (Million), by Country 2024 & 2032
  8. Figure 8: Europe High Purity Quartz Market Volume (K Tons), by Country 2024 & 2032
  9. Figure 9: Europe High Purity Quartz Market Revenue Share (%), by Country 2024 & 2032
  10. Figure 10: Europe High Purity Quartz Market Volume Share (%), by Country 2024 & 2032
  11. Figure 11: Asia Pacific High Purity Quartz Market Revenue (Million), by Country 2024 & 2032
  12. Figure 12: Asia Pacific High Purity Quartz Market Volume (K Tons), by Country 2024 & 2032
  13. Figure 13: Asia Pacific High Purity Quartz Market Revenue Share (%), by Country 2024 & 2032
  14. Figure 14: Asia Pacific High Purity Quartz Market Volume Share (%), by Country 2024 & 2032
  15. Figure 15: South America High Purity Quartz Market Revenue (Million), by Country 2024 & 2032
  16. Figure 16: South America High Purity Quartz Market Volume (K Tons), by Country 2024 & 2032
  17. Figure 17: South America High Purity Quartz Market Revenue Share (%), by Country 2024 & 2032
  18. Figure 18: South America High Purity Quartz Market Volume Share (%), by Country 2024 & 2032
  19. Figure 19: MEA High Purity Quartz Market Revenue (Million), by Country 2024 & 2032
  20. Figure 20: MEA High Purity Quartz Market Volume (K Tons), by Country 2024 & 2032
  21. Figure 21: MEA High Purity Quartz Market Revenue Share (%), by Country 2024 & 2032
  22. Figure 22: MEA High Purity Quartz Market Volume Share (%), by Country 2024 & 2032
  23. Figure 23: Asia Pacific High Purity Quartz Market Revenue (Million), by Application 2024 & 2032
  24. Figure 24: Asia Pacific High Purity Quartz Market Volume (K Tons), by Application 2024 & 2032
  25. Figure 25: Asia Pacific High Purity Quartz Market Revenue Share (%), by Application 2024 & 2032
  26. Figure 26: Asia Pacific High Purity Quartz Market Volume Share (%), by Application 2024 & 2032
  27. Figure 27: Asia Pacific High Purity Quartz Market Revenue (Million), by Country 2024 & 2032
  28. Figure 28: Asia Pacific High Purity Quartz Market Volume (K Tons), by Country 2024 & 2032
  29. Figure 29: Asia Pacific High Purity Quartz Market Revenue Share (%), by Country 2024 & 2032
  30. Figure 30: Asia Pacific High Purity Quartz Market Volume Share (%), by Country 2024 & 2032
  31. Figure 31: North America High Purity Quartz Market Revenue (Million), by Application 2024 & 2032
  32. Figure 32: North America High Purity Quartz Market Volume (K Tons), by Application 2024 & 2032
  33. Figure 33: North America High Purity Quartz Market Revenue Share (%), by Application 2024 & 2032
  34. Figure 34: North America High Purity Quartz Market Volume Share (%), by Application 2024 & 2032
  35. Figure 35: North America High Purity Quartz Market Revenue (Million), by Country 2024 & 2032
  36. Figure 36: North America High Purity Quartz Market Volume (K Tons), by Country 2024 & 2032
  37. Figure 37: North America High Purity Quartz Market Revenue Share (%), by Country 2024 & 2032
  38. Figure 38: North America High Purity Quartz Market Volume Share (%), by Country 2024 & 2032
  39. Figure 39: Europe High Purity Quartz Market Revenue (Million), by Application 2024 & 2032
  40. Figure 40: Europe High Purity Quartz Market Volume (K Tons), by Application 2024 & 2032
  41. Figure 41: Europe High Purity Quartz Market Revenue Share (%), by Application 2024 & 2032
  42. Figure 42: Europe High Purity Quartz Market Volume Share (%), by Application 2024 & 2032
  43. Figure 43: Europe High Purity Quartz Market Revenue (Million), by Country 2024 & 2032
  44. Figure 44: Europe High Purity Quartz Market Volume (K Tons), by Country 2024 & 2032
  45. Figure 45: Europe High Purity Quartz Market Revenue Share (%), by Country 2024 & 2032
  46. Figure 46: Europe High Purity Quartz Market Volume Share (%), by Country 2024 & 2032
  47. Figure 47: South America High Purity Quartz Market Revenue (Million), by Application 2024 & 2032
  48. Figure 48: South America High Purity Quartz Market Volume (K Tons), by Application 2024 & 2032
  49. Figure 49: South America High Purity Quartz Market Revenue Share (%), by Application 2024 & 2032
  50. Figure 50: South America High Purity Quartz Market Volume Share (%), by Application 2024 & 2032
  51. Figure 51: South America High Purity Quartz Market Revenue (Million), by Country 2024 & 2032
  52. Figure 52: South America High Purity Quartz Market Volume (K Tons), by Country 2024 & 2032
  53. Figure 53: South America High Purity Quartz Market Revenue Share (%), by Country 2024 & 2032
  54. Figure 54: South America High Purity Quartz Market Volume Share (%), by Country 2024 & 2032
  55. Figure 55: Middle East and Africa High Purity Quartz Market Revenue (Million), by Application 2024 & 2032
  56. Figure 56: Middle East and Africa High Purity Quartz Market Volume (K Tons), by Application 2024 & 2032
  57. Figure 57: Middle East and Africa High Purity Quartz Market Revenue Share (%), by Application 2024 & 2032
  58. Figure 58: Middle East and Africa High Purity Quartz Market Volume Share (%), by Application 2024 & 2032
  59. Figure 59: Middle East and Africa High Purity Quartz Market Revenue (Million), by Country 2024 & 2032
  60. Figure 60: Middle East and Africa High Purity Quartz Market Volume (K Tons), by Country 2024 & 2032
  61. Figure 61: Middle East and Africa High Purity Quartz Market Revenue Share (%), by Country 2024 & 2032
  62. Figure 62: Middle East and Africa High Purity Quartz Market Volume Share (%), by Country 2024 & 2032

List of Tables

  1. Table 1: Global High Purity Quartz Market Revenue Million Forecast, by Region 2019 & 2032
  2. Table 2: Global High Purity Quartz Market Volume K Tons Forecast, by Region 2019 & 2032
  3. Table 3: Global High Purity Quartz Market Revenue Million Forecast, by Application 2019 & 2032
  4. Table 4: Global High Purity Quartz Market Volume K Tons Forecast, by Application 2019 & 2032
  5. Table 5: Global High Purity Quartz Market Revenue Million Forecast, by Region 2019 & 2032
  6. Table 6: Global High Purity Quartz Market Volume K Tons Forecast, by Region 2019 & 2032
  7. Table 7: Global High Purity Quartz Market Revenue Million Forecast, by Country 2019 & 2032
  8. Table 8: Global High Purity Quartz Market Volume K Tons Forecast, by Country 2019 & 2032
  9. Table 9: United States High Purity Quartz Market Revenue (Million) Forecast, by Application 2019 & 2032
  10. Table 10: United States High Purity Quartz Market Volume (K Tons) Forecast, by Application 2019 & 2032
  11. Table 11: Canada High Purity Quartz Market Revenue (Million) Forecast, by Application 2019 & 2032
  12. Table 12: Canada High Purity Quartz Market Volume (K Tons) Forecast, by Application 2019 & 2032
  13. Table 13: Mexico High Purity Quartz Market Revenue (Million) Forecast, by Application 2019 & 2032
  14. Table 14: Mexico High Purity Quartz Market Volume (K Tons) Forecast, by Application 2019 & 2032
  15. Table 15: Global High Purity Quartz Market Revenue Million Forecast, by Country 2019 & 2032
  16. Table 16: Global High Purity Quartz Market Volume K Tons Forecast, by Country 2019 & 2032
  17. Table 17: Germany High Purity Quartz Market Revenue (Million) Forecast, by Application 2019 & 2032
  18. Table 18: Germany High Purity Quartz Market Volume (K Tons) Forecast, by Application 2019 & 2032
  19. Table 19: France High Purity Quartz Market Revenue (Million) Forecast, by Application 2019 & 2032
  20. Table 20: France High Purity Quartz Market Volume (K Tons) Forecast, by Application 2019 & 2032
  21. Table 21: Italy High Purity Quartz Market Revenue (Million) Forecast, by Application 2019 & 2032
  22. Table 22: Italy High Purity Quartz Market Volume (K Tons) Forecast, by Application 2019 & 2032
  23. Table 23: United Kingdom High Purity Quartz Market Revenue (Million) Forecast, by Application 2019 & 2032
  24. Table 24: United Kingdom High Purity Quartz Market Volume (K Tons) Forecast, by Application 2019 & 2032
  25. Table 25: Netherlands High Purity Quartz Market Revenue (Million) Forecast, by Application 2019 & 2032
  26. Table 26: Netherlands High Purity Quartz Market Volume (K Tons) Forecast, by Application 2019 & 2032
  27. Table 27: Rest of Europe High Purity Quartz Market Revenue (Million) Forecast, by Application 2019 & 2032
  28. Table 28: Rest of Europe High Purity Quartz Market Volume (K Tons) Forecast, by Application 2019 & 2032
  29. Table 29: Global High Purity Quartz Market Revenue Million Forecast, by Country 2019 & 2032
  30. Table 30: Global High Purity Quartz Market Volume K Tons Forecast, by Country 2019 & 2032
  31. Table 31: China High Purity Quartz Market Revenue (Million) Forecast, by Application 2019 & 2032
  32. Table 32: China High Purity Quartz Market Volume (K Tons) Forecast, by Application 2019 & 2032
  33. Table 33: Japan High Purity Quartz Market Revenue (Million) Forecast, by Application 2019 & 2032
  34. Table 34: Japan High Purity Quartz Market Volume (K Tons) Forecast, by Application 2019 & 2032
  35. Table 35: India High Purity Quartz Market Revenue (Million) Forecast, by Application 2019 & 2032
  36. Table 36: India High Purity Quartz Market Volume (K Tons) Forecast, by Application 2019 & 2032
  37. Table 37: South Korea High Purity Quartz Market Revenue (Million) Forecast, by Application 2019 & 2032
  38. Table 38: South Korea High Purity Quartz Market Volume (K Tons) Forecast, by Application 2019 & 2032
  39. Table 39: Taiwan High Purity Quartz Market Revenue (Million) Forecast, by Application 2019 & 2032
  40. Table 40: Taiwan High Purity Quartz Market Volume (K Tons) Forecast, by Application 2019 & 2032
  41. Table 41: Australia High Purity Quartz Market Revenue (Million) Forecast, by Application 2019 & 2032
  42. Table 42: Australia High Purity Quartz Market Volume (K Tons) Forecast, by Application 2019 & 2032
  43. Table 43: Rest of Asia-Pacific High Purity Quartz Market Revenue (Million) Forecast, by Application 2019 & 2032
  44. Table 44: Rest of Asia-Pacific High Purity Quartz Market Volume (K Tons) Forecast, by Application 2019 & 2032
  45. Table 45: Global High Purity Quartz Market Revenue Million Forecast, by Country 2019 & 2032
  46. Table 46: Global High Purity Quartz Market Volume K Tons Forecast, by Country 2019 & 2032
  47. Table 47: Brazil High Purity Quartz Market Revenue (Million) Forecast, by Application 2019 & 2032
  48. Table 48: Brazil High Purity Quartz Market Volume (K Tons) Forecast, by Application 2019 & 2032
  49. Table 49: Argentina High Purity Quartz Market Revenue (Million) Forecast, by Application 2019 & 2032
  50. Table 50: Argentina High Purity Quartz Market Volume (K Tons) Forecast, by Application 2019 & 2032
  51. Table 51: Rest of South America High Purity Quartz Market Revenue (Million) Forecast, by Application 2019 & 2032
  52. Table 52: Rest of South America High Purity Quartz Market Volume (K Tons) Forecast, by Application 2019 & 2032
  53. Table 53: Global High Purity Quartz Market Revenue Million Forecast, by Country 2019 & 2032
  54. Table 54: Global High Purity Quartz Market Volume K Tons Forecast, by Country 2019 & 2032
  55. Table 55: Middle East High Purity Quartz Market Revenue (Million) Forecast, by Application 2019 & 2032
  56. Table 56: Middle East High Purity Quartz Market Volume (K Tons) Forecast, by Application 2019 & 2032
  57. Table 57: Africa High Purity Quartz Market Revenue (Million) Forecast, by Application 2019 & 2032
  58. Table 58: Africa High Purity Quartz Market Volume (K Tons) Forecast, by Application 2019 & 2032
  59. Table 59: Global High Purity Quartz Market Revenue Million Forecast, by Application 2019 & 2032
  60. Table 60: Global High Purity Quartz Market Volume K Tons Forecast, by Application 2019 & 2032
  61. Table 61: Global High Purity Quartz Market Revenue Million Forecast, by Country 2019 & 2032
  62. Table 62: Global High Purity Quartz Market Volume K Tons Forecast, by Country 2019 & 2032
  63. Table 63: China High Purity Quartz Market Revenue (Million) Forecast, by Application 2019 & 2032
  64. Table 64: China High Purity Quartz Market Volume (K Tons) Forecast, by Application 2019 & 2032
  65. Table 65: India High Purity Quartz Market Revenue (Million) Forecast, by Application 2019 & 2032
  66. Table 66: India High Purity Quartz Market Volume (K Tons) Forecast, by Application 2019 & 2032
  67. Table 67: Japan High Purity Quartz Market Revenue (Million) Forecast, by Application 2019 & 2032
  68. Table 68: Japan High Purity Quartz Market Volume (K Tons) Forecast, by Application 2019 & 2032
  69. Table 69: South Korea High Purity Quartz Market Revenue (Million) Forecast, by Application 2019 & 2032
  70. Table 70: South Korea High Purity Quartz Market Volume (K Tons) Forecast, by Application 2019 & 2032
  71. Table 71: Rest of Asia Pacific High Purity Quartz Market Revenue (Million) Forecast, by Application 2019 & 2032
  72. Table 72: Rest of Asia Pacific High Purity Quartz Market Volume (K Tons) Forecast, by Application 2019 & 2032
  73. Table 73: Global High Purity Quartz Market Revenue Million Forecast, by Application 2019 & 2032
  74. Table 74: Global High Purity Quartz Market Volume K Tons Forecast, by Application 2019 & 2032
  75. Table 75: Global High Purity Quartz Market Revenue Million Forecast, by Country 2019 & 2032
  76. Table 76: Global High Purity Quartz Market Volume K Tons Forecast, by Country 2019 & 2032
  77. Table 77: United States High Purity Quartz Market Revenue (Million) Forecast, by Application 2019 & 2032
  78. Table 78: United States High Purity Quartz Market Volume (K Tons) Forecast, by Application 2019 & 2032
  79. Table 79: Canada High Purity Quartz Market Revenue (Million) Forecast, by Application 2019 & 2032
  80. Table 80: Canada High Purity Quartz Market Volume (K Tons) Forecast, by Application 2019 & 2032
  81. Table 81: Mexico High Purity Quartz Market Revenue (Million) Forecast, by Application 2019 & 2032
  82. Table 82: Mexico High Purity Quartz Market Volume (K Tons) Forecast, by Application 2019 & 2032
  83. Table 83: Global High Purity Quartz Market Revenue Million Forecast, by Application 2019 & 2032
  84. Table 84: Global High Purity Quartz Market Volume K Tons Forecast, by Application 2019 & 2032
  85. Table 85: Global High Purity Quartz Market Revenue Million Forecast, by Country 2019 & 2032
  86. Table 86: Global High Purity Quartz Market Volume K Tons Forecast, by Country 2019 & 2032
  87. Table 87: Germany High Purity Quartz Market Revenue (Million) Forecast, by Application 2019 & 2032
  88. Table 88: Germany High Purity Quartz Market Volume (K Tons) Forecast, by Application 2019 & 2032
  89. Table 89: United Kingdom High Purity Quartz Market Revenue (Million) Forecast, by Application 2019 & 2032
  90. Table 90: United Kingdom High Purity Quartz Market Volume (K Tons) Forecast, by Application 2019 & 2032
  91. Table 91: Italy High Purity Quartz Market Revenue (Million) Forecast, by Application 2019 & 2032
  92. Table 92: Italy High Purity Quartz Market Volume (K Tons) Forecast, by Application 2019 & 2032
  93. Table 93: France High Purity Quartz Market Revenue (Million) Forecast, by Application 2019 & 2032
  94. Table 94: France High Purity Quartz Market Volume (K Tons) Forecast, by Application 2019 & 2032
  95. Table 95: Rest of Europe High Purity Quartz Market Revenue (Million) Forecast, by Application 2019 & 2032
  96. Table 96: Rest of Europe High Purity Quartz Market Volume (K Tons) Forecast, by Application 2019 & 2032
  97. Table 97: Global High Purity Quartz Market Revenue Million Forecast, by Application 2019 & 2032
  98. Table 98: Global High Purity Quartz Market Volume K Tons Forecast, by Application 2019 & 2032
  99. Table 99: Global High Purity Quartz Market Revenue Million Forecast, by Country 2019 & 2032
  100. Table 100: Global High Purity Quartz Market Volume K Tons Forecast, by Country 2019 & 2032
  101. Table 101: Brazil High Purity Quartz Market Revenue (Million) Forecast, by Application 2019 & 2032
  102. Table 102: Brazil High Purity Quartz Market Volume (K Tons) Forecast, by Application 2019 & 2032
  103. Table 103: Argentina High Purity Quartz Market Revenue (Million) Forecast, by Application 2019 & 2032
  104. Table 104: Argentina High Purity Quartz Market Volume (K Tons) Forecast, by Application 2019 & 2032
  105. Table 105: Rest of South America High Purity Quartz Market Revenue (Million) Forecast, by Application 2019 & 2032
  106. Table 106: Rest of South America High Purity Quartz Market Volume (K Tons) Forecast, by Application 2019 & 2032
  107. Table 107: Global High Purity Quartz Market Revenue Million Forecast, by Application 2019 & 2032
  108. Table 108: Global High Purity Quartz Market Volume K Tons Forecast, by Application 2019 & 2032
  109. Table 109: Global High Purity Quartz Market Revenue Million Forecast, by Country 2019 & 2032
  110. Table 110: Global High Purity Quartz Market Volume K Tons Forecast, by Country 2019 & 2032
  111. Table 111: Saudi Arabia High Purity Quartz Market Revenue (Million) Forecast, by Application 2019 & 2032
  112. Table 112: Saudi Arabia High Purity Quartz Market Volume (K Tons) Forecast, by Application 2019 & 2032
  113. Table 113: South Africa High Purity Quartz Market Revenue (Million) Forecast, by Application 2019 & 2032
  114. Table 114: South Africa High Purity Quartz Market Volume (K Tons) Forecast, by Application 2019 & 2032
  115. Table 115: Rest of Middle East and Africa High Purity Quartz Market Revenue (Million) Forecast, by Application 2019 & 2032
  116. Table 116: Rest of Middle East and Africa High Purity Quartz Market Volume (K Tons) Forecast, by Application 2019 & 2032


Frequently Asked Questions

1. What is the projected Compound Annual Growth Rate (CAGR) of the High Purity Quartz Market?

The projected CAGR is approximately > 4.50%.

2. Which companies are prominent players in the High Purity Quartz Market?

Key companies in the market include Jiangsu Pacific Quartz Co Ltd, American Elements, Covia Holdings LLC, Momentive Technologies, Sibelco, Imerys, ULTRA HPQ, Russian Quartz LLC, Australian Silica Quartz Group Ltd, The Quartz Corp.

3. What are the main segments of the High Purity Quartz Market?

The market segments include Application.

4. Can you provide details about the market size?

The market size is estimated to be USD 672.93 Million as of 2022.

5. What are some drivers contributing to market growth?

Growing Demand for Semiconductor ICs; Increasing Adoption in Solar Industry; Other Drivers.

6. What are the notable trends driving market growth?

Growing Demand from Semiconductor Industry.

7. Are there any restraints impacting market growth?

The Fluctuating Prices of Raw Materials; Other Restraints.

8. Can you provide examples of recent developments in the market?

April 2023: Sibelco announced an investment of approx. USD 200 million to double high purity quartz (HPQ) installed capacity at its Spruce Pine facility in North Carolina, United States.

9. What pricing options are available for accessing the report?

Pricing options include single-user, multi-user, and enterprise licenses priced at USD 4750, USD 5250, and USD 8750 respectively.

10. Is the market size provided in terms of value or volume?

The market size is provided in terms of value, measured in Million and volume, measured in K Tons.

11. Are there any specific market keywords associated with the report?

Yes, the market keyword associated with the report is "High Purity Quartz Market," which aids in identifying and referencing the specific market segment covered.

12. How do I determine which pricing option suits my needs best?

The pricing options vary based on user requirements and access needs. Individual users may opt for single-user licenses, while businesses requiring broader access may choose multi-user or enterprise licenses for cost-effective access to the report.

13. Are there any additional resources or data provided in the High Purity Quartz Market report?

While the report offers comprehensive insights, it's advisable to review the specific contents or supplementary materials provided to ascertain if additional resources or data are available.

14. How can I stay updated on further developments or reports in the High Purity Quartz Market?

To stay informed about further developments, trends, and reports in the High Purity Quartz Market, consider subscribing to industry newsletters, following relevant companies and organizations, or regularly checking reputable industry news sources and publications.


Methodology

Step 1 - Identification of Relevant Samples Size from Population Database

Step Chart
Bar Chart
Method Chart

Step 2 - Approaches for Defining Global Market Size (Value, Volume* & Price*)

Approach Chart
Top-down and bottom-up approaches are used to validate the global market size and estimate the market size for manufactures, regional segments, product, and application.

Note*: In applicable scenarios

Step 3 - Data Sources

Primary Research

  • Web Analytics
  • Survey Reports
  • Research Institute
  • Latest Research Reports
  • Opinion Leaders

Secondary Research

  • Annual Reports
  • White Paper
  • Latest Press Release
  • Industry Association
  • Paid Database
  • Investor Presentations
Analyst Chart

Step 4 - Data Triangulation

Involves using different sources of information in order to increase the validity of a study

These sources are likely to be stakeholders in a program - participants, other researchers, program staff, other community members, and so on.

Then we put all data in single framework & apply various statistical tools to find out the dynamic on the market.

During the analysis stage, feedback from the stakeholder groups would be compared to determine areas of agreement as well as areas of divergence

Additionally, after gathering mixed and scattered data from a wide range of sources, data is triangulated and correlated to come up with estimated figures which are further validated through primary mediums or industry experts, opinion leaders.

About Visionary Data Reports

Visionary Data Reports provides future-focused market research, advanced analytics, and strategic insights for technology, healthcare, green energy, and finance. Our reports help you anticipate trends, innovate, and lead in your industry. Our expert team combines primary research, data science, and industry knowledge to deliver actionable intelligence. We offer syndicated reports, custom analytics, and consulting services tailored to your business needs. At Visionary Data Reports, we are committed to quality, transparency, and client satisfaction. Every report is rigorously validated to ensure accuracy and relevance. Our global perspective and forward-thinking approach help you understand both current and emerging market dynamics.

Stay ahead with Visionary Data Reports. Subscribe to our newsletter for the latest insights and research highlights, and follow us on social media for real-time updates. Visionary Data Reports – Your Guide to Tomorrow’s Opportunities.

artwork spiralartwork spiralRelated Reports
artwork underline

Growth Strategies in India Automotive Paints And Coatings Market Market: 2025-2033 Outlook

Explore the dynamic India automotive paints and coatings market, projected for significant growth to USD 608.17 million by 2033 with an 8.41% CAGR. Discover key drivers, resin types (Polyurethane, Epoxy, Acrylic), technologies (water-borne, solvent-borne), applications, and leading companies shaping the future of automotive finishes in India.

October 2025
Base Year: 2024
No Of Pages: 180
Price: $3800

Ordinary Portland Cement Market in Focus: Growth Trajectories and Strategic Insights 2025-2033

Explore the dynamic Ordinary Portland Cement market forecast (2025-2033) with projected growth, key drivers, and regional insights. Discover market size and CAGR trends for this essential construction material.

October 2025
Base Year: 2024
No Of Pages: 180
Price: $3800

Composite Materials in Renewable Energy Market Analysis 2025 and Forecasts 2033: Unveiling Growth Opportunities

Explore the dynamic Composite Materials in Renewable Energy Market, driven by solar and wind power growth. Discover key insights, market size, CAGR > 6.00%, drivers, trends, and leading companies.

October 2025
Base Year: 2024
No Of Pages: 234
Price: $4750

MCAA Market XX CAGR Growth Outlook 2025-2033

Explore the global Monochloroacetic Acid (MCAA) market analysis, including its $990.11 million size in 2025, 3.6% CAGR, key drivers like personal care & agrochemicals, and regional trends.

October 2025
Base Year: 2024
No Of Pages: 180
Price: $4750

Industrial Insulation Industry Dynamics and Forecasts: 2025-2033 Strategic Insights

Explore the booming Industrial Insulation market, projected to exceed USD 7.41 billion by 2025. Discover key drivers like energy efficiency, market trends in insulation materials and products, and growth opportunities across sectors like Oil & Gas, Chemical, and Automotive.

October 2025
Base Year: 2024
No Of Pages: 180
Price: $4750

Growth Catalysts in Polyethylene Foam Market Market

Explore the dynamic global Polyethylene Foam Market with insights into its significant growth, key drivers like automotive and construction demand, and future trends through 2033.

October 2025
Base Year: 2024
No Of Pages: 180
Price: $4750

Food Processing Lubricants Market Navigating Dynamics Comprehensive Analysis and Forecasts 2025-2033

Explore the dynamic Food Processing Lubricants Market, driven by safety standards and industry growth. Discover key drivers, trends, and forecasts from 2025-2033.

October 2025
Base Year: 2024
No Of Pages: 234
Price: $4750

APCA Fuel Additive Industry: Disruptive Technologies Driving Market Growth 2025-2033

Explore the booming Asia-Pacific Fuel Additive Market, projected to surpass USD 19,800 million by 2033 with a CAGR over 6.50%. Discover key drivers like emission regulations and demand for cleaner fuels, alongside market trends and restraints.

October 2025
Base Year: 2024
No Of Pages: 234
Price: $4750

Metal-faced Insulated Panels Industry: Growth Opportunities and Competitive Landscape Overview 2025-2033

Explore the booming Metal-faced Insulated Panels market! Discover key growth drivers, market trends, and segment analysis for energy-efficient construction solutions. Forecasts indicate substantial growth driven by sustainability and innovation in PU, PIR, and mineral wool panels.

October 2025
Base Year: 2024
No Of Pages: 180
Price: $4750

Asia-Pacific Industrial Flooring Market Market’s Consumer Preferences: Trends and Analysis 2025-2033

The size of the Asia-Pacific Industrial Flooring Market market was valued at USD XX Million in 2024 and is projected to reach USD XXX Million by 2033, with an expected CAGR of 6.00">> 6.00% during the forecast period.

October 2025
Base Year: 2024
No Of Pages: 150
Price: $4750

Europe Hydrogen Peroxide Market XX CAGR Growth to Drive Market Size to XXX Million by 2033

The size of the Europe Hydrogen Peroxide Market market was valued at USD 727.1 Million in 2024 and is projected to reach USD XXX Million by 2033, with an expected CAGR of 4.00">> 4.00% during the forecast period.

October 2025
Base Year: 2024
No Of Pages: 180
Price: $4750

Strategic Insights for Silica Market Market Expansion

Explore the dynamic Silica Market, projected to exceed $10 billion by 2033 with a CAGR over 4.00%. Discover key drivers, restraints, and growth opportunities in agriculture, automotive, cosmetics, and electronics.

October 2025
Base Year: 2024
No Of Pages: 150
Price: $4750

Exploring Consumer Shifts in Indonesia Adhesives and Sealants Market Market 2025-2033

The size of the Indonesia Adhesives and Sealants Market market was valued at USD XX Million in 2024 and is projected to reach USD XXX Million by 2033, with an expected CAGR of 6.66% during the forecast period.

October 2025
Base Year: 2024
No Of Pages: 150
Price: $3800

ASEAN Paints and Coatings Market Trends and Forecasts: Comprehensive Insights

Explore the dynamic ASEAN Paints and Coatings Market, forecast to exceed USD 15 Billion by 2025 with a CAGR over 4.00%. Discover key drivers like urbanization, infrastructure growth, and the shift towards sustainable coatings.

October 2025
Base Year: 2024
No Of Pages: 150
Price: $4750

Future-Ready Strategies for Healthcare Textiles Industry Market Growth

Explore the dynamic Healthcare Textiles market forecast, CAGR > 8.00%, driven by hygiene, chronic diseases, and advanced materials. Key insights on global trends and opportunities.

October 2025
Base Year: 2024
No Of Pages: 234
Price: $4750

Tall Oil Rosin Industry Innovations Shaping Market Growth 2025-2033

Explore the robust growth of the Tall Oil Rosin market, driven by sustainable alternatives. Discover market size, CAGR, key applications in adhesives, inks, and coatings, and future trends up to 2033.

October 2025
Base Year: 2024
No Of Pages: 234
Price: $4750

Wooden Decking Market Report 2025: Growth Driven by Government Incentives and Partnerships

The size of the Wooden Decking Market market was valued at USD 24.67 Million in 2024 and is projected to reach USD 35.63 Million by 2033, with an expected CAGR of 5.39% during the forecast period.

October 2025
Base Year: 2024
No Of Pages: 234
Price: $4750

Analyzing North America Boiler Water Treatment Chemicals Market: Opportunities and Growth Patterns 2025-2033

Explore the North America Boiler Water Treatment Chemicals Market analysis, uncovering key insights, market size, CAGR > 4.00%, drivers, trends, restraints, and detailed segmentations. Discover growth opportunities in the power generation, steel, oil refinery, and chemical industries.

October 2025
Base Year: 2024
No Of Pages: 234
Price: $4750

Melamine Formaldehyde Market Market’s Growth Catalysts

Explore the booming Melamine Formaldehyde Market, driven by construction and automotive sectors. Discover key trends, drivers, restraints, and regional growth forecasts from 2019-2033.

October 2025
Base Year: 2024
No Of Pages: 234
Price: $4750

Brazil Passenger Vehicles Lubricants Market Analysis 2025 and Forecasts 2033: Unveiling Growth Opportunities

Explore the Brazil Passenger Vehicles Lubricants Market, including its $1.5 billion valuation by 2025, 3.27% CAGR, key drivers like vehicle parc growth, and emerging trends towards synthetic lubricants.

October 2025
Base Year: 2024
No Of Pages: 197
Price: $3800

Exploring Betaine Market’s Market Size Dynamics 2025-2033

Explore the dynamic Betaine Market forecast, revealing growth drivers, key trends in food, feed, and personal care, and leading companies. Understand market size and CAGR exceeding 6.00%.

October 2025
Base Year: 2024
No Of Pages: 150
Price: $4750

Water Treatment Chemicals Market CAGR Trends: Growth Outlook 2025-2033

Explore the booming Water Treatment Chemicals Market, projected to reach $50 billion by 2025 with a 6.03% CAGR. Discover key drivers, trends, and segments like coagulants, biocides, and inhibitors across industries like power, oil & gas, and municipal.

October 2025
Base Year: 2024
No Of Pages: 234
Price: $4750

Future-Ready Strategies for Facade Coatings Market Market Growth

The size of the Facade Coatings Market market was valued at USD XX Million in 2024 and is projected to reach USD XXX Million by 2033, with an expected CAGR of 7.00">> 7.00% during the forecast period.

October 2025
Base Year: 2024
No Of Pages: 234
Price: $4750

China Flat Glass Market Insights: Growth at XX CAGR Through 2033

The size of the China Flat Glass Market market was valued at USD XX Million in 2024 and is projected to reach USD XXX Million by 2033, with an expected CAGR of 6.42% during the forecast period.

October 2025
Base Year: 2024
No Of Pages: 150
Price: $3800

Polymer Concrete Market Trends and Opportunities for Growth

Explore the dynamic Polymer Concrete Market with insights into its impressive growth, key drivers like advanced construction needs, and leading applications in infrastructure. Discover market trends, segmentation, and regional opportunities shaping the future of durable building materials.

October 2025
Base Year: 2024
No Of Pages: 180
Price: $4750

Brazil Adhesives Market Dynamics and Forecasts: 2025-2033 Strategic Insights

Explore the dynamic Brazil Adhesives Market. Discover key growth drivers, emerging trends in automotive, construction, and packaging, and dominant technologies shaping market expansion.

October 2025
Base Year: 2024
No Of Pages: 197
Price: $3800

Methyl Methacrylate (MMA) Adhesives Market Market Overview: Growth and Insights

Explore the booming Methyl Methacrylate (MMA) Adhesives market, driven by construction, aerospace, and transportation. Discover key trends, drivers, and market size exceeding USD 8,000 million with a 7% CAGR.

October 2025
Base Year: 2024
No Of Pages: 234
Price: $4750

Adhesives Market Market’s Strategic Roadmap: Insights for 2025-2033

Explore the dynamic global Adhesives Market forecast, driven by strong growth in automotive, construction, and packaging. Discover key trends, technologies like hot melt and UV cured, and leading companies shaping this evolving industry.

October 2025
Base Year: 2024
No Of Pages: 150
Price: $3800

ASEAN Dry Mix Mortar Industry Consumer Behavior Dynamics: Key Trends 2025-2033

The size of the ASEAN Dry Mix Mortar Industry market was valued at USD XX Million in 2024 and is projected to reach USD XXX Million by 2033, with an expected CAGR of 5.00">> 5.00% during the forecast period.

October 2025
Base Year: 2024
No Of Pages: 180
Price: $3800

Japan Passenger Vehicles Lubricants Market Industry’s Evolution and Growth Pathways

Explore the Japan Passenger Vehicles Lubricants Market analysis, uncovering key drivers, trends, restraints, and market size. Discover insights on engine oils, greases, and more from 2025-2033.

October 2025
Base Year: 2024
No Of Pages: 180
Price: $3800

Non Woven Adhesives Market and Emerging Technologies: Growth Insights 2025-2033

The size of the Non Woven Adhesives Market market was valued at USD XX Million in 2024 and is projected to reach USD XXX Million by 2033, with an expected CAGR of 9.00">> 9.00% during the forecast period.

October 2025
Base Year: 2024
No Of Pages: 150
Price: $4750

Mining Lubricants Market 2025 Trends and Forecasts 2033: Analyzing Growth Opportunities

Explore the dynamic Mining Lubricants Market analysis, including size, growth drivers, CAGR > 2.00%, key segments like engine oil & hydraulic fluids, and regional trends across Asia Pacific, North America, and Europe.

October 2025
Base Year: 2024
No Of Pages: 234
Price: $4750

Caprolactam Industry 2025-2033 Trends: Unveiling Growth Opportunities and Competitor Dynamics

The size of the Caprolactam Industry market was valued at USD XX Million in 2024 and is projected to reach USD XXX Million by 2033, with an expected CAGR of 3.00">> 3.00% during the forecast period.

September 2025
Base Year: 2024
No Of Pages: 234
Price: $4750

Understanding Growth Challenges in Specialty Adhesives Industry Market 2025-2033

The size of the Specialty Adhesives Industry market was valued at USD XX Million in 2024 and is projected to reach USD XXX Million by 2033, with an expected CAGR of 4.00">> 4.00% during the forecast period.

September 2025
Base Year: 2024
No Of Pages: 150
Price: $4750

Comprehensive Overview of Polysiloxane Market Trends: 2025-2033

The size of the Polysiloxane Market market was valued at USD 1.34 Million in 2024 and is projected to reach USD XXX Million by 2033, with an expected CAGR of 5.00">> 5.00% during the forecast period.

September 2025
Base Year: 2024
No Of Pages: 234
Price: $4750

United States Adhesives Market XX CAGR Growth Analysis 2025-2033

Explore the dynamic United States adhesives market, projecting robust growth driven by aerospace, automotive, and construction sectors. Discover key drivers, trends in sustainable solutions, and technological advancements shaping the future of adhesives.

September 2025
Base Year: 2024
No Of Pages: 197
Price: $3800

Analyzing Consumer Behavior in Latin America LDPE Market Market

Explore the dynamic Latin America LDPE market, forecasting significant growth driven by packaging, automotive, and agriculture sectors. Discover key trends, drivers, restraints, and opportunities up to 2033.

September 2025
Base Year: 2024
No Of Pages: 150
Price: $4750

Aluminum Ingots Market Industry Forecasts: Insights and Growth

Explore the dynamic Aluminum Ingots Market, driven by automotive, aerospace, and construction growth. Discover key trends, CAGR insights, and regional market share for informed investment decisions.

September 2025
Base Year: 2024
No Of Pages: 180
Price: $4750

Europe Automotive Lubricants Market Navigating Dynamics Comprehensive Analysis and Forecasts 2025-2033

The size of the Europe Automotive Lubricants Market market was valued at USD XX Million in 2024 and is projected to reach USD XXX Million by 2033, with an expected CAGR of 1.86% during the forecast period.

September 2025
Base Year: 2024
No Of Pages: 210
Price: $4750

Regional Trends and Opportunities for Middle-East and Africa Reactive Adhesives Market Market

Explore the dynamic Middle-East and Africa reactive adhesives market, driven by construction, renewable energy, and transportation. Discover key insights, growth drivers, and resin types shaping this evolving industry.

September 2025
Base Year: 2024
No Of Pages: 234
Price: $4750

Charting Epoxy Powder Coatings Market Growth: CAGR Projections for 2025-2033

Explore the dynamic global Epoxy Powder Coatings market analysis. Discover key insights, drivers like environmental benefits, and trends in protective coatings for automotive, aerospace, and construction. Get market size, CAGR > 3.00%, and forecast data.

September 2025
Base Year: 2024
No Of Pages: 234
Price: $4750

Comprehensive Overview of India Decorative Laminates Market Trends: 2025-2033

Explore the booming Indian decorative laminates market. Discover key insights, growth drivers, and trends shaping the industry, including furniture, cabinets, and flooring segments, with a projected CAGR over 5.00%.

September 2025
Base Year: 2024
No Of Pages: 197
Price: $3800

Navigating Malaysia Commercial Vehicles Lubricants Market Market Growth 2025-2033

Explore the dynamic Malaysia commercial vehicles lubricants market. Discover key insights, market size estimations, growth drivers, and trends in engine oils, greases, and more. Get up-to-date market analysis for 2025-2033.

September 2025
Base Year: 2024
No Of Pages: 197
Price: $3800

Solvent-borne Adhesives Market Market Size and Trends 2025-2033: Comprehensive Outlook

Explore the dynamic Solvent-borne Adhesives Market, driven by construction, packaging, and transportation sectors. Discover key drivers, restraints, and leading players shaping this USD 35 billion industry poised for significant growth.

September 2025
Base Year: 2024
No Of Pages: 234
Price: $4750

Russia Architectural Coatings Market Drivers of Growth: Opportunities to 2033

Explore the dynamic Russian architectural coatings market, driven by construction growth, eco-friendly trends, and key resin innovations. Get market insights, size, CAGR, and drivers for 2025-2033.

September 2025
Base Year: 2024
No Of Pages: 150
Price: $3800

Superconductor Materials Market Navigating Dynamics Comprehensive Analysis and Forecasts 2025-2033

Explore the dynamic Superconductor Materials Market with a CAGR > 10.00%, driven by medical, electronics, and energy innovations. Key insights, market size projections, and regional growth trends.

September 2025
Base Year: 2024
No Of Pages: 234
Price: $4750

Iranian Paints and Coatings Market Charting Growth Trajectories: Analysis and Forecasts 2025-2033

Explore the robust growth trajectory of the Iranian paints and coatings market, driven by architectural, automotive, and industrial demands. Discover key trends in water-borne coatings, resin types like acrylic and polyurethane, and major players shaping this expanding sector.

September 2025
Base Year: 2024
No Of Pages: 120
Price: $3800

UHP Graphite Electrode Market Industry Overview and Projections

Explore the UHP Graphite Electrode Market analysis, forecasts, drivers, and trends. Discover market size exceeding USD 5.5 billion with a CAGR over 5%, driven by EAF steel production and global infrastructure growth.

September 2025
Base Year: 2024
No Of Pages: 234
Price: $4750

Sports Composites Industry Market Predictions: Growth and Size Trends to 2033

Explore the dynamic Sports Composites market, driven by innovation in golf shafts, hockey sticks, bicycles, and more. Discover key drivers, trends, and future growth projections.

September 2025
Base Year: 2024
No Of Pages: 234
Price: $4750

High-Temperature Grease Market Market Expansion: Growth Outlook 2025-2033

Explore the booming High-Temperature Grease Market, driven by automotive, steel, and energy sectors. Discover key trends, growth drivers, and regional insights for this vital industrial lubricant market.

September 2025
Base Year: 2024
No Of Pages: 234
Price: $4750
  • Home
  • About Us
  • Industries
    • Aerospace & Defense
    • Agriculture
    • Animal Nutrition & Wellness
    • Automotive
    • Chemicals & Materials
    • Consumer Goods and Services
    • Energy & Power
    • Financial Services and Investment Intelligence
    • Food & Beverage
    • Home and Property Improvement
    • Hospitality and Tourism
    • Logistics
    • Manufacturing Products and Services
    • Packaging
    • Professional and Commercial Services
    • Real Estate and Construction
    • Retail
    • Technology, Media and Telecom
    • Healthcare
  • Services
  • Contact
Main Logo
  • Home
  • About Us
  • Industries
    • Aerospace & Defense
    • Agriculture
    • Animal Nutrition & Wellness
    • Automotive
    • Chemicals & Materials
    • Consumer Goods and Services
    • Energy & Power
    • Financial Services and Investment Intelligence
    • Food & Beverage
    • Home and Property Improvement
    • Hospitality and Tourism
    • Logistics
    • Manufacturing Products and Services
    • Packaging
    • Professional and Commercial Services
    • Real Estate and Construction
    • Retail
    • Technology, Media and Telecom
    • Healthcare
  • Services
  • Contact
+17162654855
[email protected]

+17162654855

[email protected]

Business Address

Head Office

Ansec House 3 rd floor Tank Road, Yerwada, Pune, Maharashtra 411014

Contact Information

Craig Francis

Business Development Head

+17162654855

[email protected]

Secure Payment Partners

payment image
RetailLogisticsPackagingAutomotiveHealthcareAgricultureEnergy & PowerFood & BeverageAerospace & DefenseChemicals & MaterialsHospitality and TourismAnimal Nutrition & WellnessConsumer Goods and ServicesReal Estate and ConstructionHome and Property ImprovementTechnology, Media and TelecomManufacturing Products and ServicesFinancial Services and Investment Intelligence

© 2025 PRDUA Research & Media Private Limited, All rights reserved

Privacy Policy
Terms and Conditions
FAQ