
Key Insights
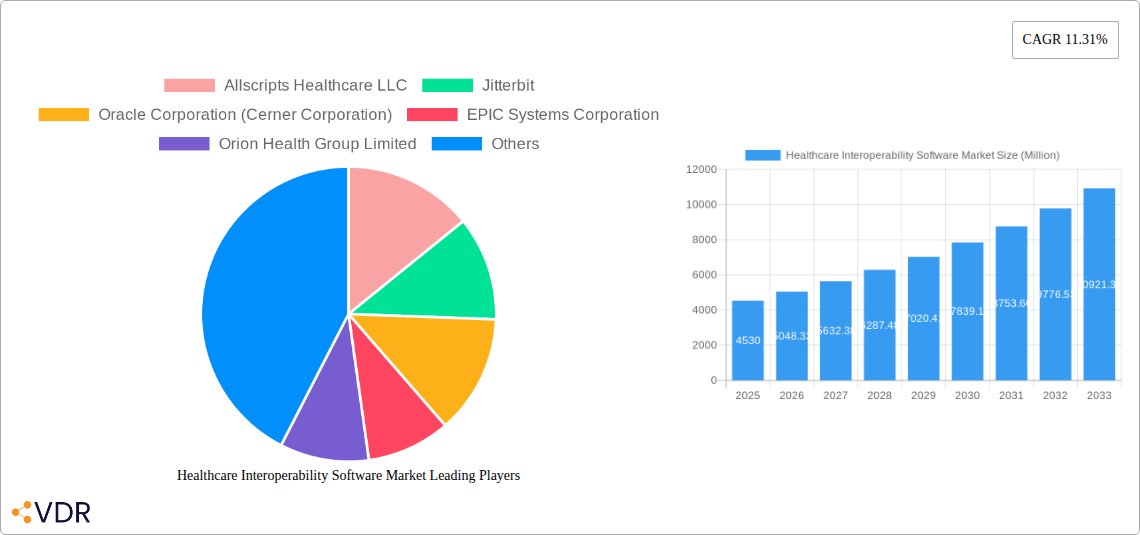
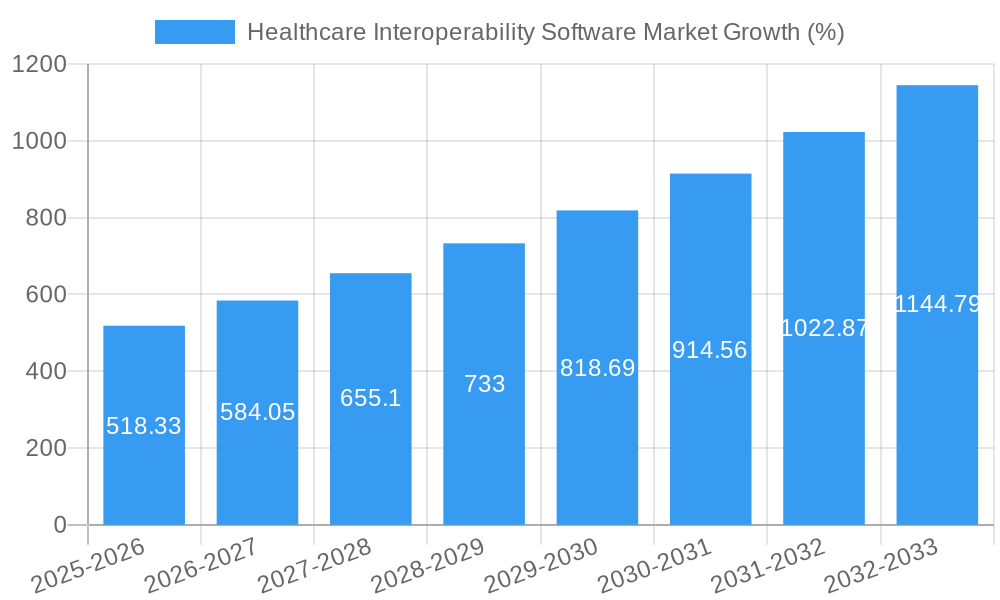
The Healthcare Interoperability Software market is experiencing robust growth, projected to reach $4.53 billion in 2025 and exhibiting a Compound Annual Growth Rate (CAGR) of 11.31% from 2025 to 2033. This expansion is fueled by several key drivers. Increasing government mandates for data exchange and interoperability, coupled with a rising demand for improved patient care coordination and reduced healthcare costs, are significantly impacting market growth. The shift towards value-based care models necessitates seamless data sharing among providers, payers, and pharmacies, creating a strong impetus for interoperability solutions. Technological advancements, such as cloud-based solutions and the adoption of advanced analytics, are further enhancing the capabilities and accessibility of these software platforms. The market is segmented by solution type (solutions and services), deployment (cloud-based and on-premise), and end-user (healthcare providers, payers, and pharmacies), with cloud-based solutions gaining significant traction due to their scalability and cost-effectiveness. Furthermore, the rising adoption of Artificial Intelligence (AI) and Machine Learning (ML) for enhanced data analysis and improved decision-making is poised to drive further market expansion in the coming years.
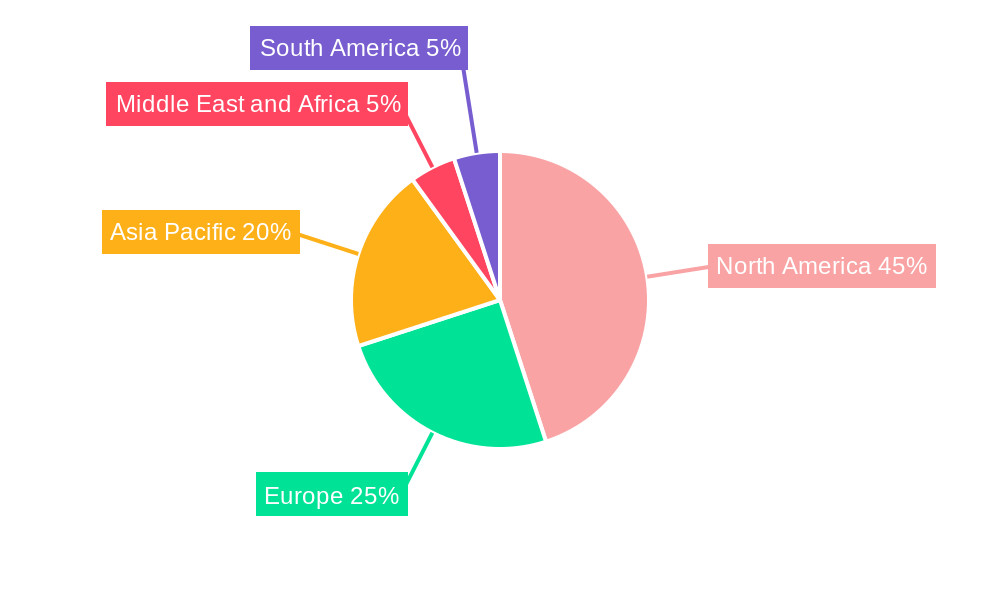
The competitive landscape is characterized by a mix of established players like Allscripts, Epic Systems, Oracle Cerner, and IBM, alongside emerging technology companies. North America currently holds a dominant market share, driven by high healthcare expenditure and advanced technological infrastructure. However, Asia-Pacific and Europe are expected to witness significant growth due to increasing digital health initiatives and government investments in healthcare IT modernization. While market restraints like data security concerns, integration complexities, and high implementation costs exist, the overwhelming benefits of improved patient care, reduced administrative burdens, and enhanced operational efficiencies are expected to outweigh these challenges, resulting in continued market expansion throughout the forecast period. The market's future trajectory points towards a greater focus on AI-powered interoperability solutions, increased adoption of standardized data formats, and a more proactive approach to addressing data security and privacy concerns.
Healthcare Interoperability Software Market: A Comprehensive Report (2019-2033)
This comprehensive report provides an in-depth analysis of the Healthcare Interoperability Software Market, encompassing market dynamics, growth trends, regional dominance, product landscape, key challenges, emerging opportunities, and key players. The report covers the period from 2019 to 2033, with 2025 as the base year and a forecast period extending to 2033. The market is segmented by level (Foundational, Structural, Semantic), type (Solutions, Services), end-user (Healthcare Providers, Healthcare Payers, Pharmacies), and deployment (Cloud-based, On-premise). The total market value is projected to reach xx Million by 2033.
Healthcare Interoperability Software Market Dynamics & Structure
The Healthcare Interoperability Software market is characterized by a moderately concentrated landscape, with a few dominant players and numerous smaller niche providers. Technological innovation, driven by advancements in AI, machine learning, and blockchain, is a key growth driver. Stringent regulatory frameworks, such as HIPAA in the US and GDPR in Europe, significantly impact market dynamics. The market faces competition from alternative solutions like manual data transfer and legacy systems, although their limitations are increasingly evident. The end-user demographic is diverse, encompassing hospitals, clinics, pharmacies, and insurance providers, reflecting the broad applicability of interoperability solutions. M&A activity has been relatively high in recent years, reflecting consolidation within the industry.
- Market Concentration: Moderately concentrated, with the top 5 players holding approximately xx% market share in 2024.
- Technological Innovation: AI, machine learning, and blockchain are driving innovation, enhancing data security and interoperability.
- Regulatory Frameworks: HIPAA, GDPR, and other regulations influence software development and data exchange standards.
- Competitive Substitutes: Manual data transfer and legacy systems present limited competition due to their inefficiencies.
- M&A Activity: An estimated xx M&A deals occurred between 2019 and 2024, driven by consolidation and expansion strategies.
- Innovation Barriers: High development costs, complex integration processes, and data security concerns represent significant barriers to innovation.
Healthcare Interoperability Software Market Growth Trends & Insights
The Healthcare Interoperability Software market experienced robust growth between 2019 and 2024, expanding from xx Million to xx Million, exhibiting a CAGR of xx%. This growth is primarily attributable to the increasing adoption of electronic health records (EHRs), growing demand for improved patient care coordination, and the rising need for seamless data exchange across different healthcare systems. Technological disruptions, like the emergence of cloud-based solutions and AI-powered analytics, further accelerated market expansion. Consumer behavior shifts toward personalized medicine and greater patient engagement also influence the market. Market penetration remains relatively low, particularly in developing regions, indicating substantial future growth potential. The forecast period (2025-2033) anticipates continued growth, with a projected CAGR of xx%, driven by factors like increasing government initiatives, rising healthcare IT spending, and ongoing technological advancements.
Dominant Regions, Countries, or Segments in Healthcare Interoperability Software Market
North America currently dominates the Healthcare Interoperability Software market, driven by factors such as advanced healthcare infrastructure, high adoption rates of EHRs, and favorable regulatory policies. Within North America, the United States holds the largest market share. Europe and Asia Pacific are experiencing significant growth, fueled by increasing government initiatives promoting healthcare digitalization and rising investments in healthcare IT.
- Leading Segment: Healthcare Providers segment holds the largest market share, driven by the increasing need for efficient data management and improved patient care coordination.
- Key Drivers: Government initiatives to improve healthcare data exchange, rising adoption of cloud-based solutions, and increasing healthcare IT investments are key growth drivers.
- Dominance Factors: North America's strong healthcare infrastructure, advanced technology adoption, and robust regulatory support contribute to its market leadership.
- Growth Potential: Asia Pacific presents significant growth potential due to increasing healthcare IT spending and expanding healthcare infrastructure.
Healthcare Interoperability Software Market Product Landscape
The market offers a diverse range of products, including solutions for data exchange, integration, and analytics. Innovations focus on enhancing data security, improving interoperability standards, and integrating AI-powered tools for better data analysis. Key product features include streamlined data workflows, advanced analytics dashboards, and robust security protocols. Cloud-based solutions are gaining popularity due to their scalability, cost-effectiveness, and accessibility. The unique selling propositions lie in the ability to seamlessly connect disparate systems, reduce manual processes, and improve overall efficiency.
Key Drivers, Barriers & Challenges in Healthcare Interoperability Software Market
Key Drivers:
- The increasing adoption of EHRs is driving market growth.
- Government initiatives to promote interoperability are key catalysts.
- The growing need for improved patient care coordination fuels demand.
Challenges & Restraints:
- High initial investment costs can be a barrier to adoption for smaller providers.
- Data security and privacy concerns present significant challenges.
- Integration complexities with legacy systems can hinder adoption.
Emerging Opportunities in Healthcare Interoperability Software Market
- The growing adoption of telehealth is opening up new opportunities for interoperability solutions.
- The increasing use of wearable devices and remote patient monitoring creates a need for secure data integration.
- Artificial intelligence (AI) and machine learning (ML) are creating innovative applications for data analysis and predictive healthcare.
Growth Accelerators in the Healthcare Interoperability Software Market Industry
Technological advancements, particularly in AI, machine learning, and cloud computing, are key growth catalysts. Strategic partnerships between technology providers and healthcare organizations are accelerating market penetration. Expansion into emerging markets and the development of innovative applications, such as personalized medicine platforms, are further driving growth.
Key Players Shaping the Healthcare Interoperability Software Market Market
- Allscripts Healthcare LLC
- Jitterbit
- Oracle Corporation (Cerner Corporation)
- EPIC Systems Corporation
- Orion Health Group Limited
- International Business Machines Corporation (IBM)
- Koninklijke Philips NV
- Koch Software Investments (Infor Inc)
- Virtusa Corporation
- NextGen Healthcare Inc
Notable Milestones in Healthcare Interoperability Software Market Sector
- March 2022: eHealth Exchange receives a USD 550,000 Innovation Grant to boost electronic health information exchange.
- January 2022: The Biden administration releases a governance framework for nationwide health information exchange.
In-Depth Healthcare Interoperability Software Market Market Outlook
The Healthcare Interoperability Software market is poised for sustained growth, driven by increasing demand for improved healthcare efficiency, expanding adoption of cloud-based solutions, and ongoing technological advancements. Strategic partnerships, targeted market expansion into emerging economies, and the development of innovative applications will further shape market dynamics. The future holds significant opportunities for companies that can effectively address data security challenges, integrate AI-powered analytics, and offer seamless interoperability solutions across diverse healthcare settings.
Healthcare Interoperability Software Market Segmentation
-
1. Deployment
- 1.1. Cloud-based
- 1.2. On-premise
-
2. Level
- 2.1. Foundational
- 2.2. Structural
- 2.3. Semantic
-
3. Type
-
3.1. Solutions
- 3.1.1. EHR Interoperability
- 3.1.2. HIE Interoperability
- 3.1.3. Other Types
- 3.2. Services
-
3.1. Solutions
-
4. End User
- 4.1. Healthcare Providers
- 4.2. Healthcare Payers
- 4.3. Pharmacies
Healthcare Interoperability Software Market Segmentation By Geography
-
1. North America
- 1.1. United States
- 1.2. Canada
- 1.3. Mexico
-
2. Europe
- 2.1. Germany
- 2.2. United Kingdom
- 2.3. France
- 2.4. Italy
- 2.5. Spain
- 2.6. Rest of Europe
-
3. Asia Pacific
- 3.1. China
- 3.2. Japan
- 3.3. India
- 3.4. Australia
- 3.5. South Korea
- 3.6. Rest of Asia Pacific
-
4. Middle East and Africa
- 4.1. GCC
- 4.2. South Africa
- 4.3. Rest of Middle East and Africa
-
5. South America
- 5.1. Brazil
- 5.2. Argentina
- 5.3. Rest of South America
Healthcare Interoperability Software Market REPORT HIGHLIGHTS
| Aspects | Details |
|---|---|
| Study Period | 2019-2033 |
| Base Year | 2024 |
| Estimated Year | 2025 |
| Forecast Period | 2025-2033 |
| Historical Period | 2019-2024 |
| Growth Rate | CAGR of 11.31% from 2019-2033 |
| Segmentation |
|
Table of Contents
- 1. Introduction
- 1.1. Research Scope
- 1.2. Market Segmentation
- 1.3. Research Methodology
- 1.4. Definitions and Assumptions
- 2. Executive Summary
- 2.1. Introduction
- 3. Market Dynamics
- 3.1. Introduction
- 3.2. Market Drivers
- 3.2.1. Increasing Investment in IT Healthcare Solutions and Healthcare Interoperability; Rising Concerns Over Increasing Healthcare Costs
- 3.3. Market Restrains
- 3.3.1. Shortage of Skilled Healthcare IT Professionals
- 3.4. Market Trends
- 3.4.1. Service Segment is Expected to Hold a Major Market Share in the Healthcare Interoperability Solutions Market Over the Forecast Period
- 4. Market Factor Analysis
- 4.1. Porters Five Forces
- 4.2. Supply/Value Chain
- 4.3. PESTEL analysis
- 4.4. Market Entropy
- 4.5. Patent/Trademark Analysis
- 5. Global Healthcare Interoperability Software Market Analysis, Insights and Forecast, 2019-2031
- 5.1. Market Analysis, Insights and Forecast - by Deployment
- 5.1.1. Cloud-based
- 5.1.2. On-premise
- 5.2. Market Analysis, Insights and Forecast - by Level
- 5.2.1. Foundational
- 5.2.2. Structural
- 5.2.3. Semantic
- 5.3. Market Analysis, Insights and Forecast - by Type
- 5.3.1. Solutions
- 5.3.1.1. EHR Interoperability
- 5.3.1.2. HIE Interoperability
- 5.3.1.3. Other Types
- 5.3.2. Services
- 5.3.1. Solutions
- 5.4. Market Analysis, Insights and Forecast - by End User
- 5.4.1. Healthcare Providers
- 5.4.2. Healthcare Payers
- 5.4.3. Pharmacies
- 5.5. Market Analysis, Insights and Forecast - by Region
- 5.5.1. North America
- 5.5.2. Europe
- 5.5.3. Asia Pacific
- 5.5.4. Middle East and Africa
- 5.5.5. South America
- 5.1. Market Analysis, Insights and Forecast - by Deployment
- 6. North America Healthcare Interoperability Software Market Analysis, Insights and Forecast, 2019-2031
- 6.1. Market Analysis, Insights and Forecast - by Deployment
- 6.1.1. Cloud-based
- 6.1.2. On-premise
- 6.2. Market Analysis, Insights and Forecast - by Level
- 6.2.1. Foundational
- 6.2.2. Structural
- 6.2.3. Semantic
- 6.3. Market Analysis, Insights and Forecast - by Type
- 6.3.1. Solutions
- 6.3.1.1. EHR Interoperability
- 6.3.1.2. HIE Interoperability
- 6.3.1.3. Other Types
- 6.3.2. Services
- 6.3.1. Solutions
- 6.4. Market Analysis, Insights and Forecast - by End User
- 6.4.1. Healthcare Providers
- 6.4.2. Healthcare Payers
- 6.4.3. Pharmacies
- 6.1. Market Analysis, Insights and Forecast - by Deployment
- 7. Europe Healthcare Interoperability Software Market Analysis, Insights and Forecast, 2019-2031
- 7.1. Market Analysis, Insights and Forecast - by Deployment
- 7.1.1. Cloud-based
- 7.1.2. On-premise
- 7.2. Market Analysis, Insights and Forecast - by Level
- 7.2.1. Foundational
- 7.2.2. Structural
- 7.2.3. Semantic
- 7.3. Market Analysis, Insights and Forecast - by Type
- 7.3.1. Solutions
- 7.3.1.1. EHR Interoperability
- 7.3.1.2. HIE Interoperability
- 7.3.1.3. Other Types
- 7.3.2. Services
- 7.3.1. Solutions
- 7.4. Market Analysis, Insights and Forecast - by End User
- 7.4.1. Healthcare Providers
- 7.4.2. Healthcare Payers
- 7.4.3. Pharmacies
- 7.1. Market Analysis, Insights and Forecast - by Deployment
- 8. Asia Pacific Healthcare Interoperability Software Market Analysis, Insights and Forecast, 2019-2031
- 8.1. Market Analysis, Insights and Forecast - by Deployment
- 8.1.1. Cloud-based
- 8.1.2. On-premise
- 8.2. Market Analysis, Insights and Forecast - by Level
- 8.2.1. Foundational
- 8.2.2. Structural
- 8.2.3. Semantic
- 8.3. Market Analysis, Insights and Forecast - by Type
- 8.3.1. Solutions
- 8.3.1.1. EHR Interoperability
- 8.3.1.2. HIE Interoperability
- 8.3.1.3. Other Types
- 8.3.2. Services
- 8.3.1. Solutions
- 8.4. Market Analysis, Insights and Forecast - by End User
- 8.4.1. Healthcare Providers
- 8.4.2. Healthcare Payers
- 8.4.3. Pharmacies
- 8.1. Market Analysis, Insights and Forecast - by Deployment
- 9. Middle East and Africa Healthcare Interoperability Software Market Analysis, Insights and Forecast, 2019-2031
- 9.1. Market Analysis, Insights and Forecast - by Deployment
- 9.1.1. Cloud-based
- 9.1.2. On-premise
- 9.2. Market Analysis, Insights and Forecast - by Level
- 9.2.1. Foundational
- 9.2.2. Structural
- 9.2.3. Semantic
- 9.3. Market Analysis, Insights and Forecast - by Type
- 9.3.1. Solutions
- 9.3.1.1. EHR Interoperability
- 9.3.1.2. HIE Interoperability
- 9.3.1.3. Other Types
- 9.3.2. Services
- 9.3.1. Solutions
- 9.4. Market Analysis, Insights and Forecast - by End User
- 9.4.1. Healthcare Providers
- 9.4.2. Healthcare Payers
- 9.4.3. Pharmacies
- 9.1. Market Analysis, Insights and Forecast - by Deployment
- 10. South America Healthcare Interoperability Software Market Analysis, Insights and Forecast, 2019-2031
- 10.1. Market Analysis, Insights and Forecast - by Deployment
- 10.1.1. Cloud-based
- 10.1.2. On-premise
- 10.2. Market Analysis, Insights and Forecast - by Level
- 10.2.1. Foundational
- 10.2.2. Structural
- 10.2.3. Semantic
- 10.3. Market Analysis, Insights and Forecast - by Type
- 10.3.1. Solutions
- 10.3.1.1. EHR Interoperability
- 10.3.1.2. HIE Interoperability
- 10.3.1.3. Other Types
- 10.3.2. Services
- 10.3.1. Solutions
- 10.4. Market Analysis, Insights and Forecast - by End User
- 10.4.1. Healthcare Providers
- 10.4.2. Healthcare Payers
- 10.4.3. Pharmacies
- 10.1. Market Analysis, Insights and Forecast - by Deployment
- 11. North America Healthcare Interoperability Software Market Analysis, Insights and Forecast, 2019-2031
- 11.1. Market Analysis, Insights and Forecast - By Country/Sub-region
- 11.1.1 United States
- 11.1.2 Canada
- 11.1.3 Mexico
- 12. Europe Healthcare Interoperability Software Market Analysis, Insights and Forecast, 2019-2031
- 12.1. Market Analysis, Insights and Forecast - By Country/Sub-region
- 12.1.1 Germany
- 12.1.2 United Kingdom
- 12.1.3 France
- 12.1.4 Italy
- 12.1.5 Spain
- 12.1.6 Rest of Europe
- 13. Asia Pacific Healthcare Interoperability Software Market Analysis, Insights and Forecast, 2019-2031
- 13.1. Market Analysis, Insights and Forecast - By Country/Sub-region
- 13.1.1 China
- 13.1.2 Japan
- 13.1.3 India
- 13.1.4 Australia
- 13.1.5 South Korea
- 13.1.6 Rest of Asia Pacific
- 14. Middle East and Africa Healthcare Interoperability Software Market Analysis, Insights and Forecast, 2019-2031
- 14.1. Market Analysis, Insights and Forecast - By Country/Sub-region
- 14.1.1 GCC
- 14.1.2 South Africa
- 14.1.3 Rest of Middle East and Africa
- 15. South America Healthcare Interoperability Software Market Analysis, Insights and Forecast, 2019-2031
- 15.1. Market Analysis, Insights and Forecast - By Country/Sub-region
- 15.1.1 Brazil
- 15.1.2 Argentina
- 15.1.3 Rest of South America
- 16. Competitive Analysis
- 16.1. Global Market Share Analysis 2024
- 16.2. Company Profiles
- 16.2.1 Allscripts Healthcare LLC
- 16.2.1.1. Overview
- 16.2.1.2. Products
- 16.2.1.3. SWOT Analysis
- 16.2.1.4. Recent Developments
- 16.2.1.5. Financials (Based on Availability)
- 16.2.2 Jitterbit
- 16.2.2.1. Overview
- 16.2.2.2. Products
- 16.2.2.3. SWOT Analysis
- 16.2.2.4. Recent Developments
- 16.2.2.5. Financials (Based on Availability)
- 16.2.3 Oracle Corporation (Cerner Corporation)
- 16.2.3.1. Overview
- 16.2.3.2. Products
- 16.2.3.3. SWOT Analysis
- 16.2.3.4. Recent Developments
- 16.2.3.5. Financials (Based on Availability)
- 16.2.4 EPIC Systems Corporation
- 16.2.4.1. Overview
- 16.2.4.2. Products
- 16.2.4.3. SWOT Analysis
- 16.2.4.4. Recent Developments
- 16.2.4.5. Financials (Based on Availability)
- 16.2.5 Orion Health Group Limited
- 16.2.5.1. Overview
- 16.2.5.2. Products
- 16.2.5.3. SWOT Analysis
- 16.2.5.4. Recent Developments
- 16.2.5.5. Financials (Based on Availability)
- 16.2.6 International Business Machines Corporation (IBM)
- 16.2.6.1. Overview
- 16.2.6.2. Products
- 16.2.6.3. SWOT Analysis
- 16.2.6.4. Recent Developments
- 16.2.6.5. Financials (Based on Availability)
- 16.2.7 Koninklijke Philips NV
- 16.2.7.1. Overview
- 16.2.7.2. Products
- 16.2.7.3. SWOT Analysis
- 16.2.7.4. Recent Developments
- 16.2.7.5. Financials (Based on Availability)
- 16.2.8 Koch Software Investments (Infor Inc)
- 16.2.8.1. Overview
- 16.2.8.2. Products
- 16.2.8.3. SWOT Analysis
- 16.2.8.4. Recent Developments
- 16.2.8.5. Financials (Based on Availability)
- 16.2.9 Virtusa Corpopration
- 16.2.9.1. Overview
- 16.2.9.2. Products
- 16.2.9.3. SWOT Analysis
- 16.2.9.4. Recent Developments
- 16.2.9.5. Financials (Based on Availability)
- 16.2.10 NextGen Healthcare Inc
- 16.2.10.1. Overview
- 16.2.10.2. Products
- 16.2.10.3. SWOT Analysis
- 16.2.10.4. Recent Developments
- 16.2.10.5. Financials (Based on Availability)
- 16.2.1 Allscripts Healthcare LLC
List of Figures
- Figure 1: Global Healthcare Interoperability Software Market Revenue Breakdown (Million, %) by Region 2024 & 2032
- Figure 2: North America Healthcare Interoperability Software Market Revenue (Million), by Country 2024 & 2032
- Figure 3: North America Healthcare Interoperability Software Market Revenue Share (%), by Country 2024 & 2032
- Figure 4: Europe Healthcare Interoperability Software Market Revenue (Million), by Country 2024 & 2032
- Figure 5: Europe Healthcare Interoperability Software Market Revenue Share (%), by Country 2024 & 2032
- Figure 6: Asia Pacific Healthcare Interoperability Software Market Revenue (Million), by Country 2024 & 2032
- Figure 7: Asia Pacific Healthcare Interoperability Software Market Revenue Share (%), by Country 2024 & 2032
- Figure 8: Middle East and Africa Healthcare Interoperability Software Market Revenue (Million), by Country 2024 & 2032
- Figure 9: Middle East and Africa Healthcare Interoperability Software Market Revenue Share (%), by Country 2024 & 2032
- Figure 10: South America Healthcare Interoperability Software Market Revenue (Million), by Country 2024 & 2032
- Figure 11: South America Healthcare Interoperability Software Market Revenue Share (%), by Country 2024 & 2032
- Figure 12: North America Healthcare Interoperability Software Market Revenue (Million), by Deployment 2024 & 2032
- Figure 13: North America Healthcare Interoperability Software Market Revenue Share (%), by Deployment 2024 & 2032
- Figure 14: North America Healthcare Interoperability Software Market Revenue (Million), by Level 2024 & 2032
- Figure 15: North America Healthcare Interoperability Software Market Revenue Share (%), by Level 2024 & 2032
- Figure 16: North America Healthcare Interoperability Software Market Revenue (Million), by Type 2024 & 2032
- Figure 17: North America Healthcare Interoperability Software Market Revenue Share (%), by Type 2024 & 2032
- Figure 18: North America Healthcare Interoperability Software Market Revenue (Million), by End User 2024 & 2032
- Figure 19: North America Healthcare Interoperability Software Market Revenue Share (%), by End User 2024 & 2032
- Figure 20: North America Healthcare Interoperability Software Market Revenue (Million), by Country 2024 & 2032
- Figure 21: North America Healthcare Interoperability Software Market Revenue Share (%), by Country 2024 & 2032
- Figure 22: Europe Healthcare Interoperability Software Market Revenue (Million), by Deployment 2024 & 2032
- Figure 23: Europe Healthcare Interoperability Software Market Revenue Share (%), by Deployment 2024 & 2032
- Figure 24: Europe Healthcare Interoperability Software Market Revenue (Million), by Level 2024 & 2032
- Figure 25: Europe Healthcare Interoperability Software Market Revenue Share (%), by Level 2024 & 2032
- Figure 26: Europe Healthcare Interoperability Software Market Revenue (Million), by Type 2024 & 2032
- Figure 27: Europe Healthcare Interoperability Software Market Revenue Share (%), by Type 2024 & 2032
- Figure 28: Europe Healthcare Interoperability Software Market Revenue (Million), by End User 2024 & 2032
- Figure 29: Europe Healthcare Interoperability Software Market Revenue Share (%), by End User 2024 & 2032
- Figure 30: Europe Healthcare Interoperability Software Market Revenue (Million), by Country 2024 & 2032
- Figure 31: Europe Healthcare Interoperability Software Market Revenue Share (%), by Country 2024 & 2032
- Figure 32: Asia Pacific Healthcare Interoperability Software Market Revenue (Million), by Deployment 2024 & 2032
- Figure 33: Asia Pacific Healthcare Interoperability Software Market Revenue Share (%), by Deployment 2024 & 2032
- Figure 34: Asia Pacific Healthcare Interoperability Software Market Revenue (Million), by Level 2024 & 2032
- Figure 35: Asia Pacific Healthcare Interoperability Software Market Revenue Share (%), by Level 2024 & 2032
- Figure 36: Asia Pacific Healthcare Interoperability Software Market Revenue (Million), by Type 2024 & 2032
- Figure 37: Asia Pacific Healthcare Interoperability Software Market Revenue Share (%), by Type 2024 & 2032
- Figure 38: Asia Pacific Healthcare Interoperability Software Market Revenue (Million), by End User 2024 & 2032
- Figure 39: Asia Pacific Healthcare Interoperability Software Market Revenue Share (%), by End User 2024 & 2032
- Figure 40: Asia Pacific Healthcare Interoperability Software Market Revenue (Million), by Country 2024 & 2032
- Figure 41: Asia Pacific Healthcare Interoperability Software Market Revenue Share (%), by Country 2024 & 2032
- Figure 42: Middle East and Africa Healthcare Interoperability Software Market Revenue (Million), by Deployment 2024 & 2032
- Figure 43: Middle East and Africa Healthcare Interoperability Software Market Revenue Share (%), by Deployment 2024 & 2032
- Figure 44: Middle East and Africa Healthcare Interoperability Software Market Revenue (Million), by Level 2024 & 2032
- Figure 45: Middle East and Africa Healthcare Interoperability Software Market Revenue Share (%), by Level 2024 & 2032
- Figure 46: Middle East and Africa Healthcare Interoperability Software Market Revenue (Million), by Type 2024 & 2032
- Figure 47: Middle East and Africa Healthcare Interoperability Software Market Revenue Share (%), by Type 2024 & 2032
- Figure 48: Middle East and Africa Healthcare Interoperability Software Market Revenue (Million), by End User 2024 & 2032
- Figure 49: Middle East and Africa Healthcare Interoperability Software Market Revenue Share (%), by End User 2024 & 2032
- Figure 50: Middle East and Africa Healthcare Interoperability Software Market Revenue (Million), by Country 2024 & 2032
- Figure 51: Middle East and Africa Healthcare Interoperability Software Market Revenue Share (%), by Country 2024 & 2032
- Figure 52: South America Healthcare Interoperability Software Market Revenue (Million), by Deployment 2024 & 2032
- Figure 53: South America Healthcare Interoperability Software Market Revenue Share (%), by Deployment 2024 & 2032
- Figure 54: South America Healthcare Interoperability Software Market Revenue (Million), by Level 2024 & 2032
- Figure 55: South America Healthcare Interoperability Software Market Revenue Share (%), by Level 2024 & 2032
- Figure 56: South America Healthcare Interoperability Software Market Revenue (Million), by Type 2024 & 2032
- Figure 57: South America Healthcare Interoperability Software Market Revenue Share (%), by Type 2024 & 2032
- Figure 58: South America Healthcare Interoperability Software Market Revenue (Million), by End User 2024 & 2032
- Figure 59: South America Healthcare Interoperability Software Market Revenue Share (%), by End User 2024 & 2032
- Figure 60: South America Healthcare Interoperability Software Market Revenue (Million), by Country 2024 & 2032
- Figure 61: South America Healthcare Interoperability Software Market Revenue Share (%), by Country 2024 & 2032
List of Tables
- Table 1: Global Healthcare Interoperability Software Market Revenue Million Forecast, by Region 2019 & 2032
- Table 2: Global Healthcare Interoperability Software Market Revenue Million Forecast, by Deployment 2019 & 2032
- Table 3: Global Healthcare Interoperability Software Market Revenue Million Forecast, by Level 2019 & 2032
- Table 4: Global Healthcare Interoperability Software Market Revenue Million Forecast, by Type 2019 & 2032
- Table 5: Global Healthcare Interoperability Software Market Revenue Million Forecast, by End User 2019 & 2032
- Table 6: Global Healthcare Interoperability Software Market Revenue Million Forecast, by Region 2019 & 2032
- Table 7: Global Healthcare Interoperability Software Market Revenue Million Forecast, by Country 2019 & 2032
- Table 8: United States Healthcare Interoperability Software Market Revenue (Million) Forecast, by Application 2019 & 2032
- Table 9: Canada Healthcare Interoperability Software Market Revenue (Million) Forecast, by Application 2019 & 2032
- Table 10: Mexico Healthcare Interoperability Software Market Revenue (Million) Forecast, by Application 2019 & 2032
- Table 11: Global Healthcare Interoperability Software Market Revenue Million Forecast, by Country 2019 & 2032
- Table 12: Germany Healthcare Interoperability Software Market Revenue (Million) Forecast, by Application 2019 & 2032
- Table 13: United Kingdom Healthcare Interoperability Software Market Revenue (Million) Forecast, by Application 2019 & 2032
- Table 14: France Healthcare Interoperability Software Market Revenue (Million) Forecast, by Application 2019 & 2032
- Table 15: Italy Healthcare Interoperability Software Market Revenue (Million) Forecast, by Application 2019 & 2032
- Table 16: Spain Healthcare Interoperability Software Market Revenue (Million) Forecast, by Application 2019 & 2032
- Table 17: Rest of Europe Healthcare Interoperability Software Market Revenue (Million) Forecast, by Application 2019 & 2032
- Table 18: Global Healthcare Interoperability Software Market Revenue Million Forecast, by Country 2019 & 2032
- Table 19: China Healthcare Interoperability Software Market Revenue (Million) Forecast, by Application 2019 & 2032
- Table 20: Japan Healthcare Interoperability Software Market Revenue (Million) Forecast, by Application 2019 & 2032
- Table 21: India Healthcare Interoperability Software Market Revenue (Million) Forecast, by Application 2019 & 2032
- Table 22: Australia Healthcare Interoperability Software Market Revenue (Million) Forecast, by Application 2019 & 2032
- Table 23: South Korea Healthcare Interoperability Software Market Revenue (Million) Forecast, by Application 2019 & 2032
- Table 24: Rest of Asia Pacific Healthcare Interoperability Software Market Revenue (Million) Forecast, by Application 2019 & 2032
- Table 25: Global Healthcare Interoperability Software Market Revenue Million Forecast, by Country 2019 & 2032
- Table 26: GCC Healthcare Interoperability Software Market Revenue (Million) Forecast, by Application 2019 & 2032
- Table 27: South Africa Healthcare Interoperability Software Market Revenue (Million) Forecast, by Application 2019 & 2032
- Table 28: Rest of Middle East and Africa Healthcare Interoperability Software Market Revenue (Million) Forecast, by Application 2019 & 2032
- Table 29: Global Healthcare Interoperability Software Market Revenue Million Forecast, by Country 2019 & 2032
- Table 30: Brazil Healthcare Interoperability Software Market Revenue (Million) Forecast, by Application 2019 & 2032
- Table 31: Argentina Healthcare Interoperability Software Market Revenue (Million) Forecast, by Application 2019 & 2032
- Table 32: Rest of South America Healthcare Interoperability Software Market Revenue (Million) Forecast, by Application 2019 & 2032
- Table 33: Global Healthcare Interoperability Software Market Revenue Million Forecast, by Deployment 2019 & 2032
- Table 34: Global Healthcare Interoperability Software Market Revenue Million Forecast, by Level 2019 & 2032
- Table 35: Global Healthcare Interoperability Software Market Revenue Million Forecast, by Type 2019 & 2032
- Table 36: Global Healthcare Interoperability Software Market Revenue Million Forecast, by End User 2019 & 2032
- Table 37: Global Healthcare Interoperability Software Market Revenue Million Forecast, by Country 2019 & 2032
- Table 38: United States Healthcare Interoperability Software Market Revenue (Million) Forecast, by Application 2019 & 2032
- Table 39: Canada Healthcare Interoperability Software Market Revenue (Million) Forecast, by Application 2019 & 2032
- Table 40: Mexico Healthcare Interoperability Software Market Revenue (Million) Forecast, by Application 2019 & 2032
- Table 41: Global Healthcare Interoperability Software Market Revenue Million Forecast, by Deployment 2019 & 2032
- Table 42: Global Healthcare Interoperability Software Market Revenue Million Forecast, by Level 2019 & 2032
- Table 43: Global Healthcare Interoperability Software Market Revenue Million Forecast, by Type 2019 & 2032
- Table 44: Global Healthcare Interoperability Software Market Revenue Million Forecast, by End User 2019 & 2032
- Table 45: Global Healthcare Interoperability Software Market Revenue Million Forecast, by Country 2019 & 2032
- Table 46: Germany Healthcare Interoperability Software Market Revenue (Million) Forecast, by Application 2019 & 2032
- Table 47: United Kingdom Healthcare Interoperability Software Market Revenue (Million) Forecast, by Application 2019 & 2032
- Table 48: France Healthcare Interoperability Software Market Revenue (Million) Forecast, by Application 2019 & 2032
- Table 49: Italy Healthcare Interoperability Software Market Revenue (Million) Forecast, by Application 2019 & 2032
- Table 50: Spain Healthcare Interoperability Software Market Revenue (Million) Forecast, by Application 2019 & 2032
- Table 51: Rest of Europe Healthcare Interoperability Software Market Revenue (Million) Forecast, by Application 2019 & 2032
- Table 52: Global Healthcare Interoperability Software Market Revenue Million Forecast, by Deployment 2019 & 2032
- Table 53: Global Healthcare Interoperability Software Market Revenue Million Forecast, by Level 2019 & 2032
- Table 54: Global Healthcare Interoperability Software Market Revenue Million Forecast, by Type 2019 & 2032
- Table 55: Global Healthcare Interoperability Software Market Revenue Million Forecast, by End User 2019 & 2032
- Table 56: Global Healthcare Interoperability Software Market Revenue Million Forecast, by Country 2019 & 2032
- Table 57: China Healthcare Interoperability Software Market Revenue (Million) Forecast, by Application 2019 & 2032
- Table 58: Japan Healthcare Interoperability Software Market Revenue (Million) Forecast, by Application 2019 & 2032
- Table 59: India Healthcare Interoperability Software Market Revenue (Million) Forecast, by Application 2019 & 2032
- Table 60: Australia Healthcare Interoperability Software Market Revenue (Million) Forecast, by Application 2019 & 2032
- Table 61: South Korea Healthcare Interoperability Software Market Revenue (Million) Forecast, by Application 2019 & 2032
- Table 62: Rest of Asia Pacific Healthcare Interoperability Software Market Revenue (Million) Forecast, by Application 2019 & 2032
- Table 63: Global Healthcare Interoperability Software Market Revenue Million Forecast, by Deployment 2019 & 2032
- Table 64: Global Healthcare Interoperability Software Market Revenue Million Forecast, by Level 2019 & 2032
- Table 65: Global Healthcare Interoperability Software Market Revenue Million Forecast, by Type 2019 & 2032
- Table 66: Global Healthcare Interoperability Software Market Revenue Million Forecast, by End User 2019 & 2032
- Table 67: Global Healthcare Interoperability Software Market Revenue Million Forecast, by Country 2019 & 2032
- Table 68: GCC Healthcare Interoperability Software Market Revenue (Million) Forecast, by Application 2019 & 2032
- Table 69: South Africa Healthcare Interoperability Software Market Revenue (Million) Forecast, by Application 2019 & 2032
- Table 70: Rest of Middle East and Africa Healthcare Interoperability Software Market Revenue (Million) Forecast, by Application 2019 & 2032
- Table 71: Global Healthcare Interoperability Software Market Revenue Million Forecast, by Deployment 2019 & 2032
- Table 72: Global Healthcare Interoperability Software Market Revenue Million Forecast, by Level 2019 & 2032
- Table 73: Global Healthcare Interoperability Software Market Revenue Million Forecast, by Type 2019 & 2032
- Table 74: Global Healthcare Interoperability Software Market Revenue Million Forecast, by End User 2019 & 2032
- Table 75: Global Healthcare Interoperability Software Market Revenue Million Forecast, by Country 2019 & 2032
- Table 76: Brazil Healthcare Interoperability Software Market Revenue (Million) Forecast, by Application 2019 & 2032
- Table 77: Argentina Healthcare Interoperability Software Market Revenue (Million) Forecast, by Application 2019 & 2032
- Table 78: Rest of South America Healthcare Interoperability Software Market Revenue (Million) Forecast, by Application 2019 & 2032
Frequently Asked Questions
1. What is the projected Compound Annual Growth Rate (CAGR) of the Healthcare Interoperability Software Market?
The projected CAGR is approximately 11.31%.
2. Which companies are prominent players in the Healthcare Interoperability Software Market?
Key companies in the market include Allscripts Healthcare LLC, Jitterbit, Oracle Corporation (Cerner Corporation), EPIC Systems Corporation, Orion Health Group Limited, International Business Machines Corporation (IBM), Koninklijke Philips NV, Koch Software Investments (Infor Inc), Virtusa Corpopration, NextGen Healthcare Inc.
3. What are the main segments of the Healthcare Interoperability Software Market?
The market segments include Deployment, Level, Type, End User.
4. Can you provide details about the market size?
The market size is estimated to be USD 4.53 Million as of 2022.
5. What are some drivers contributing to market growth?
Increasing Investment in IT Healthcare Solutions and Healthcare Interoperability; Rising Concerns Over Increasing Healthcare Costs.
6. What are the notable trends driving market growth?
Service Segment is Expected to Hold a Major Market Share in the Healthcare Interoperability Solutions Market Over the Forecast Period.
7. Are there any restraints impacting market growth?
Shortage of Skilled Healthcare IT Professionals.
8. Can you provide examples of recent developments in the market?
In March 2022, eHealth Exchange, the non-profit health information network that connects providers and federal agencies, received a new Innovation Grant program of USD 550,000 to help catalyze new and innovative ways to boost electronic health information exchange or build new technical connectivity tools.
9. What pricing options are available for accessing the report?
Pricing options include single-user, multi-user, and enterprise licenses priced at USD 4750, USD 5250, and USD 8750 respectively.
10. Is the market size provided in terms of value or volume?
The market size is provided in terms of value, measured in Million.
11. Are there any specific market keywords associated with the report?
Yes, the market keyword associated with the report is "Healthcare Interoperability Software Market," which aids in identifying and referencing the specific market segment covered.
12. How do I determine which pricing option suits my needs best?
The pricing options vary based on user requirements and access needs. Individual users may opt for single-user licenses, while businesses requiring broader access may choose multi-user or enterprise licenses for cost-effective access to the report.
13. Are there any additional resources or data provided in the Healthcare Interoperability Software Market report?
While the report offers comprehensive insights, it's advisable to review the specific contents or supplementary materials provided to ascertain if additional resources or data are available.
14. How can I stay updated on further developments or reports in the Healthcare Interoperability Software Market?
To stay informed about further developments, trends, and reports in the Healthcare Interoperability Software Market, consider subscribing to industry newsletters, following relevant companies and organizations, or regularly checking reputable industry news sources and publications.
Methodology
Step 1 - Identification of Relevant Samples Size from Population Database


Step 2 - Approaches for Defining Global Market Size (Value, Volume* & Price*)

Note*: In applicable scenarios
Step 3 - Data Sources
Primary Research
- Web Analytics
- Survey Reports
- Research Institute
- Latest Research Reports
- Opinion Leaders
Secondary Research
- Annual Reports
- White Paper
- Latest Press Release
- Industry Association
- Paid Database
- Investor Presentations

Step 4 - Data Triangulation
Involves using different sources of information in order to increase the validity of a study
These sources are likely to be stakeholders in a program - participants, other researchers, program staff, other community members, and so on.
Then we put all data in single framework & apply various statistical tools to find out the dynamic on the market.
During the analysis stage, feedback from the stakeholder groups would be compared to determine areas of agreement as well as areas of divergence


