
Key Insights
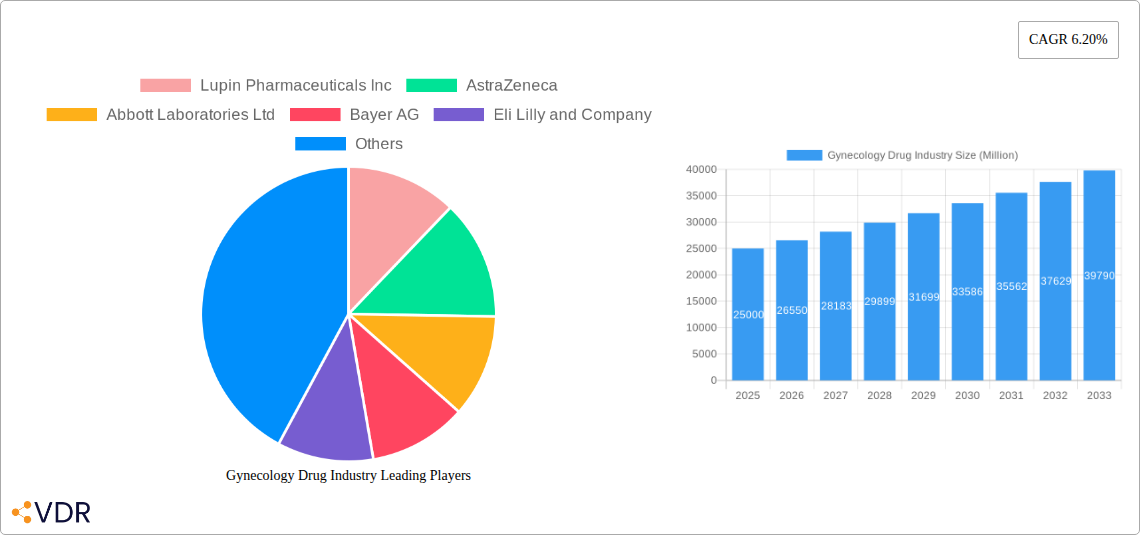
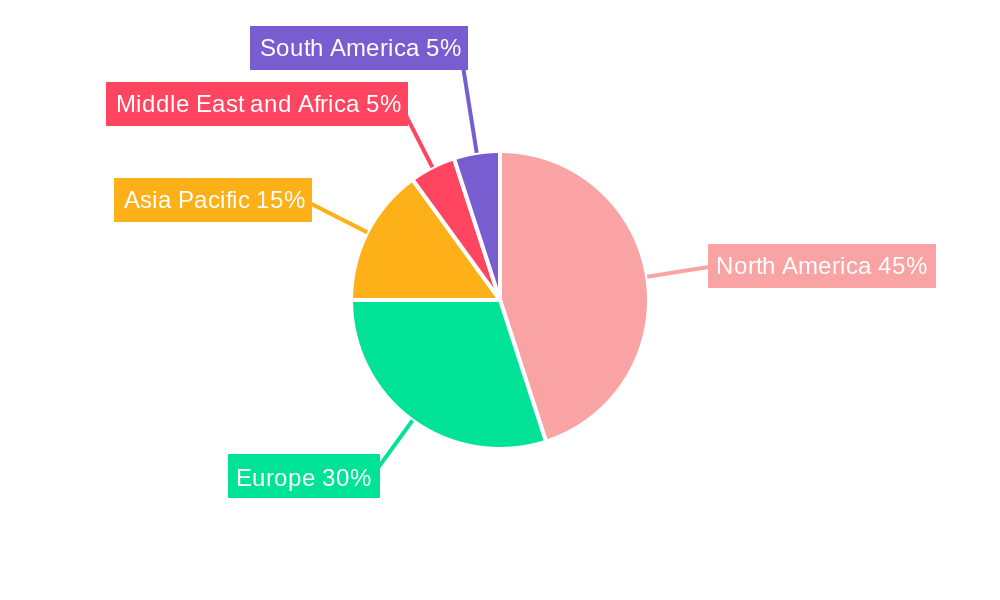
The gynecology drug market, valued at approximately $XX million in 2025, is poised for robust growth, exhibiting a compound annual growth rate (CAGR) of 6.20% from 2025 to 2033. This expansion is fueled by several key drivers. Increasing prevalence of gynecological cancers, including uterine, ovarian, and cervical cancers, necessitates a higher demand for effective therapies. Furthermore, the rising incidence of menopausal disorders and polycystic ovary syndrome (PCOS) among women globally is significantly contributing to market growth. Advances in hormonal and non-hormonal therapies, along with the development of targeted treatments, are further propelling market expansion. The market is segmented by therapeutics (hormonal and non-hormonal), indication (gynecological cancers, menopausal disorders, PCOS, contraception, and other indications), and distribution channel (hospital pharmacies, retail pharmacies, and online pharmacies). North America and Europe currently dominate the market, owing to high healthcare expenditure and advanced healthcare infrastructure. However, the Asia-Pacific region is projected to witness significant growth, driven by rising disposable incomes, improved healthcare access, and increasing awareness of women's health issues.
Despite the positive outlook, the market faces certain challenges. High drug costs and stringent regulatory approvals can hinder market penetration, particularly in developing economies. Generic competition and the emergence of biosimilars may also put pressure on pricing and profitability for established players. However, the continued investment in research and development, coupled with the increasing focus on personalized medicine and targeted therapies, is expected to overcome these restraints and maintain the market's upward trajectory. Major players like Lupin Pharmaceuticals Inc, AstraZeneca, Abbott Laboratories Ltd, Bayer AG, Eli Lilly and Company, AbbVie Inc, GSK plc, TherapeuticsMD Inc, Ferring Holding SA, Johnson & Johnson, and Pfizer Inc are actively engaged in developing innovative therapies and expanding their market share. The strategic partnerships and collaborations amongst these companies are further expected to boost the market growth in the coming years.
Gynecology Drug Industry Market Report: 2019-2033
This comprehensive report provides an in-depth analysis of the Gynecology Drug Industry, encompassing market dynamics, growth trends, competitive landscape, and future outlook. The report covers the period 2019-2033, with a focus on the forecast period 2025-2033 and a base year of 2025. The market is segmented by therapeutics (Hormonal Therapy, Non-hormonal Therapy), indication (Gynecology Cancers, Menopausal Disorder, Polycystic Ovary Syndrome, Contraception, Other Indications), and distribution channel (Hospital Pharmacies, Retail Pharmacies, Online Pharmacies). Key players analyzed include Lupin Pharmaceuticals Inc, AstraZeneca, Abbott Laboratories Ltd, Bayer AG, Eli Lilly and Company, AbbVie Inc, GSK plc, TherapeuticsMD Inc, Ferring Holding SA, Johnson & Johnson, and Pfizer Inc. The report's value is presented in million units.
Gynecology Drug Industry Market Dynamics & Structure
The gynecology drug market is characterized by a moderately concentrated landscape, with a few major players holding significant market share. Technological innovation, particularly in targeted therapies and personalized medicine, is a key driver of growth. Stringent regulatory frameworks, including FDA approvals in the US and EMA approvals in Europe, significantly influence market access and product lifecycle management. The market experiences competition from alternative therapies, including surgical interventions and lifestyle modifications. The end-user demographics are primarily women of reproductive age and older women experiencing menopausal symptoms. M&A activity has been moderate, with strategic acquisitions aimed at expanding product portfolios and geographical reach.
- Market Concentration: xx% held by top 5 players in 2024.
- Technological Innovation: Focus on targeted therapies, personalized medicine, and biosimilars.
- Regulatory Landscape: Stringent approval processes impacting time to market and cost.
- Competitive Substitutes: Surgical interventions, alternative medicines, and lifestyle changes.
- M&A Activity: xx deals in the last 5 years, primarily focused on expansion and diversification.
- Innovation Barriers: High R&D costs, stringent regulatory pathways, and complex clinical trials.
Gynecology Drug Industry Growth Trends & Insights
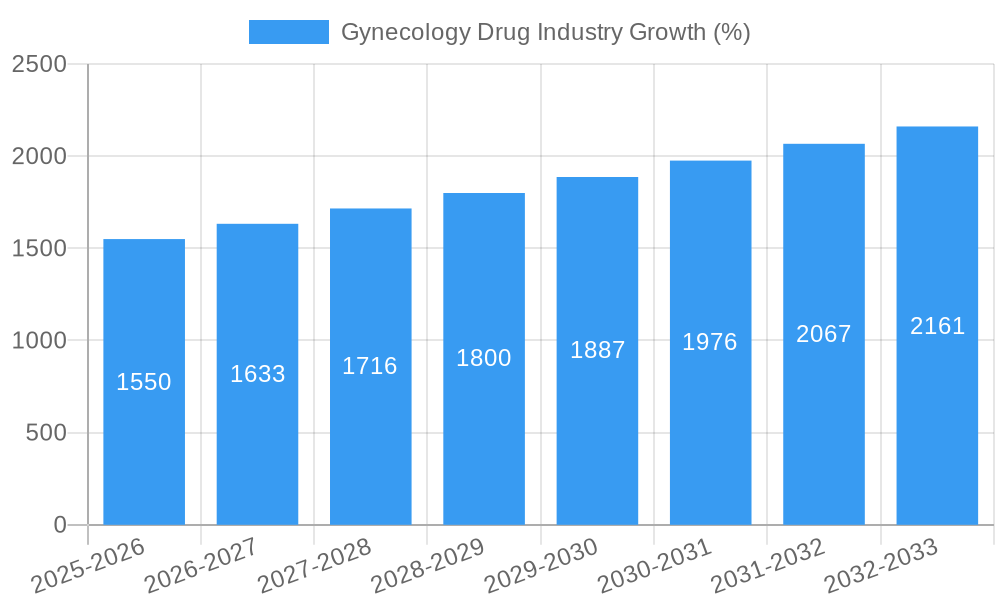
The gynecology drug market exhibits robust growth, driven by increasing prevalence of gynecological disorders, rising healthcare expenditure, and growing awareness about women's health. The market size is projected to reach xx million units by 2033, exhibiting a CAGR of xx% during the forecast period. Adoption rates for novel therapies are increasing, particularly for targeted treatments for gynecological cancers. Technological advancements, such as improved diagnostic tools and personalized medicine approaches, are further accelerating market growth. Consumer behavior is shifting towards greater preference for convenient and accessible healthcare solutions, including online pharmacies and telehealth platforms.
Dominant Regions, Countries, or Segments in Gynecology Drug Industry
The North American market dominates the global gynecology drug market, driven by high healthcare expenditure, advanced healthcare infrastructure, and a large patient pool. Within indications, Gynecology Cancers and Menopausal Disorders represent the largest segments due to high prevalence and significant unmet needs. By therapeutics, Hormonal Therapy holds a larger market share compared to Non-hormonal Therapy. The Retail Pharmacies distribution channel is the most dominant, reflecting increased patient access to medications.
Key Drivers: High prevalence of target conditions, rising healthcare spending, increasing awareness of women's health issues.
North America Dominance: High healthcare expenditure, advanced infrastructure, robust R&D activities, and strong regulatory support.
Europe Growth: Growing prevalence of gynecological disorders, increasing investments in healthcare infrastructure.
Asia-Pacific Expansion: High population growth, rising disposable incomes, and increasing awareness of women's health.
Largest Segments: Gynecological Cancers (xx million units), Menopausal Disorders (xx million units), Hormonal Therapies (xx million units).
Gynecology Drug Industry Product Landscape
The gynecology drug market offers a diverse range of products, including hormonal therapies (e.g., oral contraceptives, hormone replacement therapy), non-hormonal therapies (e.g., analgesics, antibiotics), and targeted therapies for specific gynecological cancers. Product innovations focus on improving efficacy, reducing side effects, and enhancing patient convenience. Technological advancements such as targeted drug delivery systems and personalized medicine approaches are shaping the product landscape. Unique selling propositions include improved efficacy, reduced side effects, and improved patient compliance.
Key Drivers, Barriers & Challenges in Gynecology Drug Industry
Key drivers include the rising prevalence of gynecological disorders, increasing healthcare expenditure, and technological advancements in drug development. Government initiatives promoting women's health also stimulate market growth. Challenges include stringent regulatory pathways, high R&D costs, patent expirations leading to biosimilar competition, and reimbursement complexities. Supply chain disruptions can also impact market availability and pricing. The market faces competitive pressure from both established players and emerging biotech companies.
Emerging Opportunities in Gynecology Drug Industry
Untapped markets in emerging economies present significant growth opportunities. Innovative drug delivery systems, personalized medicine approaches, and development of novel therapies for unmet needs offer lucrative opportunities. Evolving consumer preferences towards convenient and accessible healthcare solutions, including telemedicine and online pharmacies, also create new market avenues.
Growth Accelerators in the Gynecology Drug Industry
Technological advancements, strategic partnerships, and market expansion into untapped regions are driving long-term growth. The development of novel therapies, focusing on personalized medicine and improved efficacy, will further propel market expansion. Increased investments in R&D and collaborations between pharmaceutical companies and research institutions will accelerate innovation and product development.
Key Players Shaping the Gynecology Drug Industry Market
- Lupin Pharmaceuticals Inc
- AstraZeneca
- Abbott Laboratories Ltd
- Bayer AG
- Eli Lilly and Company
- AbbVie Inc
- GSK plc
- TherapeuticsMD Inc
- Ferring Holding SA
- Johnson & Johnson
- Pfizer Inc
Notable Milestones in Gynecology Drug Industry Sector
- September 2022: Lynparza received approval in China as the first-line maintenance treatment with bevacizumab for homologous recombination deficiency (HRD)-positive advanced ovarian cancer. This expands treatment options and market access for this specific patient population.
- February 2023: GSK plc announced that the United States Food Drug Administration (FDA) granted full approval for Jemperli for the treatment of adult patients with mismatch repair-deficient (dMMR) recurrent or advanced endometrial cancer. This approval significantly expands the market for Jemperli.
In-Depth Gynecology Drug Industry Market Outlook
The gynecology drug market is poised for sustained growth, driven by a confluence of factors including technological innovation, unmet medical needs, and expanding access to healthcare. Strategic partnerships, increased investment in R&D, and expansion into emerging markets present lucrative opportunities for market players. The focus on personalized medicine and targeted therapies will further shape the future of the industry, offering improved treatment outcomes and enhanced patient experiences.
Gynecology Drug Industry Segmentation
-
1. Therapeutics
- 1.1. Hormonal Therapy
- 1.2. Non-hormonal Therapy
-
2. Indication
- 2.1. Gynecology Cancers
- 2.2. Menopausal Disorder
- 2.3. Polycystic Ovary Syndrome
- 2.4. Contraception
- 2.5. Other Indications
-
3. Distribution Channel
- 3.1. Hospital Pharmacies
- 3.2. Retail Pharmacies
- 3.3. Online Pharmacies
Gynecology Drug Industry Segmentation By Geography
-
1. North America
- 1.1. United States
- 1.2. Canada
- 1.3. Mexico
-
2. Europe
- 2.1. Germany
- 2.2. United Kingdom
- 2.3. France
- 2.4. Italy
- 2.5. Spain
- 2.6. Rest of Europe
-
3. Asia Pacific
- 3.1. China
- 3.2. Japan
- 3.3. India
- 3.4. Australia
- 3.5. South Korea
- 3.6. Rest of Asia Pacific
-
4. Middle East and Africa
- 4.1. GCC
- 4.2. South Africa
- 4.3. Rest of Middle East and Africa
-
5. South America
- 5.1. Brazil
- 5.2. Argentina
- 5.3. Rest of South America
Gynecology Drug Industry REPORT HIGHLIGHTS
| Aspects | Details |
|---|---|
| Study Period | 2019-2033 |
| Base Year | 2024 |
| Estimated Year | 2025 |
| Forecast Period | 2025-2033 |
| Historical Period | 2019-2024 |
| Growth Rate | CAGR of 6.20% from 2019-2033 |
| Segmentation |
|
Table of Contents
- 1. Introduction
- 1.1. Research Scope
- 1.2. Market Segmentation
- 1.3. Research Methodology
- 1.4. Definitions and Assumptions
- 2. Executive Summary
- 2.1. Introduction
- 3. Market Dynamics
- 3.1. Introduction
- 3.2. Market Drivers
- 3.2.1. Increasing Burden of Gynecological Diseases; Rise in Healthcare Awareness Along with Increasing Ageing Female Population
- 3.3. Market Restrains
- 3.3.1. High Cost and Stringent Regulatory Framework that Delays the Approval of the Drugs
- 3.4. Market Trends
- 3.4.1. Non-hormonal Therapy Segment is Expected to Witness High Growth Over the Forecast Period
- 4. Market Factor Analysis
- 4.1. Porters Five Forces
- 4.2. Supply/Value Chain
- 4.3. PESTEL analysis
- 4.4. Market Entropy
- 4.5. Patent/Trademark Analysis
- 5. Global Gynecology Drug Industry Analysis, Insights and Forecast, 2019-2031
- 5.1. Market Analysis, Insights and Forecast - by Therapeutics
- 5.1.1. Hormonal Therapy
- 5.1.2. Non-hormonal Therapy
- 5.2. Market Analysis, Insights and Forecast - by Indication
- 5.2.1. Gynecology Cancers
- 5.2.2. Menopausal Disorder
- 5.2.3. Polycystic Ovary Syndrome
- 5.2.4. Contraception
- 5.2.5. Other Indications
- 5.3. Market Analysis, Insights and Forecast - by Distribution Channel
- 5.3.1. Hospital Pharmacies
- 5.3.2. Retail Pharmacies
- 5.3.3. Online Pharmacies
- 5.4. Market Analysis, Insights and Forecast - by Region
- 5.4.1. North America
- 5.4.2. Europe
- 5.4.3. Asia Pacific
- 5.4.4. Middle East and Africa
- 5.4.5. South America
- 5.1. Market Analysis, Insights and Forecast - by Therapeutics
- 6. North America Gynecology Drug Industry Analysis, Insights and Forecast, 2019-2031
- 6.1. Market Analysis, Insights and Forecast - by Therapeutics
- 6.1.1. Hormonal Therapy
- 6.1.2. Non-hormonal Therapy
- 6.2. Market Analysis, Insights and Forecast - by Indication
- 6.2.1. Gynecology Cancers
- 6.2.2. Menopausal Disorder
- 6.2.3. Polycystic Ovary Syndrome
- 6.2.4. Contraception
- 6.2.5. Other Indications
- 6.3. Market Analysis, Insights and Forecast - by Distribution Channel
- 6.3.1. Hospital Pharmacies
- 6.3.2. Retail Pharmacies
- 6.3.3. Online Pharmacies
- 6.1. Market Analysis, Insights and Forecast - by Therapeutics
- 7. Europe Gynecology Drug Industry Analysis, Insights and Forecast, 2019-2031
- 7.1. Market Analysis, Insights and Forecast - by Therapeutics
- 7.1.1. Hormonal Therapy
- 7.1.2. Non-hormonal Therapy
- 7.2. Market Analysis, Insights and Forecast - by Indication
- 7.2.1. Gynecology Cancers
- 7.2.2. Menopausal Disorder
- 7.2.3. Polycystic Ovary Syndrome
- 7.2.4. Contraception
- 7.2.5. Other Indications
- 7.3. Market Analysis, Insights and Forecast - by Distribution Channel
- 7.3.1. Hospital Pharmacies
- 7.3.2. Retail Pharmacies
- 7.3.3. Online Pharmacies
- 7.1. Market Analysis, Insights and Forecast - by Therapeutics
- 8. Asia Pacific Gynecology Drug Industry Analysis, Insights and Forecast, 2019-2031
- 8.1. Market Analysis, Insights and Forecast - by Therapeutics
- 8.1.1. Hormonal Therapy
- 8.1.2. Non-hormonal Therapy
- 8.2. Market Analysis, Insights and Forecast - by Indication
- 8.2.1. Gynecology Cancers
- 8.2.2. Menopausal Disorder
- 8.2.3. Polycystic Ovary Syndrome
- 8.2.4. Contraception
- 8.2.5. Other Indications
- 8.3. Market Analysis, Insights and Forecast - by Distribution Channel
- 8.3.1. Hospital Pharmacies
- 8.3.2. Retail Pharmacies
- 8.3.3. Online Pharmacies
- 8.1. Market Analysis, Insights and Forecast - by Therapeutics
- 9. Middle East and Africa Gynecology Drug Industry Analysis, Insights and Forecast, 2019-2031
- 9.1. Market Analysis, Insights and Forecast - by Therapeutics
- 9.1.1. Hormonal Therapy
- 9.1.2. Non-hormonal Therapy
- 9.2. Market Analysis, Insights and Forecast - by Indication
- 9.2.1. Gynecology Cancers
- 9.2.2. Menopausal Disorder
- 9.2.3. Polycystic Ovary Syndrome
- 9.2.4. Contraception
- 9.2.5. Other Indications
- 9.3. Market Analysis, Insights and Forecast - by Distribution Channel
- 9.3.1. Hospital Pharmacies
- 9.3.2. Retail Pharmacies
- 9.3.3. Online Pharmacies
- 9.1. Market Analysis, Insights and Forecast - by Therapeutics
- 10. South America Gynecology Drug Industry Analysis, Insights and Forecast, 2019-2031
- 10.1. Market Analysis, Insights and Forecast - by Therapeutics
- 10.1.1. Hormonal Therapy
- 10.1.2. Non-hormonal Therapy
- 10.2. Market Analysis, Insights and Forecast - by Indication
- 10.2.1. Gynecology Cancers
- 10.2.2. Menopausal Disorder
- 10.2.3. Polycystic Ovary Syndrome
- 10.2.4. Contraception
- 10.2.5. Other Indications
- 10.3. Market Analysis, Insights and Forecast - by Distribution Channel
- 10.3.1. Hospital Pharmacies
- 10.3.2. Retail Pharmacies
- 10.3.3. Online Pharmacies
- 10.1. Market Analysis, Insights and Forecast - by Therapeutics
- 11. North America Gynecology Drug Industry Analysis, Insights and Forecast, 2019-2031
- 11.1. Market Analysis, Insights and Forecast - By Country/Sub-region
- 11.1.1 United States
- 11.1.2 Canada
- 11.1.3 Mexico
- 12. Europe Gynecology Drug Industry Analysis, Insights and Forecast, 2019-2031
- 12.1. Market Analysis, Insights and Forecast - By Country/Sub-region
- 12.1.1 Germany
- 12.1.2 United Kingdom
- 12.1.3 France
- 12.1.4 Italy
- 12.1.5 Spain
- 12.1.6 Rest of Europe
- 13. Asia Pacific Gynecology Drug Industry Analysis, Insights and Forecast, 2019-2031
- 13.1. Market Analysis, Insights and Forecast - By Country/Sub-region
- 13.1.1 China
- 13.1.2 Japan
- 13.1.3 India
- 13.1.4 Australia
- 13.1.5 South Korea
- 13.1.6 Rest of Asia Pacific
- 14. Middle East and Africa Gynecology Drug Industry Analysis, Insights and Forecast, 2019-2031
- 14.1. Market Analysis, Insights and Forecast - By Country/Sub-region
- 14.1.1 GCC
- 14.1.2 South Africa
- 14.1.3 Rest of Middle East and Africa
- 15. South America Gynecology Drug Industry Analysis, Insights and Forecast, 2019-2031
- 15.1. Market Analysis, Insights and Forecast - By Country/Sub-region
- 15.1.1 Brazil
- 15.1.2 Argentina
- 15.1.3 Rest of South America
- 16. Competitive Analysis
- 16.1. Global Market Share Analysis 2024
- 16.2. Company Profiles
- 16.2.1 Lupin Pharmaceuticals Inc
- 16.2.1.1. Overview
- 16.2.1.2. Products
- 16.2.1.3. SWOT Analysis
- 16.2.1.4. Recent Developments
- 16.2.1.5. Financials (Based on Availability)
- 16.2.2 AstraZeneca
- 16.2.2.1. Overview
- 16.2.2.2. Products
- 16.2.2.3. SWOT Analysis
- 16.2.2.4. Recent Developments
- 16.2.2.5. Financials (Based on Availability)
- 16.2.3 Abbott Laboratories Ltd
- 16.2.3.1. Overview
- 16.2.3.2. Products
- 16.2.3.3. SWOT Analysis
- 16.2.3.4. Recent Developments
- 16.2.3.5. Financials (Based on Availability)
- 16.2.4 Bayer AG
- 16.2.4.1. Overview
- 16.2.4.2. Products
- 16.2.4.3. SWOT Analysis
- 16.2.4.4. Recent Developments
- 16.2.4.5. Financials (Based on Availability)
- 16.2.5 Eli Lilly and Company
- 16.2.5.1. Overview
- 16.2.5.2. Products
- 16.2.5.3. SWOT Analysis
- 16.2.5.4. Recent Developments
- 16.2.5.5. Financials (Based on Availability)
- 16.2.6 AbbVie Inc
- 16.2.6.1. Overview
- 16.2.6.2. Products
- 16.2.6.3. SWOT Analysis
- 16.2.6.4. Recent Developments
- 16.2.6.5. Financials (Based on Availability)
- 16.2.7 GSK plc
- 16.2.7.1. Overview
- 16.2.7.2. Products
- 16.2.7.3. SWOT Analysis
- 16.2.7.4. Recent Developments
- 16.2.7.5. Financials (Based on Availability)
- 16.2.8 TherapeuticsMD Inc
- 16.2.8.1. Overview
- 16.2.8.2. Products
- 16.2.8.3. SWOT Analysis
- 16.2.8.4. Recent Developments
- 16.2.8.5. Financials (Based on Availability)
- 16.2.9 Ferring Holding SA
- 16.2.9.1. Overview
- 16.2.9.2. Products
- 16.2.9.3. SWOT Analysis
- 16.2.9.4. Recent Developments
- 16.2.9.5. Financials (Based on Availability)
- 16.2.10 Johnson & Johnson
- 16.2.10.1. Overview
- 16.2.10.2. Products
- 16.2.10.3. SWOT Analysis
- 16.2.10.4. Recent Developments
- 16.2.10.5. Financials (Based on Availability)
- 16.2.11 Pfizer Inc
- 16.2.11.1. Overview
- 16.2.11.2. Products
- 16.2.11.3. SWOT Analysis
- 16.2.11.4. Recent Developments
- 16.2.11.5. Financials (Based on Availability)
- 16.2.1 Lupin Pharmaceuticals Inc
List of Figures
- Figure 1: Global Gynecology Drug Industry Revenue Breakdown (Million, %) by Region 2024 & 2032
- Figure 2: Global Gynecology Drug Industry Volume Breakdown (K Unit, %) by Region 2024 & 2032
- Figure 3: North America Gynecology Drug Industry Revenue (Million), by Country 2024 & 2032
- Figure 4: North America Gynecology Drug Industry Volume (K Unit), by Country 2024 & 2032
- Figure 5: North America Gynecology Drug Industry Revenue Share (%), by Country 2024 & 2032
- Figure 6: North America Gynecology Drug Industry Volume Share (%), by Country 2024 & 2032
- Figure 7: Europe Gynecology Drug Industry Revenue (Million), by Country 2024 & 2032
- Figure 8: Europe Gynecology Drug Industry Volume (K Unit), by Country 2024 & 2032
- Figure 9: Europe Gynecology Drug Industry Revenue Share (%), by Country 2024 & 2032
- Figure 10: Europe Gynecology Drug Industry Volume Share (%), by Country 2024 & 2032
- Figure 11: Asia Pacific Gynecology Drug Industry Revenue (Million), by Country 2024 & 2032
- Figure 12: Asia Pacific Gynecology Drug Industry Volume (K Unit), by Country 2024 & 2032
- Figure 13: Asia Pacific Gynecology Drug Industry Revenue Share (%), by Country 2024 & 2032
- Figure 14: Asia Pacific Gynecology Drug Industry Volume Share (%), by Country 2024 & 2032
- Figure 15: Middle East and Africa Gynecology Drug Industry Revenue (Million), by Country 2024 & 2032
- Figure 16: Middle East and Africa Gynecology Drug Industry Volume (K Unit), by Country 2024 & 2032
- Figure 17: Middle East and Africa Gynecology Drug Industry Revenue Share (%), by Country 2024 & 2032
- Figure 18: Middle East and Africa Gynecology Drug Industry Volume Share (%), by Country 2024 & 2032
- Figure 19: South America Gynecology Drug Industry Revenue (Million), by Country 2024 & 2032
- Figure 20: South America Gynecology Drug Industry Volume (K Unit), by Country 2024 & 2032
- Figure 21: South America Gynecology Drug Industry Revenue Share (%), by Country 2024 & 2032
- Figure 22: South America Gynecology Drug Industry Volume Share (%), by Country 2024 & 2032
- Figure 23: North America Gynecology Drug Industry Revenue (Million), by Therapeutics 2024 & 2032
- Figure 24: North America Gynecology Drug Industry Volume (K Unit), by Therapeutics 2024 & 2032
- Figure 25: North America Gynecology Drug Industry Revenue Share (%), by Therapeutics 2024 & 2032
- Figure 26: North America Gynecology Drug Industry Volume Share (%), by Therapeutics 2024 & 2032
- Figure 27: North America Gynecology Drug Industry Revenue (Million), by Indication 2024 & 2032
- Figure 28: North America Gynecology Drug Industry Volume (K Unit), by Indication 2024 & 2032
- Figure 29: North America Gynecology Drug Industry Revenue Share (%), by Indication 2024 & 2032
- Figure 30: North America Gynecology Drug Industry Volume Share (%), by Indication 2024 & 2032
- Figure 31: North America Gynecology Drug Industry Revenue (Million), by Distribution Channel 2024 & 2032
- Figure 32: North America Gynecology Drug Industry Volume (K Unit), by Distribution Channel 2024 & 2032
- Figure 33: North America Gynecology Drug Industry Revenue Share (%), by Distribution Channel 2024 & 2032
- Figure 34: North America Gynecology Drug Industry Volume Share (%), by Distribution Channel 2024 & 2032
- Figure 35: North America Gynecology Drug Industry Revenue (Million), by Country 2024 & 2032
- Figure 36: North America Gynecology Drug Industry Volume (K Unit), by Country 2024 & 2032
- Figure 37: North America Gynecology Drug Industry Revenue Share (%), by Country 2024 & 2032
- Figure 38: North America Gynecology Drug Industry Volume Share (%), by Country 2024 & 2032
- Figure 39: Europe Gynecology Drug Industry Revenue (Million), by Therapeutics 2024 & 2032
- Figure 40: Europe Gynecology Drug Industry Volume (K Unit), by Therapeutics 2024 & 2032
- Figure 41: Europe Gynecology Drug Industry Revenue Share (%), by Therapeutics 2024 & 2032
- Figure 42: Europe Gynecology Drug Industry Volume Share (%), by Therapeutics 2024 & 2032
- Figure 43: Europe Gynecology Drug Industry Revenue (Million), by Indication 2024 & 2032
- Figure 44: Europe Gynecology Drug Industry Volume (K Unit), by Indication 2024 & 2032
- Figure 45: Europe Gynecology Drug Industry Revenue Share (%), by Indication 2024 & 2032
- Figure 46: Europe Gynecology Drug Industry Volume Share (%), by Indication 2024 & 2032
- Figure 47: Europe Gynecology Drug Industry Revenue (Million), by Distribution Channel 2024 & 2032
- Figure 48: Europe Gynecology Drug Industry Volume (K Unit), by Distribution Channel 2024 & 2032
- Figure 49: Europe Gynecology Drug Industry Revenue Share (%), by Distribution Channel 2024 & 2032
- Figure 50: Europe Gynecology Drug Industry Volume Share (%), by Distribution Channel 2024 & 2032
- Figure 51: Europe Gynecology Drug Industry Revenue (Million), by Country 2024 & 2032
- Figure 52: Europe Gynecology Drug Industry Volume (K Unit), by Country 2024 & 2032
- Figure 53: Europe Gynecology Drug Industry Revenue Share (%), by Country 2024 & 2032
- Figure 54: Europe Gynecology Drug Industry Volume Share (%), by Country 2024 & 2032
- Figure 55: Asia Pacific Gynecology Drug Industry Revenue (Million), by Therapeutics 2024 & 2032
- Figure 56: Asia Pacific Gynecology Drug Industry Volume (K Unit), by Therapeutics 2024 & 2032
- Figure 57: Asia Pacific Gynecology Drug Industry Revenue Share (%), by Therapeutics 2024 & 2032
- Figure 58: Asia Pacific Gynecology Drug Industry Volume Share (%), by Therapeutics 2024 & 2032
- Figure 59: Asia Pacific Gynecology Drug Industry Revenue (Million), by Indication 2024 & 2032
- Figure 60: Asia Pacific Gynecology Drug Industry Volume (K Unit), by Indication 2024 & 2032
- Figure 61: Asia Pacific Gynecology Drug Industry Revenue Share (%), by Indication 2024 & 2032
- Figure 62: Asia Pacific Gynecology Drug Industry Volume Share (%), by Indication 2024 & 2032
- Figure 63: Asia Pacific Gynecology Drug Industry Revenue (Million), by Distribution Channel 2024 & 2032
- Figure 64: Asia Pacific Gynecology Drug Industry Volume (K Unit), by Distribution Channel 2024 & 2032
- Figure 65: Asia Pacific Gynecology Drug Industry Revenue Share (%), by Distribution Channel 2024 & 2032
- Figure 66: Asia Pacific Gynecology Drug Industry Volume Share (%), by Distribution Channel 2024 & 2032
- Figure 67: Asia Pacific Gynecology Drug Industry Revenue (Million), by Country 2024 & 2032
- Figure 68: Asia Pacific Gynecology Drug Industry Volume (K Unit), by Country 2024 & 2032
- Figure 69: Asia Pacific Gynecology Drug Industry Revenue Share (%), by Country 2024 & 2032
- Figure 70: Asia Pacific Gynecology Drug Industry Volume Share (%), by Country 2024 & 2032
- Figure 71: Middle East and Africa Gynecology Drug Industry Revenue (Million), by Therapeutics 2024 & 2032
- Figure 72: Middle East and Africa Gynecology Drug Industry Volume (K Unit), by Therapeutics 2024 & 2032
- Figure 73: Middle East and Africa Gynecology Drug Industry Revenue Share (%), by Therapeutics 2024 & 2032
- Figure 74: Middle East and Africa Gynecology Drug Industry Volume Share (%), by Therapeutics 2024 & 2032
- Figure 75: Middle East and Africa Gynecology Drug Industry Revenue (Million), by Indication 2024 & 2032
- Figure 76: Middle East and Africa Gynecology Drug Industry Volume (K Unit), by Indication 2024 & 2032
- Figure 77: Middle East and Africa Gynecology Drug Industry Revenue Share (%), by Indication 2024 & 2032
- Figure 78: Middle East and Africa Gynecology Drug Industry Volume Share (%), by Indication 2024 & 2032
- Figure 79: Middle East and Africa Gynecology Drug Industry Revenue (Million), by Distribution Channel 2024 & 2032
- Figure 80: Middle East and Africa Gynecology Drug Industry Volume (K Unit), by Distribution Channel 2024 & 2032
- Figure 81: Middle East and Africa Gynecology Drug Industry Revenue Share (%), by Distribution Channel 2024 & 2032
- Figure 82: Middle East and Africa Gynecology Drug Industry Volume Share (%), by Distribution Channel 2024 & 2032
- Figure 83: Middle East and Africa Gynecology Drug Industry Revenue (Million), by Country 2024 & 2032
- Figure 84: Middle East and Africa Gynecology Drug Industry Volume (K Unit), by Country 2024 & 2032
- Figure 85: Middle East and Africa Gynecology Drug Industry Revenue Share (%), by Country 2024 & 2032
- Figure 86: Middle East and Africa Gynecology Drug Industry Volume Share (%), by Country 2024 & 2032
- Figure 87: South America Gynecology Drug Industry Revenue (Million), by Therapeutics 2024 & 2032
- Figure 88: South America Gynecology Drug Industry Volume (K Unit), by Therapeutics 2024 & 2032
- Figure 89: South America Gynecology Drug Industry Revenue Share (%), by Therapeutics 2024 & 2032
- Figure 90: South America Gynecology Drug Industry Volume Share (%), by Therapeutics 2024 & 2032
- Figure 91: South America Gynecology Drug Industry Revenue (Million), by Indication 2024 & 2032
- Figure 92: South America Gynecology Drug Industry Volume (K Unit), by Indication 2024 & 2032
- Figure 93: South America Gynecology Drug Industry Revenue Share (%), by Indication 2024 & 2032
- Figure 94: South America Gynecology Drug Industry Volume Share (%), by Indication 2024 & 2032
- Figure 95: South America Gynecology Drug Industry Revenue (Million), by Distribution Channel 2024 & 2032
- Figure 96: South America Gynecology Drug Industry Volume (K Unit), by Distribution Channel 2024 & 2032
- Figure 97: South America Gynecology Drug Industry Revenue Share (%), by Distribution Channel 2024 & 2032
- Figure 98: South America Gynecology Drug Industry Volume Share (%), by Distribution Channel 2024 & 2032
- Figure 99: South America Gynecology Drug Industry Revenue (Million), by Country 2024 & 2032
- Figure 100: South America Gynecology Drug Industry Volume (K Unit), by Country 2024 & 2032
- Figure 101: South America Gynecology Drug Industry Revenue Share (%), by Country 2024 & 2032
- Figure 102: South America Gynecology Drug Industry Volume Share (%), by Country 2024 & 2032
List of Tables
- Table 1: Global Gynecology Drug Industry Revenue Million Forecast, by Region 2019 & 2032
- Table 2: Global Gynecology Drug Industry Volume K Unit Forecast, by Region 2019 & 2032
- Table 3: Global Gynecology Drug Industry Revenue Million Forecast, by Therapeutics 2019 & 2032
- Table 4: Global Gynecology Drug Industry Volume K Unit Forecast, by Therapeutics 2019 & 2032
- Table 5: Global Gynecology Drug Industry Revenue Million Forecast, by Indication 2019 & 2032
- Table 6: Global Gynecology Drug Industry Volume K Unit Forecast, by Indication 2019 & 2032
- Table 7: Global Gynecology Drug Industry Revenue Million Forecast, by Distribution Channel 2019 & 2032
- Table 8: Global Gynecology Drug Industry Volume K Unit Forecast, by Distribution Channel 2019 & 2032
- Table 9: Global Gynecology Drug Industry Revenue Million Forecast, by Region 2019 & 2032
- Table 10: Global Gynecology Drug Industry Volume K Unit Forecast, by Region 2019 & 2032
- Table 11: Global Gynecology Drug Industry Revenue Million Forecast, by Country 2019 & 2032
- Table 12: Global Gynecology Drug Industry Volume K Unit Forecast, by Country 2019 & 2032
- Table 13: United States Gynecology Drug Industry Revenue (Million) Forecast, by Application 2019 & 2032
- Table 14: United States Gynecology Drug Industry Volume (K Unit) Forecast, by Application 2019 & 2032
- Table 15: Canada Gynecology Drug Industry Revenue (Million) Forecast, by Application 2019 & 2032
- Table 16: Canada Gynecology Drug Industry Volume (K Unit) Forecast, by Application 2019 & 2032
- Table 17: Mexico Gynecology Drug Industry Revenue (Million) Forecast, by Application 2019 & 2032
- Table 18: Mexico Gynecology Drug Industry Volume (K Unit) Forecast, by Application 2019 & 2032
- Table 19: Global Gynecology Drug Industry Revenue Million Forecast, by Country 2019 & 2032
- Table 20: Global Gynecology Drug Industry Volume K Unit Forecast, by Country 2019 & 2032
- Table 21: Germany Gynecology Drug Industry Revenue (Million) Forecast, by Application 2019 & 2032
- Table 22: Germany Gynecology Drug Industry Volume (K Unit) Forecast, by Application 2019 & 2032
- Table 23: United Kingdom Gynecology Drug Industry Revenue (Million) Forecast, by Application 2019 & 2032
- Table 24: United Kingdom Gynecology Drug Industry Volume (K Unit) Forecast, by Application 2019 & 2032
- Table 25: France Gynecology Drug Industry Revenue (Million) Forecast, by Application 2019 & 2032
- Table 26: France Gynecology Drug Industry Volume (K Unit) Forecast, by Application 2019 & 2032
- Table 27: Italy Gynecology Drug Industry Revenue (Million) Forecast, by Application 2019 & 2032
- Table 28: Italy Gynecology Drug Industry Volume (K Unit) Forecast, by Application 2019 & 2032
- Table 29: Spain Gynecology Drug Industry Revenue (Million) Forecast, by Application 2019 & 2032
- Table 30: Spain Gynecology Drug Industry Volume (K Unit) Forecast, by Application 2019 & 2032
- Table 31: Rest of Europe Gynecology Drug Industry Revenue (Million) Forecast, by Application 2019 & 2032
- Table 32: Rest of Europe Gynecology Drug Industry Volume (K Unit) Forecast, by Application 2019 & 2032
- Table 33: Global Gynecology Drug Industry Revenue Million Forecast, by Country 2019 & 2032
- Table 34: Global Gynecology Drug Industry Volume K Unit Forecast, by Country 2019 & 2032
- Table 35: China Gynecology Drug Industry Revenue (Million) Forecast, by Application 2019 & 2032
- Table 36: China Gynecology Drug Industry Volume (K Unit) Forecast, by Application 2019 & 2032
- Table 37: Japan Gynecology Drug Industry Revenue (Million) Forecast, by Application 2019 & 2032
- Table 38: Japan Gynecology Drug Industry Volume (K Unit) Forecast, by Application 2019 & 2032
- Table 39: India Gynecology Drug Industry Revenue (Million) Forecast, by Application 2019 & 2032
- Table 40: India Gynecology Drug Industry Volume (K Unit) Forecast, by Application 2019 & 2032
- Table 41: Australia Gynecology Drug Industry Revenue (Million) Forecast, by Application 2019 & 2032
- Table 42: Australia Gynecology Drug Industry Volume (K Unit) Forecast, by Application 2019 & 2032
- Table 43: South Korea Gynecology Drug Industry Revenue (Million) Forecast, by Application 2019 & 2032
- Table 44: South Korea Gynecology Drug Industry Volume (K Unit) Forecast, by Application 2019 & 2032
- Table 45: Rest of Asia Pacific Gynecology Drug Industry Revenue (Million) Forecast, by Application 2019 & 2032
- Table 46: Rest of Asia Pacific Gynecology Drug Industry Volume (K Unit) Forecast, by Application 2019 & 2032
- Table 47: Global Gynecology Drug Industry Revenue Million Forecast, by Country 2019 & 2032
- Table 48: Global Gynecology Drug Industry Volume K Unit Forecast, by Country 2019 & 2032
- Table 49: GCC Gynecology Drug Industry Revenue (Million) Forecast, by Application 2019 & 2032
- Table 50: GCC Gynecology Drug Industry Volume (K Unit) Forecast, by Application 2019 & 2032
- Table 51: South Africa Gynecology Drug Industry Revenue (Million) Forecast, by Application 2019 & 2032
- Table 52: South Africa Gynecology Drug Industry Volume (K Unit) Forecast, by Application 2019 & 2032
- Table 53: Rest of Middle East and Africa Gynecology Drug Industry Revenue (Million) Forecast, by Application 2019 & 2032
- Table 54: Rest of Middle East and Africa Gynecology Drug Industry Volume (K Unit) Forecast, by Application 2019 & 2032
- Table 55: Global Gynecology Drug Industry Revenue Million Forecast, by Country 2019 & 2032
- Table 56: Global Gynecology Drug Industry Volume K Unit Forecast, by Country 2019 & 2032
- Table 57: Brazil Gynecology Drug Industry Revenue (Million) Forecast, by Application 2019 & 2032
- Table 58: Brazil Gynecology Drug Industry Volume (K Unit) Forecast, by Application 2019 & 2032
- Table 59: Argentina Gynecology Drug Industry Revenue (Million) Forecast, by Application 2019 & 2032
- Table 60: Argentina Gynecology Drug Industry Volume (K Unit) Forecast, by Application 2019 & 2032
- Table 61: Rest of South America Gynecology Drug Industry Revenue (Million) Forecast, by Application 2019 & 2032
- Table 62: Rest of South America Gynecology Drug Industry Volume (K Unit) Forecast, by Application 2019 & 2032
- Table 63: Global Gynecology Drug Industry Revenue Million Forecast, by Therapeutics 2019 & 2032
- Table 64: Global Gynecology Drug Industry Volume K Unit Forecast, by Therapeutics 2019 & 2032
- Table 65: Global Gynecology Drug Industry Revenue Million Forecast, by Indication 2019 & 2032
- Table 66: Global Gynecology Drug Industry Volume K Unit Forecast, by Indication 2019 & 2032
- Table 67: Global Gynecology Drug Industry Revenue Million Forecast, by Distribution Channel 2019 & 2032
- Table 68: Global Gynecology Drug Industry Volume K Unit Forecast, by Distribution Channel 2019 & 2032
- Table 69: Global Gynecology Drug Industry Revenue Million Forecast, by Country 2019 & 2032
- Table 70: Global Gynecology Drug Industry Volume K Unit Forecast, by Country 2019 & 2032
- Table 71: United States Gynecology Drug Industry Revenue (Million) Forecast, by Application 2019 & 2032
- Table 72: United States Gynecology Drug Industry Volume (K Unit) Forecast, by Application 2019 & 2032
- Table 73: Canada Gynecology Drug Industry Revenue (Million) Forecast, by Application 2019 & 2032
- Table 74: Canada Gynecology Drug Industry Volume (K Unit) Forecast, by Application 2019 & 2032
- Table 75: Mexico Gynecology Drug Industry Revenue (Million) Forecast, by Application 2019 & 2032
- Table 76: Mexico Gynecology Drug Industry Volume (K Unit) Forecast, by Application 2019 & 2032
- Table 77: Global Gynecology Drug Industry Revenue Million Forecast, by Therapeutics 2019 & 2032
- Table 78: Global Gynecology Drug Industry Volume K Unit Forecast, by Therapeutics 2019 & 2032
- Table 79: Global Gynecology Drug Industry Revenue Million Forecast, by Indication 2019 & 2032
- Table 80: Global Gynecology Drug Industry Volume K Unit Forecast, by Indication 2019 & 2032
- Table 81: Global Gynecology Drug Industry Revenue Million Forecast, by Distribution Channel 2019 & 2032
- Table 82: Global Gynecology Drug Industry Volume K Unit Forecast, by Distribution Channel 2019 & 2032
- Table 83: Global Gynecology Drug Industry Revenue Million Forecast, by Country 2019 & 2032
- Table 84: Global Gynecology Drug Industry Volume K Unit Forecast, by Country 2019 & 2032
- Table 85: Germany Gynecology Drug Industry Revenue (Million) Forecast, by Application 2019 & 2032
- Table 86: Germany Gynecology Drug Industry Volume (K Unit) Forecast, by Application 2019 & 2032
- Table 87: United Kingdom Gynecology Drug Industry Revenue (Million) Forecast, by Application 2019 & 2032
- Table 88: United Kingdom Gynecology Drug Industry Volume (K Unit) Forecast, by Application 2019 & 2032
- Table 89: France Gynecology Drug Industry Revenue (Million) Forecast, by Application 2019 & 2032
- Table 90: France Gynecology Drug Industry Volume (K Unit) Forecast, by Application 2019 & 2032
- Table 91: Italy Gynecology Drug Industry Revenue (Million) Forecast, by Application 2019 & 2032
- Table 92: Italy Gynecology Drug Industry Volume (K Unit) Forecast, by Application 2019 & 2032
- Table 93: Spain Gynecology Drug Industry Revenue (Million) Forecast, by Application 2019 & 2032
- Table 94: Spain Gynecology Drug Industry Volume (K Unit) Forecast, by Application 2019 & 2032
- Table 95: Rest of Europe Gynecology Drug Industry Revenue (Million) Forecast, by Application 2019 & 2032
- Table 96: Rest of Europe Gynecology Drug Industry Volume (K Unit) Forecast, by Application 2019 & 2032
- Table 97: Global Gynecology Drug Industry Revenue Million Forecast, by Therapeutics 2019 & 2032
- Table 98: Global Gynecology Drug Industry Volume K Unit Forecast, by Therapeutics 2019 & 2032
- Table 99: Global Gynecology Drug Industry Revenue Million Forecast, by Indication 2019 & 2032
- Table 100: Global Gynecology Drug Industry Volume K Unit Forecast, by Indication 2019 & 2032
- Table 101: Global Gynecology Drug Industry Revenue Million Forecast, by Distribution Channel 2019 & 2032
- Table 102: Global Gynecology Drug Industry Volume K Unit Forecast, by Distribution Channel 2019 & 2032
- Table 103: Global Gynecology Drug Industry Revenue Million Forecast, by Country 2019 & 2032
- Table 104: Global Gynecology Drug Industry Volume K Unit Forecast, by Country 2019 & 2032
- Table 105: China Gynecology Drug Industry Revenue (Million) Forecast, by Application 2019 & 2032
- Table 106: China Gynecology Drug Industry Volume (K Unit) Forecast, by Application 2019 & 2032
- Table 107: Japan Gynecology Drug Industry Revenue (Million) Forecast, by Application 2019 & 2032
- Table 108: Japan Gynecology Drug Industry Volume (K Unit) Forecast, by Application 2019 & 2032
- Table 109: India Gynecology Drug Industry Revenue (Million) Forecast, by Application 2019 & 2032
- Table 110: India Gynecology Drug Industry Volume (K Unit) Forecast, by Application 2019 & 2032
- Table 111: Australia Gynecology Drug Industry Revenue (Million) Forecast, by Application 2019 & 2032
- Table 112: Australia Gynecology Drug Industry Volume (K Unit) Forecast, by Application 2019 & 2032
- Table 113: South Korea Gynecology Drug Industry Revenue (Million) Forecast, by Application 2019 & 2032
- Table 114: South Korea Gynecology Drug Industry Volume (K Unit) Forecast, by Application 2019 & 2032
- Table 115: Rest of Asia Pacific Gynecology Drug Industry Revenue (Million) Forecast, by Application 2019 & 2032
- Table 116: Rest of Asia Pacific Gynecology Drug Industry Volume (K Unit) Forecast, by Application 2019 & 2032
- Table 117: Global Gynecology Drug Industry Revenue Million Forecast, by Therapeutics 2019 & 2032
- Table 118: Global Gynecology Drug Industry Volume K Unit Forecast, by Therapeutics 2019 & 2032
- Table 119: Global Gynecology Drug Industry Revenue Million Forecast, by Indication 2019 & 2032
- Table 120: Global Gynecology Drug Industry Volume K Unit Forecast, by Indication 2019 & 2032
- Table 121: Global Gynecology Drug Industry Revenue Million Forecast, by Distribution Channel 2019 & 2032
- Table 122: Global Gynecology Drug Industry Volume K Unit Forecast, by Distribution Channel 2019 & 2032
- Table 123: Global Gynecology Drug Industry Revenue Million Forecast, by Country 2019 & 2032
- Table 124: Global Gynecology Drug Industry Volume K Unit Forecast, by Country 2019 & 2032
- Table 125: GCC Gynecology Drug Industry Revenue (Million) Forecast, by Application 2019 & 2032
- Table 126: GCC Gynecology Drug Industry Volume (K Unit) Forecast, by Application 2019 & 2032
- Table 127: South Africa Gynecology Drug Industry Revenue (Million) Forecast, by Application 2019 & 2032
- Table 128: South Africa Gynecology Drug Industry Volume (K Unit) Forecast, by Application 2019 & 2032
- Table 129: Rest of Middle East and Africa Gynecology Drug Industry Revenue (Million) Forecast, by Application 2019 & 2032
- Table 130: Rest of Middle East and Africa Gynecology Drug Industry Volume (K Unit) Forecast, by Application 2019 & 2032
- Table 131: Global Gynecology Drug Industry Revenue Million Forecast, by Therapeutics 2019 & 2032
- Table 132: Global Gynecology Drug Industry Volume K Unit Forecast, by Therapeutics 2019 & 2032
- Table 133: Global Gynecology Drug Industry Revenue Million Forecast, by Indication 2019 & 2032
- Table 134: Global Gynecology Drug Industry Volume K Unit Forecast, by Indication 2019 & 2032
- Table 135: Global Gynecology Drug Industry Revenue Million Forecast, by Distribution Channel 2019 & 2032
- Table 136: Global Gynecology Drug Industry Volume K Unit Forecast, by Distribution Channel 2019 & 2032
- Table 137: Global Gynecology Drug Industry Revenue Million Forecast, by Country 2019 & 2032
- Table 138: Global Gynecology Drug Industry Volume K Unit Forecast, by Country 2019 & 2032
- Table 139: Brazil Gynecology Drug Industry Revenue (Million) Forecast, by Application 2019 & 2032
- Table 140: Brazil Gynecology Drug Industry Volume (K Unit) Forecast, by Application 2019 & 2032
- Table 141: Argentina Gynecology Drug Industry Revenue (Million) Forecast, by Application 2019 & 2032
- Table 142: Argentina Gynecology Drug Industry Volume (K Unit) Forecast, by Application 2019 & 2032
- Table 143: Rest of South America Gynecology Drug Industry Revenue (Million) Forecast, by Application 2019 & 2032
- Table 144: Rest of South America Gynecology Drug Industry Volume (K Unit) Forecast, by Application 2019 & 2032
Frequently Asked Questions
1. What is the projected Compound Annual Growth Rate (CAGR) of the Gynecology Drug Industry?
The projected CAGR is approximately 6.20%.
2. Which companies are prominent players in the Gynecology Drug Industry?
Key companies in the market include Lupin Pharmaceuticals Inc, AstraZeneca, Abbott Laboratories Ltd, Bayer AG, Eli Lilly and Company, AbbVie Inc, GSK plc, TherapeuticsMD Inc, Ferring Holding SA, Johnson & Johnson, Pfizer Inc.
3. What are the main segments of the Gynecology Drug Industry?
The market segments include Therapeutics, Indication, Distribution Channel.
4. Can you provide details about the market size?
The market size is estimated to be USD XX Million as of 2022.
5. What are some drivers contributing to market growth?
Increasing Burden of Gynecological Diseases; Rise in Healthcare Awareness Along with Increasing Ageing Female Population.
6. What are the notable trends driving market growth?
Non-hormonal Therapy Segment is Expected to Witness High Growth Over the Forecast Period.
7. Are there any restraints impacting market growth?
High Cost and Stringent Regulatory Framework that Delays the Approval of the Drugs.
8. Can you provide examples of recent developments in the market?
February 2023: GSK plc announced that the United States Food Drug Administration (FDA) granted full approval for Jemperli for the treatment of adult patients with mismatch repair-deficient (dMMR) recurrent or advanced endometrial cancer.
9. What pricing options are available for accessing the report?
Pricing options include single-user, multi-user, and enterprise licenses priced at USD 4750, USD 5250, and USD 8750 respectively.
10. Is the market size provided in terms of value or volume?
The market size is provided in terms of value, measured in Million and volume, measured in K Unit.
11. Are there any specific market keywords associated with the report?
Yes, the market keyword associated with the report is "Gynecology Drug Industry," which aids in identifying and referencing the specific market segment covered.
12. How do I determine which pricing option suits my needs best?
The pricing options vary based on user requirements and access needs. Individual users may opt for single-user licenses, while businesses requiring broader access may choose multi-user or enterprise licenses for cost-effective access to the report.
13. Are there any additional resources or data provided in the Gynecology Drug Industry report?
While the report offers comprehensive insights, it's advisable to review the specific contents or supplementary materials provided to ascertain if additional resources or data are available.
14. How can I stay updated on further developments or reports in the Gynecology Drug Industry?
To stay informed about further developments, trends, and reports in the Gynecology Drug Industry, consider subscribing to industry newsletters, following relevant companies and organizations, or regularly checking reputable industry news sources and publications.
Methodology
Step 1 - Identification of Relevant Samples Size from Population Database


Step 2 - Approaches for Defining Global Market Size (Value, Volume* & Price*)

Note*: In applicable scenarios
Step 3 - Data Sources
Primary Research
- Web Analytics
- Survey Reports
- Research Institute
- Latest Research Reports
- Opinion Leaders
Secondary Research
- Annual Reports
- White Paper
- Latest Press Release
- Industry Association
- Paid Database
- Investor Presentations

Step 4 - Data Triangulation
Involves using different sources of information in order to increase the validity of a study
These sources are likely to be stakeholders in a program - participants, other researchers, program staff, other community members, and so on.
Then we put all data in single framework & apply various statistical tools to find out the dynamic on the market.
During the analysis stage, feedback from the stakeholder groups would be compared to determine areas of agreement as well as areas of divergence


