
Key Insights
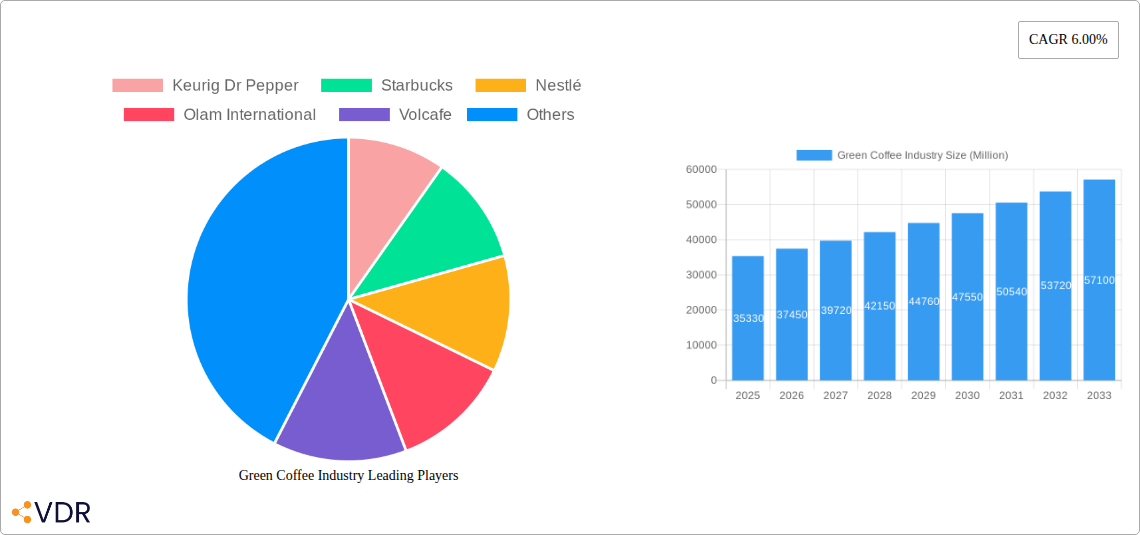
The global green coffee market, valued at $35.33 billion in 2025, is projected to experience robust growth, driven by increasing consumer demand for coffee and the rising popularity of specialty coffee. A compound annual growth rate (CAGR) of 6.00% from 2025 to 2033 indicates a significant market expansion. Key drivers include shifting consumer preferences towards premium coffee varieties like Arabica, the growing adoption of single-serve coffee brewing systems, and the increasing availability of convenient coffee options in both retail and foodservice channels. Furthermore, the market is segmented by product type (Arabica, Robusta, Others), application (Beverage, Food, Others), and end-user (Household, Commercial, Others), allowing for targeted market penetration strategies by major players such as Keurig Dr Pepper, Starbucks, Nestlé, and Olam International. Regional variations exist, with North America and Europe currently dominating the market, but the Asia-Pacific region shows significant growth potential due to its burgeoning middle class and increasing coffee consumption. While potential restraints include price volatility in coffee bean prices due to climate change and global supply chain disruptions, the overall market outlook remains positive.
The market's strong growth trajectory is further supported by evolving consumer trends. Health-conscious consumers are driving demand for organic and sustainably sourced green coffee, presenting opportunities for companies that prioritize ethical sourcing and environmental sustainability. The rising interest in coffee's health benefits, such as its antioxidant properties, also contributes to market expansion. Innovations in coffee processing and brewing technologies continue to enhance consumer experience, further stimulating market growth. Competition amongst established players and new entrants is expected to intensify, leading to product diversification, expansion into new markets, and strategic partnerships. The forecast period of 2025-2033 promises substantial opportunities for industry stakeholders who can adapt to changing consumer preferences and navigate the market dynamics effectively.
This comprehensive report provides a detailed analysis of the green coffee industry, encompassing market dynamics, growth trends, regional insights, and key player strategies. With a study period spanning 2019-2033, a base year of 2025, and a forecast period of 2025-2033, this report is an essential resource for industry professionals, investors, and stakeholders seeking to understand and capitalize on the opportunities within this dynamic market. The report examines both parent and child markets for a more complete understanding, with detailed segmentation by product type (Arabica, Robusta, Others), application (Beverage, Food, Others), and end-user (Household, Commercial, Others).
Green Coffee Industry Market Dynamics & Structure
The global green coffee market is characterized by a moderately concentrated structure, with several multinational players dominating production and distribution. Market concentration is further influenced by factors such as mergers and acquisitions (M&A) activity. In the historical period (2019-2024), M&A deal volume averaged xx million deals annually, with xx million deals predicted for 2025. Technological innovations, particularly in sustainable farming practices and processing techniques, are key drivers of market growth. However, factors like climate change, fluctuating commodity prices, and stringent regulatory frameworks pose challenges.
- Market Concentration: Top 5 players hold approximately xx% market share (2024 estimate).
- Technological Innovation: Focus on precision agriculture, automation in processing, and sustainable sourcing.
- Regulatory Landscape: Increasing emphasis on fair trade practices and environmental sustainability influences market dynamics.
- Substitute Products: Tea, other beverages, and decaffeinated coffee represent key competitive substitutes.
- End-User Demographics: Growing demand from health-conscious consumers and the expansion of the coffee shop sector influence growth.
- M&A Trends: Consolidation amongst major players is anticipated to continue, driving further market concentration in the forecast period.
Green Coffee Industry Growth Trends & Insights
The green coffee market experienced robust growth in the historical period (2019-2024), with a compound annual growth rate (CAGR) of xx%. This growth is driven by increasing global coffee consumption, particularly in emerging economies. Technological advancements in farming and processing have increased yields and improved quality, leading to increased adoption rates. Consumer preferences are shifting towards specialty and ethically sourced coffee, creating new market niches. Market penetration of specialty coffee increased by xx% between 2019 and 2024, further highlighting this trend. Disruptions caused by climate change and geopolitical instability have impacted prices and supply chains. The forecast period (2025-2033) is expected to witness continued growth, albeit at a slightly moderated CAGR of xx%, influenced by factors such as increasing consumer preference for sustainable and ethically produced coffee. Market size is expected to reach xx million units by 2033.

Dominant Regions, Countries, or Segments in Green Coffee Industry
The global green coffee market is geographically diverse, with specific regions and countries exhibiting significantly higher growth potential compared to others. The beverage segment remains the dominant application, accounting for approximately xx% of the market in 2024. Amongst product types, Arabica coffee commands the largest market share at approximately xx%, driven by superior taste and higher prices.
- Leading Regions: Asia-Pacific and Latin America show significant growth potential due to rising coffee consumption and expanding coffee shop cultures.
- Leading Countries: Brazil, Vietnam, Colombia, and Indonesia are key coffee-producing nations.
- Dominant Segments: Arabica coffee in the beverage application caters predominantly to the household end-user segment.
- Key Growth Drivers: Increasing disposable incomes, evolving consumer preferences, supportive government policies, and growing tourism contribute to regional variations in growth rates.
Green Coffee Industry Product Landscape
The green coffee industry is characterized by a diverse range of product offerings, reflecting variations in bean type, origin, processing method, and roast profile. Innovation focuses on improving sustainability, enhancing taste profiles, and creating value-added products. Specialty coffee varieties, single-origin beans, and organic certifications are gaining popularity. Technological advancements in processing techniques, including improved drying and milling processes, contribute to consistent quality and reduced environmental impact.
Key Drivers, Barriers & Challenges in Green Coffee Industry
Key Drivers:
- Rising Global Coffee Consumption: Growth in emerging markets drives demand.
- Increasing Disposable Incomes: Consumer spending on premium coffee increases.
- Technological Advancements: Improvements in farming, processing, and roasting enhance quality and efficiency.
- Growing Preference for Specialty Coffee: Premium segments fuel market expansion.
Key Challenges:
- Climate Change: Adverse weather patterns threaten coffee production.
- Fluctuating Commodity Prices: Price volatility creates market uncertainty.
- Supply Chain Disruptions: Geopolitical instability and logistical challenges affect availability.
- Sustainability Concerns: Environmental and social issues require ongoing attention. This impacts approximately xx% of production annually (2024 estimate).
Emerging Opportunities in Green Coffee Industry
- Growth of the Specialty Coffee Market: Premium and niche offerings continue to expand.
- Sustainable and Ethical Sourcing: Consumer demand drives focus on fair trade and environmentally friendly practices.
- Innovation in Coffee Products: Ready-to-drink (RTD) coffee and functional coffee options are gaining popularity.
- Expansion into Emerging Markets: Untapped potential in developing economies offers significant growth opportunities.
Growth Accelerators in the Green Coffee Industry Industry
Technological advancements, strategic partnerships between coffee producers, roasters, and retailers, and effective marketing campaigns focusing on the health benefits and cultural relevance of coffee are crucial growth accelerators. Market expansion into new regions and the development of value-added products, such as instant coffee and coffee extracts, further contribute to market growth.
Key Players Shaping the Green Coffee Industry Market
- Keurig Dr Pepper
- Starbucks
- Nestlé
- Olam International
- Volcafe
- Jacobs Douwe Egberts
- Lavazza illycaffè
- J.M. Smucker
- Kraft Heinz
Notable Milestones in Green Coffee Industry Sector
- July 2021: The Rainforest Alliance launched a new sustainability certification program for coffee.
- July 2022: The Ethiopian Coffee and Tea Authority (ECTA) released a new strategy to increase coffee production threefold in 10 years.
- July 2022: The Indian Government proposed a new 'Coffee Promotion and Development Bill, 2022' to modernize the coffee industry.
In-Depth Green Coffee Industry Market Outlook
The green coffee industry is poised for sustained growth driven by several key factors, including expanding global consumption, increasing demand for specialty and sustainable coffees, and technological advancements in production and processing. Strategic partnerships and innovative product development will further shape the market's future. The market presents significant opportunities for established players and new entrants alike, particularly in emerging markets and within the growing premium and sustainable segments. The continued focus on sustainability and ethical sourcing will be paramount to long-term market success.
Green Coffee Industry Segmentation
- 1. Production Analysis
- 2. Consumption Analysis
- 3. Import Market Analysis (Value & Volume)
- 4. Export Market Analysis (Value & Volume)
- 5. Price Trend Analysis
Green Coffee Industry Segmentation By Geography
-
1. North America
- 1.1. United States
- 1.2. Canada
- 1.3. Mexico
-
2. Europe
- 2.1. Germany
- 2.2. United Kingdom
- 2.3. Spain
- 2.4. France
- 2.5. Italy
- 2.6. Belgium
- 2.7. Russia
-
3. Asia Pacific
- 3.1. China
- 3.2. Vietnam
- 3.3. Indonesia
- 3.4. India
- 3.5. Japan
-
4. South America
- 4.1. Brazil
- 4.2. Colombia
-
5. Middle East and Africa
- 5.1. Uganda
- 5.2. Ethiopia

Green Coffee Industry REPORT HIGHLIGHTS
| Aspects | Details |
|---|---|
| Study Period | 2019-2033 |
| Base Year | 2024 |
| Estimated Year | 2025 |
| Forecast Period | 2025-2033 |
| Historical Period | 2019-2024 |
| Growth Rate | CAGR of 6.00% from 2019-2033 |
| Segmentation |
|
Table of Contents
- 1. Introduction
- 1.1. Research Scope
- 1.2. Market Segmentation
- 1.3. Research Methodology
- 1.4. Definitions and Assumptions
- 2. Executive Summary
- 2.1. Introduction
- 3. Market Dynamics
- 3.1. Introduction
- 3.2. Market Drivers
- 3.2.1. Increasing Berry Consumption for Health Benefits; Increasing Adoption of High-Technology Farm Practices; Growing Usage of Berries in the Food and Beverage Industries
- 3.3. Market Restrains
- 3.3.1. High Production Cost Involved in Berry Production; Increasing Disease and Pest Infestations
- 3.4. Market Trends
- 3.4.1. Increasing Demand for Certified Coffee
- 4. Market Factor Analysis
- 4.1. Porters Five Forces
- 4.2. Supply/Value Chain
- 4.3. PESTEL analysis
- 4.4. Market Entropy
- 4.5. Patent/Trademark Analysis
- 5. Global Green Coffee Industry Analysis, Insights and Forecast, 2019-2031
- 5.1. Market Analysis, Insights and Forecast - by Production Analysis
- 5.2. Market Analysis, Insights and Forecast - by Consumption Analysis
- 5.3. Market Analysis, Insights and Forecast - by Import Market Analysis (Value & Volume)
- 5.4. Market Analysis, Insights and Forecast - by Export Market Analysis (Value & Volume)
- 5.5. Market Analysis, Insights and Forecast - by Price Trend Analysis
- 5.6. Market Analysis, Insights and Forecast - by Region
- 5.6.1. North America
- 5.6.2. Europe
- 5.6.3. Asia Pacific
- 5.6.4. South America
- 5.6.5. Middle East and Africa
- 5.1. Market Analysis, Insights and Forecast - by Production Analysis
- 6. North America Green Coffee Industry Analysis, Insights and Forecast, 2019-2031
- 6.1. Market Analysis, Insights and Forecast - by Production Analysis
- 6.2. Market Analysis, Insights and Forecast - by Consumption Analysis
- 6.3. Market Analysis, Insights and Forecast - by Import Market Analysis (Value & Volume)
- 6.4. Market Analysis, Insights and Forecast - by Export Market Analysis (Value & Volume)
- 6.5. Market Analysis, Insights and Forecast - by Price Trend Analysis
- 6.1. Market Analysis, Insights and Forecast - by Production Analysis
- 7. Europe Green Coffee Industry Analysis, Insights and Forecast, 2019-2031
- 7.1. Market Analysis, Insights and Forecast - by Production Analysis
- 7.2. Market Analysis, Insights and Forecast - by Consumption Analysis
- 7.3. Market Analysis, Insights and Forecast - by Import Market Analysis (Value & Volume)
- 7.4. Market Analysis, Insights and Forecast - by Export Market Analysis (Value & Volume)
- 7.5. Market Analysis, Insights and Forecast - by Price Trend Analysis
- 7.1. Market Analysis, Insights and Forecast - by Production Analysis
- 8. Asia Pacific Green Coffee Industry Analysis, Insights and Forecast, 2019-2031
- 8.1. Market Analysis, Insights and Forecast - by Production Analysis
- 8.2. Market Analysis, Insights and Forecast - by Consumption Analysis
- 8.3. Market Analysis, Insights and Forecast - by Import Market Analysis (Value & Volume)
- 8.4. Market Analysis, Insights and Forecast - by Export Market Analysis (Value & Volume)
- 8.5. Market Analysis, Insights and Forecast - by Price Trend Analysis
- 8.1. Market Analysis, Insights and Forecast - by Production Analysis
- 9. South America Green Coffee Industry Analysis, Insights and Forecast, 2019-2031
- 9.1. Market Analysis, Insights and Forecast - by Production Analysis
- 9.2. Market Analysis, Insights and Forecast - by Consumption Analysis
- 9.3. Market Analysis, Insights and Forecast - by Import Market Analysis (Value & Volume)
- 9.4. Market Analysis, Insights and Forecast - by Export Market Analysis (Value & Volume)
- 9.5. Market Analysis, Insights and Forecast - by Price Trend Analysis
- 9.1. Market Analysis, Insights and Forecast - by Production Analysis
- 10. Middle East and Africa Green Coffee Industry Analysis, Insights and Forecast, 2019-2031
- 10.1. Market Analysis, Insights and Forecast - by Production Analysis
- 10.2. Market Analysis, Insights and Forecast - by Consumption Analysis
- 10.3. Market Analysis, Insights and Forecast - by Import Market Analysis (Value & Volume)
- 10.4. Market Analysis, Insights and Forecast - by Export Market Analysis (Value & Volume)
- 10.5. Market Analysis, Insights and Forecast - by Price Trend Analysis
- 10.1. Market Analysis, Insights and Forecast - by Production Analysis
- 11. North America Green Coffee Industry Analysis, Insights and Forecast, 2019-2031
- 11.1. Market Analysis, Insights and Forecast - By Country/Sub-region
- 11.1.1 United States
- 11.1.2 Canada
- 11.1.3 Mexico
- 12. Europe Green Coffee Industry Analysis, Insights and Forecast, 2019-2031
- 12.1. Market Analysis, Insights and Forecast - By Country/Sub-region
- 12.1.1 Germany
- 12.1.2 United Kingdom
- 12.1.3 France
- 12.1.4 Spain
- 12.1.5 Italy
- 12.1.6 Spain
- 12.1.7 Belgium
- 12.1.8 Netherland
- 12.1.9 Nordics
- 12.1.10 Rest of Europe
- 13. Asia Pacific Green Coffee Industry Analysis, Insights and Forecast, 2019-2031
- 13.1. Market Analysis, Insights and Forecast - By Country/Sub-region
- 13.1.1 China
- 13.1.2 Japan
- 13.1.3 India
- 13.1.4 South Korea
- 13.1.5 Southeast Asia
- 13.1.6 Australia
- 13.1.7 Indonesia
- 13.1.8 Phillipes
- 13.1.9 Singapore
- 13.1.10 Thailandc
- 13.1.11 Rest of Asia Pacific
- 14. South America Green Coffee Industry Analysis, Insights and Forecast, 2019-2031
- 14.1. Market Analysis, Insights and Forecast - By Country/Sub-region
- 14.1.1 Brazil
- 14.1.2 Argentina
- 14.1.3 Peru
- 14.1.4 Chile
- 14.1.5 Colombia
- 14.1.6 Ecuador
- 14.1.7 Venezuela
- 14.1.8 Rest of South America
- 15. MEA Green Coffee Industry Analysis, Insights and Forecast, 2019-2031
- 15.1. Market Analysis, Insights and Forecast - By Country/Sub-region
- 15.1.1 United Arab Emirates
- 15.1.2 Saudi Arabia
- 15.1.3 South Africa
- 15.1.4 Rest of Middle East and Africa
- 16. Competitive Analysis
- 16.1. Global Market Share Analysis 2024
- 16.2. Company Profiles
- 16.2.1 Keurig Dr Pepper
- 16.2.1.1. Overview
- 16.2.1.2. Products
- 16.2.1.3. SWOT Analysis
- 16.2.1.4. Recent Developments
- 16.2.1.5. Financials (Based on Availability)
- 16.2.2 Starbucks
- 16.2.2.1. Overview
- 16.2.2.2. Products
- 16.2.2.3. SWOT Analysis
- 16.2.2.4. Recent Developments
- 16.2.2.5. Financials (Based on Availability)
- 16.2.3 Nestlé
- 16.2.3.1. Overview
- 16.2.3.2. Products
- 16.2.3.3. SWOT Analysis
- 16.2.3.4. Recent Developments
- 16.2.3.5. Financials (Based on Availability)
- 16.2.4 Olam International
- 16.2.4.1. Overview
- 16.2.4.2. Products
- 16.2.4.3. SWOT Analysis
- 16.2.4.4. Recent Developments
- 16.2.4.5. Financials (Based on Availability)
- 16.2.5 Volcafe
- 16.2.5.1. Overview
- 16.2.5.2. Products
- 16.2.5.3. SWOT Analysis
- 16.2.5.4. Recent Developments
- 16.2.5.5. Financials (Based on Availability)
- 16.2.6 Jacobs Douwe Egberts
- 16.2.6.1. Overview
- 16.2.6.2. Products
- 16.2.6.3. SWOT Analysis
- 16.2.6.4. Recent Developments
- 16.2.6.5. Financials (Based on Availability)
- 16.2.7 Lavazza illycaffè
- 16.2.7.1. Overview
- 16.2.7.2. Products
- 16.2.7.3. SWOT Analysis
- 16.2.7.4. Recent Developments
- 16.2.7.5. Financials (Based on Availability)
- 16.2.8 J.M. Smucker
- 16.2.8.1. Overview
- 16.2.8.2. Products
- 16.2.8.3. SWOT Analysis
- 16.2.8.4. Recent Developments
- 16.2.8.5. Financials (Based on Availability)
- 16.2.9 Kraft Heinz
- 16.2.9.1. Overview
- 16.2.9.2. Products
- 16.2.9.3. SWOT Analysis
- 16.2.9.4. Recent Developments
- 16.2.9.5. Financials (Based on Availability)
- 16.2.1 Keurig Dr Pepper
List of Figures
- Figure 1: Global Green Coffee Industry Revenue Breakdown (Million, %) by Region 2024 & 2032
- Figure 2: North America Green Coffee Industry Revenue (Million), by Country 2024 & 2032
- Figure 3: North America Green Coffee Industry Revenue Share (%), by Country 2024 & 2032
- Figure 4: Europe Green Coffee Industry Revenue (Million), by Country 2024 & 2032
- Figure 5: Europe Green Coffee Industry Revenue Share (%), by Country 2024 & 2032
- Figure 6: Asia Pacific Green Coffee Industry Revenue (Million), by Country 2024 & 2032
- Figure 7: Asia Pacific Green Coffee Industry Revenue Share (%), by Country 2024 & 2032
- Figure 8: South America Green Coffee Industry Revenue (Million), by Country 2024 & 2032
- Figure 9: South America Green Coffee Industry Revenue Share (%), by Country 2024 & 2032
- Figure 10: MEA Green Coffee Industry Revenue (Million), by Country 2024 & 2032
- Figure 11: MEA Green Coffee Industry Revenue Share (%), by Country 2024 & 2032
- Figure 12: North America Green Coffee Industry Revenue (Million), by Production Analysis 2024 & 2032
- Figure 13: North America Green Coffee Industry Revenue Share (%), by Production Analysis 2024 & 2032
- Figure 14: North America Green Coffee Industry Revenue (Million), by Consumption Analysis 2024 & 2032
- Figure 15: North America Green Coffee Industry Revenue Share (%), by Consumption Analysis 2024 & 2032
- Figure 16: North America Green Coffee Industry Revenue (Million), by Import Market Analysis (Value & Volume) 2024 & 2032
- Figure 17: North America Green Coffee Industry Revenue Share (%), by Import Market Analysis (Value & Volume) 2024 & 2032
- Figure 18: North America Green Coffee Industry Revenue (Million), by Export Market Analysis (Value & Volume) 2024 & 2032
- Figure 19: North America Green Coffee Industry Revenue Share (%), by Export Market Analysis (Value & Volume) 2024 & 2032
- Figure 20: North America Green Coffee Industry Revenue (Million), by Price Trend Analysis 2024 & 2032
- Figure 21: North America Green Coffee Industry Revenue Share (%), by Price Trend Analysis 2024 & 2032
- Figure 22: North America Green Coffee Industry Revenue (Million), by Country 2024 & 2032
- Figure 23: North America Green Coffee Industry Revenue Share (%), by Country 2024 & 2032
- Figure 24: Europe Green Coffee Industry Revenue (Million), by Production Analysis 2024 & 2032
- Figure 25: Europe Green Coffee Industry Revenue Share (%), by Production Analysis 2024 & 2032
- Figure 26: Europe Green Coffee Industry Revenue (Million), by Consumption Analysis 2024 & 2032
- Figure 27: Europe Green Coffee Industry Revenue Share (%), by Consumption Analysis 2024 & 2032
- Figure 28: Europe Green Coffee Industry Revenue (Million), by Import Market Analysis (Value & Volume) 2024 & 2032
- Figure 29: Europe Green Coffee Industry Revenue Share (%), by Import Market Analysis (Value & Volume) 2024 & 2032
- Figure 30: Europe Green Coffee Industry Revenue (Million), by Export Market Analysis (Value & Volume) 2024 & 2032
- Figure 31: Europe Green Coffee Industry Revenue Share (%), by Export Market Analysis (Value & Volume) 2024 & 2032
- Figure 32: Europe Green Coffee Industry Revenue (Million), by Price Trend Analysis 2024 & 2032
- Figure 33: Europe Green Coffee Industry Revenue Share (%), by Price Trend Analysis 2024 & 2032
- Figure 34: Europe Green Coffee Industry Revenue (Million), by Country 2024 & 2032
- Figure 35: Europe Green Coffee Industry Revenue Share (%), by Country 2024 & 2032
- Figure 36: Asia Pacific Green Coffee Industry Revenue (Million), by Production Analysis 2024 & 2032
- Figure 37: Asia Pacific Green Coffee Industry Revenue Share (%), by Production Analysis 2024 & 2032
- Figure 38: Asia Pacific Green Coffee Industry Revenue (Million), by Consumption Analysis 2024 & 2032
- Figure 39: Asia Pacific Green Coffee Industry Revenue Share (%), by Consumption Analysis 2024 & 2032
- Figure 40: Asia Pacific Green Coffee Industry Revenue (Million), by Import Market Analysis (Value & Volume) 2024 & 2032
- Figure 41: Asia Pacific Green Coffee Industry Revenue Share (%), by Import Market Analysis (Value & Volume) 2024 & 2032
- Figure 42: Asia Pacific Green Coffee Industry Revenue (Million), by Export Market Analysis (Value & Volume) 2024 & 2032
- Figure 43: Asia Pacific Green Coffee Industry Revenue Share (%), by Export Market Analysis (Value & Volume) 2024 & 2032
- Figure 44: Asia Pacific Green Coffee Industry Revenue (Million), by Price Trend Analysis 2024 & 2032
- Figure 45: Asia Pacific Green Coffee Industry Revenue Share (%), by Price Trend Analysis 2024 & 2032
- Figure 46: Asia Pacific Green Coffee Industry Revenue (Million), by Country 2024 & 2032
- Figure 47: Asia Pacific Green Coffee Industry Revenue Share (%), by Country 2024 & 2032
- Figure 48: South America Green Coffee Industry Revenue (Million), by Production Analysis 2024 & 2032
- Figure 49: South America Green Coffee Industry Revenue Share (%), by Production Analysis 2024 & 2032
- Figure 50: South America Green Coffee Industry Revenue (Million), by Consumption Analysis 2024 & 2032
- Figure 51: South America Green Coffee Industry Revenue Share (%), by Consumption Analysis 2024 & 2032
- Figure 52: South America Green Coffee Industry Revenue (Million), by Import Market Analysis (Value & Volume) 2024 & 2032
- Figure 53: South America Green Coffee Industry Revenue Share (%), by Import Market Analysis (Value & Volume) 2024 & 2032
- Figure 54: South America Green Coffee Industry Revenue (Million), by Export Market Analysis (Value & Volume) 2024 & 2032
- Figure 55: South America Green Coffee Industry Revenue Share (%), by Export Market Analysis (Value & Volume) 2024 & 2032
- Figure 56: South America Green Coffee Industry Revenue (Million), by Price Trend Analysis 2024 & 2032
- Figure 57: South America Green Coffee Industry Revenue Share (%), by Price Trend Analysis 2024 & 2032
- Figure 58: South America Green Coffee Industry Revenue (Million), by Country 2024 & 2032
- Figure 59: South America Green Coffee Industry Revenue Share (%), by Country 2024 & 2032
- Figure 60: Middle East and Africa Green Coffee Industry Revenue (Million), by Production Analysis 2024 & 2032
- Figure 61: Middle East and Africa Green Coffee Industry Revenue Share (%), by Production Analysis 2024 & 2032
- Figure 62: Middle East and Africa Green Coffee Industry Revenue (Million), by Consumption Analysis 2024 & 2032
- Figure 63: Middle East and Africa Green Coffee Industry Revenue Share (%), by Consumption Analysis 2024 & 2032
- Figure 64: Middle East and Africa Green Coffee Industry Revenue (Million), by Import Market Analysis (Value & Volume) 2024 & 2032
- Figure 65: Middle East and Africa Green Coffee Industry Revenue Share (%), by Import Market Analysis (Value & Volume) 2024 & 2032
- Figure 66: Middle East and Africa Green Coffee Industry Revenue (Million), by Export Market Analysis (Value & Volume) 2024 & 2032
- Figure 67: Middle East and Africa Green Coffee Industry Revenue Share (%), by Export Market Analysis (Value & Volume) 2024 & 2032
- Figure 68: Middle East and Africa Green Coffee Industry Revenue (Million), by Price Trend Analysis 2024 & 2032
- Figure 69: Middle East and Africa Green Coffee Industry Revenue Share (%), by Price Trend Analysis 2024 & 2032
- Figure 70: Middle East and Africa Green Coffee Industry Revenue (Million), by Country 2024 & 2032
- Figure 71: Middle East and Africa Green Coffee Industry Revenue Share (%), by Country 2024 & 2032
List of Tables
- Table 1: Global Green Coffee Industry Revenue Million Forecast, by Region 2019 & 2032
- Table 2: Global Green Coffee Industry Revenue Million Forecast, by Production Analysis 2019 & 2032
- Table 3: Global Green Coffee Industry Revenue Million Forecast, by Consumption Analysis 2019 & 2032
- Table 4: Global Green Coffee Industry Revenue Million Forecast, by Import Market Analysis (Value & Volume) 2019 & 2032
- Table 5: Global Green Coffee Industry Revenue Million Forecast, by Export Market Analysis (Value & Volume) 2019 & 2032
- Table 6: Global Green Coffee Industry Revenue Million Forecast, by Price Trend Analysis 2019 & 2032
- Table 7: Global Green Coffee Industry Revenue Million Forecast, by Region 2019 & 2032
- Table 8: Global Green Coffee Industry Revenue Million Forecast, by Country 2019 & 2032
- Table 9: United States Green Coffee Industry Revenue (Million) Forecast, by Application 2019 & 2032
- Table 10: Canada Green Coffee Industry Revenue (Million) Forecast, by Application 2019 & 2032
- Table 11: Mexico Green Coffee Industry Revenue (Million) Forecast, by Application 2019 & 2032
- Table 12: Global Green Coffee Industry Revenue Million Forecast, by Country 2019 & 2032
- Table 13: Germany Green Coffee Industry Revenue (Million) Forecast, by Application 2019 & 2032
- Table 14: United Kingdom Green Coffee Industry Revenue (Million) Forecast, by Application 2019 & 2032
- Table 15: France Green Coffee Industry Revenue (Million) Forecast, by Application 2019 & 2032
- Table 16: Spain Green Coffee Industry Revenue (Million) Forecast, by Application 2019 & 2032
- Table 17: Italy Green Coffee Industry Revenue (Million) Forecast, by Application 2019 & 2032
- Table 18: Spain Green Coffee Industry Revenue (Million) Forecast, by Application 2019 & 2032
- Table 19: Belgium Green Coffee Industry Revenue (Million) Forecast, by Application 2019 & 2032
- Table 20: Netherland Green Coffee Industry Revenue (Million) Forecast, by Application 2019 & 2032
- Table 21: Nordics Green Coffee Industry Revenue (Million) Forecast, by Application 2019 & 2032
- Table 22: Rest of Europe Green Coffee Industry Revenue (Million) Forecast, by Application 2019 & 2032
- Table 23: Global Green Coffee Industry Revenue Million Forecast, by Country 2019 & 2032
- Table 24: China Green Coffee Industry Revenue (Million) Forecast, by Application 2019 & 2032
- Table 25: Japan Green Coffee Industry Revenue (Million) Forecast, by Application 2019 & 2032
- Table 26: India Green Coffee Industry Revenue (Million) Forecast, by Application 2019 & 2032
- Table 27: South Korea Green Coffee Industry Revenue (Million) Forecast, by Application 2019 & 2032
- Table 28: Southeast Asia Green Coffee Industry Revenue (Million) Forecast, by Application 2019 & 2032
- Table 29: Australia Green Coffee Industry Revenue (Million) Forecast, by Application 2019 & 2032
- Table 30: Indonesia Green Coffee Industry Revenue (Million) Forecast, by Application 2019 & 2032
- Table 31: Phillipes Green Coffee Industry Revenue (Million) Forecast, by Application 2019 & 2032
- Table 32: Singapore Green Coffee Industry Revenue (Million) Forecast, by Application 2019 & 2032
- Table 33: Thailandc Green Coffee Industry Revenue (Million) Forecast, by Application 2019 & 2032
- Table 34: Rest of Asia Pacific Green Coffee Industry Revenue (Million) Forecast, by Application 2019 & 2032
- Table 35: Global Green Coffee Industry Revenue Million Forecast, by Country 2019 & 2032
- Table 36: Brazil Green Coffee Industry Revenue (Million) Forecast, by Application 2019 & 2032
- Table 37: Argentina Green Coffee Industry Revenue (Million) Forecast, by Application 2019 & 2032
- Table 38: Peru Green Coffee Industry Revenue (Million) Forecast, by Application 2019 & 2032
- Table 39: Chile Green Coffee Industry Revenue (Million) Forecast, by Application 2019 & 2032
- Table 40: Colombia Green Coffee Industry Revenue (Million) Forecast, by Application 2019 & 2032
- Table 41: Ecuador Green Coffee Industry Revenue (Million) Forecast, by Application 2019 & 2032
- Table 42: Venezuela Green Coffee Industry Revenue (Million) Forecast, by Application 2019 & 2032
- Table 43: Rest of South America Green Coffee Industry Revenue (Million) Forecast, by Application 2019 & 2032
- Table 44: Global Green Coffee Industry Revenue Million Forecast, by Country 2019 & 2032
- Table 45: United Arab Emirates Green Coffee Industry Revenue (Million) Forecast, by Application 2019 & 2032
- Table 46: Saudi Arabia Green Coffee Industry Revenue (Million) Forecast, by Application 2019 & 2032
- Table 47: South Africa Green Coffee Industry Revenue (Million) Forecast, by Application 2019 & 2032
- Table 48: Rest of Middle East and Africa Green Coffee Industry Revenue (Million) Forecast, by Application 2019 & 2032
- Table 49: Global Green Coffee Industry Revenue Million Forecast, by Production Analysis 2019 & 2032
- Table 50: Global Green Coffee Industry Revenue Million Forecast, by Consumption Analysis 2019 & 2032
- Table 51: Global Green Coffee Industry Revenue Million Forecast, by Import Market Analysis (Value & Volume) 2019 & 2032
- Table 52: Global Green Coffee Industry Revenue Million Forecast, by Export Market Analysis (Value & Volume) 2019 & 2032
- Table 53: Global Green Coffee Industry Revenue Million Forecast, by Price Trend Analysis 2019 & 2032
- Table 54: Global Green Coffee Industry Revenue Million Forecast, by Country 2019 & 2032
- Table 55: United States Green Coffee Industry Revenue (Million) Forecast, by Application 2019 & 2032
- Table 56: Canada Green Coffee Industry Revenue (Million) Forecast, by Application 2019 & 2032
- Table 57: Mexico Green Coffee Industry Revenue (Million) Forecast, by Application 2019 & 2032
- Table 58: Global Green Coffee Industry Revenue Million Forecast, by Production Analysis 2019 & 2032
- Table 59: Global Green Coffee Industry Revenue Million Forecast, by Consumption Analysis 2019 & 2032
- Table 60: Global Green Coffee Industry Revenue Million Forecast, by Import Market Analysis (Value & Volume) 2019 & 2032
- Table 61: Global Green Coffee Industry Revenue Million Forecast, by Export Market Analysis (Value & Volume) 2019 & 2032
- Table 62: Global Green Coffee Industry Revenue Million Forecast, by Price Trend Analysis 2019 & 2032
- Table 63: Global Green Coffee Industry Revenue Million Forecast, by Country 2019 & 2032
- Table 64: Germany Green Coffee Industry Revenue (Million) Forecast, by Application 2019 & 2032
- Table 65: United Kingdom Green Coffee Industry Revenue (Million) Forecast, by Application 2019 & 2032
- Table 66: Spain Green Coffee Industry Revenue (Million) Forecast, by Application 2019 & 2032
- Table 67: France Green Coffee Industry Revenue (Million) Forecast, by Application 2019 & 2032
- Table 68: Italy Green Coffee Industry Revenue (Million) Forecast, by Application 2019 & 2032
- Table 69: Belgium Green Coffee Industry Revenue (Million) Forecast, by Application 2019 & 2032
- Table 70: Russia Green Coffee Industry Revenue (Million) Forecast, by Application 2019 & 2032
- Table 71: Global Green Coffee Industry Revenue Million Forecast, by Production Analysis 2019 & 2032
- Table 72: Global Green Coffee Industry Revenue Million Forecast, by Consumption Analysis 2019 & 2032
- Table 73: Global Green Coffee Industry Revenue Million Forecast, by Import Market Analysis (Value & Volume) 2019 & 2032
- Table 74: Global Green Coffee Industry Revenue Million Forecast, by Export Market Analysis (Value & Volume) 2019 & 2032
- Table 75: Global Green Coffee Industry Revenue Million Forecast, by Price Trend Analysis 2019 & 2032
- Table 76: Global Green Coffee Industry Revenue Million Forecast, by Country 2019 & 2032
- Table 77: China Green Coffee Industry Revenue (Million) Forecast, by Application 2019 & 2032
- Table 78: Vietnam Green Coffee Industry Revenue (Million) Forecast, by Application 2019 & 2032
- Table 79: Indonesia Green Coffee Industry Revenue (Million) Forecast, by Application 2019 & 2032
- Table 80: India Green Coffee Industry Revenue (Million) Forecast, by Application 2019 & 2032
- Table 81: Japan Green Coffee Industry Revenue (Million) Forecast, by Application 2019 & 2032
- Table 82: Global Green Coffee Industry Revenue Million Forecast, by Production Analysis 2019 & 2032
- Table 83: Global Green Coffee Industry Revenue Million Forecast, by Consumption Analysis 2019 & 2032
- Table 84: Global Green Coffee Industry Revenue Million Forecast, by Import Market Analysis (Value & Volume) 2019 & 2032
- Table 85: Global Green Coffee Industry Revenue Million Forecast, by Export Market Analysis (Value & Volume) 2019 & 2032
- Table 86: Global Green Coffee Industry Revenue Million Forecast, by Price Trend Analysis 2019 & 2032
- Table 87: Global Green Coffee Industry Revenue Million Forecast, by Country 2019 & 2032
- Table 88: Brazil Green Coffee Industry Revenue (Million) Forecast, by Application 2019 & 2032
- Table 89: Colombia Green Coffee Industry Revenue (Million) Forecast, by Application 2019 & 2032
- Table 90: Global Green Coffee Industry Revenue Million Forecast, by Production Analysis 2019 & 2032
- Table 91: Global Green Coffee Industry Revenue Million Forecast, by Consumption Analysis 2019 & 2032
- Table 92: Global Green Coffee Industry Revenue Million Forecast, by Import Market Analysis (Value & Volume) 2019 & 2032
- Table 93: Global Green Coffee Industry Revenue Million Forecast, by Export Market Analysis (Value & Volume) 2019 & 2032
- Table 94: Global Green Coffee Industry Revenue Million Forecast, by Price Trend Analysis 2019 & 2032
- Table 95: Global Green Coffee Industry Revenue Million Forecast, by Country 2019 & 2032
- Table 96: Uganda Green Coffee Industry Revenue (Million) Forecast, by Application 2019 & 2032
- Table 97: Ethiopia Green Coffee Industry Revenue (Million) Forecast, by Application 2019 & 2032
Frequently Asked Questions
1. What is the projected Compound Annual Growth Rate (CAGR) of the Green Coffee Industry?
The projected CAGR is approximately 6.00%.
2. Which companies are prominent players in the Green Coffee Industry?
Key companies in the market include Keurig Dr Pepper , Starbucks , Nestlé , Olam International , Volcafe, Jacobs Douwe Egberts , Lavazza illycaffè , J.M. Smucker , Kraft Heinz .
3. What are the main segments of the Green Coffee Industry?
The market segments include Production Analysis, Consumption Analysis, Import Market Analysis (Value & Volume), Export Market Analysis (Value & Volume), Price Trend Analysis.
4. Can you provide details about the market size?
The market size is estimated to be USD 35.33 Million as of 2022.
5. What are some drivers contributing to market growth?
Increasing Berry Consumption for Health Benefits; Increasing Adoption of High-Technology Farm Practices; Growing Usage of Berries in the Food and Beverage Industries.
6. What are the notable trends driving market growth?
Increasing Demand for Certified Coffee.
7. Are there any restraints impacting market growth?
High Production Cost Involved in Berry Production; Increasing Disease and Pest Infestations.
8. Can you provide examples of recent developments in the market?
July 2022: The Ethiopian Coffee and Tea Authority (ECTA) released a new, comprehensive strategy for the country's coffee sector, which was developed in collaboration with the Ethiopian Institute of Agriculture Research (EIAR) and international nonprofit TechnoServe to increase coffee production by three times within next 10 years.
9. What pricing options are available for accessing the report?
Pricing options include single-user, multi-user, and enterprise licenses priced at USD 4750, USD 5250, and USD 8750 respectively.
10. Is the market size provided in terms of value or volume?
The market size is provided in terms of value, measured in Million.
11. Are there any specific market keywords associated with the report?
Yes, the market keyword associated with the report is "Green Coffee Industry," which aids in identifying and referencing the specific market segment covered.
12. How do I determine which pricing option suits my needs best?
The pricing options vary based on user requirements and access needs. Individual users may opt for single-user licenses, while businesses requiring broader access may choose multi-user or enterprise licenses for cost-effective access to the report.
13. Are there any additional resources or data provided in the Green Coffee Industry report?
While the report offers comprehensive insights, it's advisable to review the specific contents or supplementary materials provided to ascertain if additional resources or data are available.
14. How can I stay updated on further developments or reports in the Green Coffee Industry?
To stay informed about further developments, trends, and reports in the Green Coffee Industry, consider subscribing to industry newsletters, following relevant companies and organizations, or regularly checking reputable industry news sources and publications.
Methodology
Step 1 - Identification of Relevant Samples Size from Population Database


Step 2 - Approaches for Defining Global Market Size (Value, Volume* & Price*)

Note*: In applicable scenarios
Step 3 - Data Sources
Primary Research
- Web Analytics
- Survey Reports
- Research Institute
- Latest Research Reports
- Opinion Leaders
Secondary Research
- Annual Reports
- White Paper
- Latest Press Release
- Industry Association
- Paid Database
- Investor Presentations

Step 4 - Data Triangulation
Involves using different sources of information in order to increase the validity of a study
These sources are likely to be stakeholders in a program - participants, other researchers, program staff, other community members, and so on.
Then we put all data in single framework & apply various statistical tools to find out the dynamic on the market.
During the analysis stage, feedback from the stakeholder groups would be compared to determine areas of agreement as well as areas of divergence


