
Key Insights
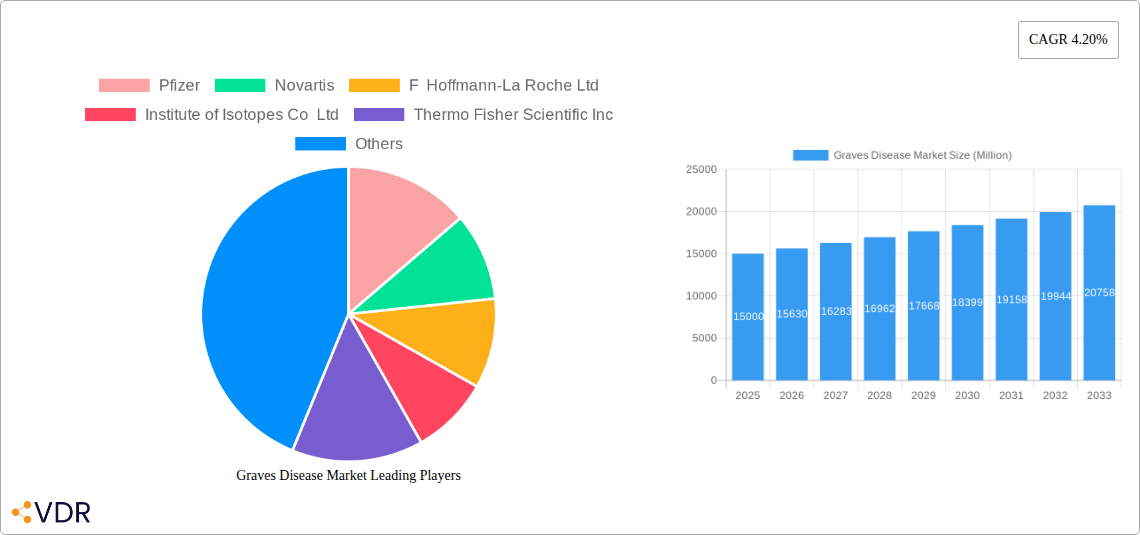
The Graves' disease market, exhibiting a Compound Annual Growth Rate (CAGR) of 4.20%, presents a significant opportunity for growth. Driven by increasing prevalence of autoimmune disorders, rising awareness about the disease, and advancements in diagnostic and therapeutic techniques, the market is projected to experience substantial expansion from 2025 to 2033. The market segmentation reveals a strong reliance on anti-thyroid medication, radioactive iodine therapy, and surgery as primary treatment modalities. Diagnostic methods such as ultrasound, imaging tests, and radioactive iodine uptake tests play a crucial role in early and accurate diagnosis, facilitating timely intervention. Key players like Pfizer, Novartis, and Roche, alongside specialized companies like Thermo Fisher Scientific and Abbott, are driving innovation in the development of newer and more effective therapies. The geographical distribution of the market indicates robust growth in North America and Europe, fuelled by higher healthcare expenditure and better access to advanced medical facilities. However, Asia Pacific is also expected to witness significant growth due to rising healthcare awareness and improving healthcare infrastructure, especially in countries like China and India. Restraints on market growth may include high treatment costs, particularly for advanced therapies, and the potential for adverse effects associated with certain treatments. Nevertheless, ongoing research and development in the field are likely to alleviate some of these constraints, contributing to the overall growth trajectory of the Graves' disease market.
The competitive landscape is characterized by a mix of large pharmaceutical companies and specialized diagnostic firms. Strategic partnerships and collaborations between these players are likely to enhance product portfolios and expand market reach. The market’s future will likely be shaped by the development of personalized medicine approaches tailored to individual patient characteristics, the introduction of novel therapeutic agents with improved efficacy and safety profiles, and the continued integration of advanced diagnostic tools. Further research on the underlying causes of Graves' disease may also lead to the development of preventative measures, potentially impacting the long-term market dynamics. The focus on early detection and efficient management of the disease is crucial in mitigating long-term complications and improving patient outcomes, hence driving market expansion.
Graves Disease Market: A Comprehensive Market Report (2019-2033)
This in-depth report provides a comprehensive analysis of the Graves Disease market, encompassing market dynamics, growth trends, regional dominance, product landscape, key players, and future outlook. The study period spans from 2019 to 2033, with 2025 serving as the base and estimated year. The report segments the market by treatment (Anti-Thyroid Medication, Radioactive Iodine Therapy, Surgery) and diagnosis (Ultrasound, Imaging Test, Radioactive Iodine Uptake, Blood Sample), providing granular insights into each segment's performance and growth potential. The total market value is projected to reach xx Million by 2033.
Graves Disease Market Dynamics & Structure
The Graves Disease market exhibits a moderately consolidated structure, with key players like Pfizer, Novartis, F Hoffmann-La Roche Ltd, and Abbott holding significant market share. Technological innovation, particularly in diagnostic techniques and targeted therapies, is a primary driver of market growth. Stringent regulatory frameworks governing drug approvals and medical devices influence market dynamics. Competitive substitutes, such as alternative treatment approaches for hyperthyroidism, pose challenges. The end-user demographics are predominantly female, with a higher incidence in specific age groups. M&A activity within the market is relatively moderate, with xx deals recorded between 2019 and 2024, representing a xx% CAGR.
- Market Concentration: Moderately Consolidated (Top 5 players hold xx% market share in 2025)
- Technological Innovation: Focus on developing more effective and targeted therapies, improved diagnostic tools (e.g., Mindray's TRAb assay).
- Regulatory Frameworks: Stringent FDA and EMA approvals influencing market entry and pricing.
- Competitive Substitutes: Alternative treatment approaches for hyperthyroidism create competitive pressure.
- End-User Demographics: Predominantly affects women, with age-specific incidence rates.
- M&A Trends: Moderate activity, with xx deals recorded between 2019 and 2024.
Graves Disease Market Growth Trends & Insights
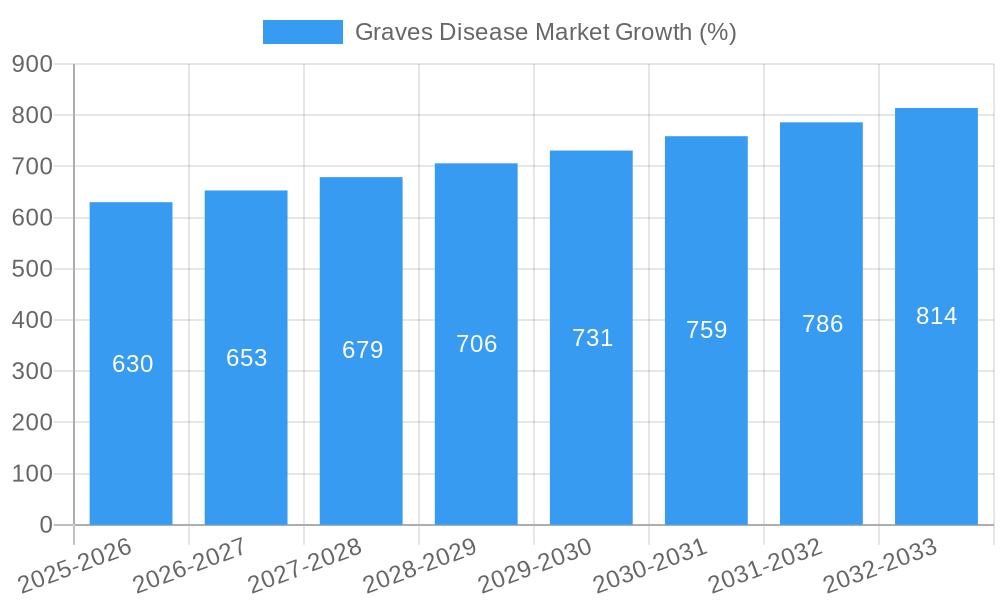
The Graves Disease market experienced steady growth during the historical period (2019-2024), with a CAGR of xx%. This growth is attributed to rising prevalence of Graves' disease, increased awareness, and advancements in diagnostic and therapeutic approaches. The market size is estimated at xx Million in 2025 and is projected to reach xx Million by 2033, exhibiting a CAGR of xx% during the forecast period (2025-2033). This growth is further fueled by technological disruptions, leading to improved treatment efficacy and diagnostic accuracy. Shifts in consumer behavior, including increased demand for minimally invasive procedures, are also influencing market trends. Market penetration of advanced diagnostic tests is projected to increase from xx% in 2025 to xx% by 2033.
Dominant Regions, Countries, or Segments in Graves Disease Market
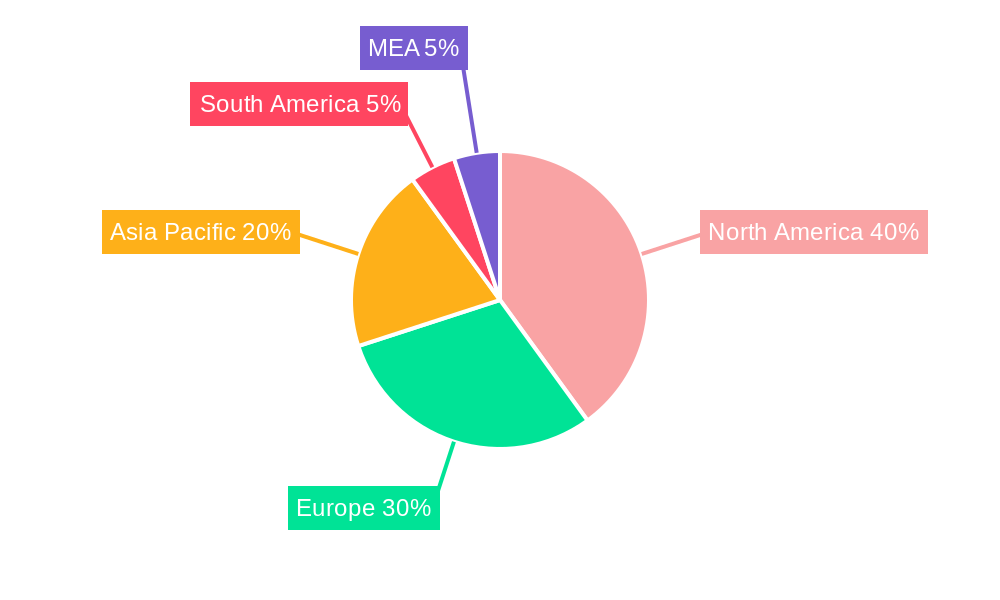
North America currently dominates the Graves Disease market, driven by high healthcare expenditure, advanced healthcare infrastructure, and a relatively high prevalence of the disease. Within the treatment segment, Anti-Thyroid Medication holds the largest market share due to its widespread adoption and relative cost-effectiveness. The Imaging Test segment leads the diagnostic market, benefiting from its non-invasive nature and widespread availability.
- North America: High healthcare expenditure, advanced infrastructure, and high prevalence drive market dominance.
- Europe: Significant market, influenced by healthcare policies and reimbursement frameworks.
- Asia-Pacific: Growing market, driven by rising awareness, increasing healthcare spending, and expanding healthcare infrastructure.
- By Treatment: Anti-thyroid medication dominates due to cost-effectiveness and widespread usage.
- By Diagnosis: Imaging tests lead due to non-invasive nature and accessibility.
Graves Disease Market Product Landscape
The Graves Disease market offers a range of products, including anti-thyroid medications, radioactive iodine therapies, surgical instruments, and diagnostic imaging equipment. Recent innovations focus on improving drug efficacy, reducing side effects, and enhancing diagnostic accuracy. Unique selling propositions often revolve around improved patient outcomes, reduced treatment time, and minimal invasiveness. Technological advancements involve the development of targeted therapies, advanced imaging techniques, and minimally invasive surgical approaches.
Key Drivers, Barriers & Challenges in Graves Disease Market
Key Drivers:
- Rising prevalence of Graves' disease globally.
- Technological advancements in diagnostics and treatment.
- Increased awareness and improved patient access to healthcare.
Challenges & Restraints:
- High cost of advanced therapies and diagnostic procedures.
- Side effects associated with certain treatments.
- Stringent regulatory approvals for new drugs and devices.
- Limited access to advanced treatments in developing countries.
Emerging Opportunities in Graves Disease Market
Untapped markets in developing economies present significant growth opportunities. The development of personalized medicine approaches tailored to individual patient needs is an emerging trend. Innovative applications of telemedicine and remote patient monitoring can improve access to care and reduce healthcare costs. Evolving consumer preferences, emphasizing minimally invasive procedures and improved patient experience, represent significant opportunities.
Growth Accelerators in the Graves Disease Market Industry
Technological breakthroughs in drug development and diagnostic tools are driving long-term growth. Strategic partnerships between pharmaceutical companies, diagnostic equipment manufacturers, and healthcare providers facilitate market expansion. Government initiatives to improve access to healthcare and raise awareness about Graves' disease are also significant catalysts.
Key Players Shaping the Graves Disease Market Market
- Pfizer
- Novartis
- F Hoffmann-La Roche Ltd
- Institute of Isotopes Co Ltd
- Thermo Fisher Scientific Inc
- Horizon Therapeutics Ireland DAC
- Abbott
- Jubilant Pharma Holdings Inc
- bioMerieux SA
- Sun Pharma
Notable Milestones in Graves Disease Market Sector
- June 2022: Sling Therapeutics secures USD 35 million Series A funding for linsitinib clinical trial targeting thyroid eye disease (TED), a frequent complication of Graves' disease.
- May 2022: Mindray launches TRAb assay for improved Graves' disease diagnosis and management.
In-Depth Graves Disease Market Market Outlook
The Graves Disease market is poised for continued growth, driven by technological innovation, increased awareness, and expanding access to healthcare. Strategic partnerships and market expansion into underserved regions present significant opportunities for market players. The focus on personalized medicine and innovative diagnostic tools will further shape the market landscape in the coming years. The market exhibits strong potential for long-term growth, with significant opportunities for companies that invest in research and development, enhance product portfolios, and adapt to evolving market demands.
Graves Disease Market Segmentation
-
1. Diagnosis
- 1.1. Ultrasound
- 1.2. Imaging Test
- 1.3. Radioactive Iodine Uptake
- 1.4. Blood Sample
-
2. Treatment
- 2.1. Anti-Thyroid Medication
- 2.2. Radioactive Iodine Therapy
- 2.3. Surgery
Graves Disease Market Segmentation By Geography
- 1. North America
- 2. Europe
- 3. Asia Pacific
- 4. Middle East and Africa
- 5. South America
Graves Disease Market REPORT HIGHLIGHTS
| Aspects | Details |
|---|---|
| Study Period | 2019-2033 |
| Base Year | 2024 |
| Estimated Year | 2025 |
| Forecast Period | 2025-2033 |
| Historical Period | 2019-2024 |
| Growth Rate | CAGR of 4.20% from 2019-2033 |
| Segmentation |
|
Table of Contents
- 1. Introduction
- 1.1. Research Scope
- 1.2. Market Segmentation
- 1.3. Research Methodology
- 1.4. Definitions and Assumptions
- 2. Executive Summary
- 2.1. Introduction
- 3. Market Dynamics
- 3.1. Introduction
- 3.2. Market Drivers
- 3.2.1. Increasing Prevalance of Hyperthyroidism; Increasing Funding for Rare Diseases
- 3.3. Market Restrains
- 3.3.1. High Cost of Treatment
- 3.4. Market Trends
- 3.4.1. Anti-Thyroid Medication Expected to Dominate the Market
- 4. Market Factor Analysis
- 4.1. Porters Five Forces
- 4.2. Supply/Value Chain
- 4.3. PESTEL analysis
- 4.4. Market Entropy
- 4.5. Patent/Trademark Analysis
- 5. Global Graves Disease Market Analysis, Insights and Forecast, 2019-2031
- 5.1. Market Analysis, Insights and Forecast - by Diagnosis
- 5.1.1. Ultrasound
- 5.1.2. Imaging Test
- 5.1.3. Radioactive Iodine Uptake
- 5.1.4. Blood Sample
- 5.2. Market Analysis, Insights and Forecast - by Treatment
- 5.2.1. Anti-Thyroid Medication
- 5.2.2. Radioactive Iodine Therapy
- 5.2.3. Surgery
- 5.3. Market Analysis, Insights and Forecast - by Region
- 5.3.1. North America
- 5.3.2. Europe
- 5.3.3. Asia Pacific
- 5.3.4. Middle East and Africa
- 5.3.5. South America
- 5.1. Market Analysis, Insights and Forecast - by Diagnosis
- 6. North America Graves Disease Market Analysis, Insights and Forecast, 2019-2031
- 6.1. Market Analysis, Insights and Forecast - by Diagnosis
- 6.1.1. Ultrasound
- 6.1.2. Imaging Test
- 6.1.3. Radioactive Iodine Uptake
- 6.1.4. Blood Sample
- 6.2. Market Analysis, Insights and Forecast - by Treatment
- 6.2.1. Anti-Thyroid Medication
- 6.2.2. Radioactive Iodine Therapy
- 6.2.3. Surgery
- 6.1. Market Analysis, Insights and Forecast - by Diagnosis
- 7. Europe Graves Disease Market Analysis, Insights and Forecast, 2019-2031
- 7.1. Market Analysis, Insights and Forecast - by Diagnosis
- 7.1.1. Ultrasound
- 7.1.2. Imaging Test
- 7.1.3. Radioactive Iodine Uptake
- 7.1.4. Blood Sample
- 7.2. Market Analysis, Insights and Forecast - by Treatment
- 7.2.1. Anti-Thyroid Medication
- 7.2.2. Radioactive Iodine Therapy
- 7.2.3. Surgery
- 7.1. Market Analysis, Insights and Forecast - by Diagnosis
- 8. Asia Pacific Graves Disease Market Analysis, Insights and Forecast, 2019-2031
- 8.1. Market Analysis, Insights and Forecast - by Diagnosis
- 8.1.1. Ultrasound
- 8.1.2. Imaging Test
- 8.1.3. Radioactive Iodine Uptake
- 8.1.4. Blood Sample
- 8.2. Market Analysis, Insights and Forecast - by Treatment
- 8.2.1. Anti-Thyroid Medication
- 8.2.2. Radioactive Iodine Therapy
- 8.2.3. Surgery
- 8.1. Market Analysis, Insights and Forecast - by Diagnosis
- 9. Middle East and Africa Graves Disease Market Analysis, Insights and Forecast, 2019-2031
- 9.1. Market Analysis, Insights and Forecast - by Diagnosis
- 9.1.1. Ultrasound
- 9.1.2. Imaging Test
- 9.1.3. Radioactive Iodine Uptake
- 9.1.4. Blood Sample
- 9.2. Market Analysis, Insights and Forecast - by Treatment
- 9.2.1. Anti-Thyroid Medication
- 9.2.2. Radioactive Iodine Therapy
- 9.2.3. Surgery
- 9.1. Market Analysis, Insights and Forecast - by Diagnosis
- 10. South America Graves Disease Market Analysis, Insights and Forecast, 2019-2031
- 10.1. Market Analysis, Insights and Forecast - by Diagnosis
- 10.1.1. Ultrasound
- 10.1.2. Imaging Test
- 10.1.3. Radioactive Iodine Uptake
- 10.1.4. Blood Sample
- 10.2. Market Analysis, Insights and Forecast - by Treatment
- 10.2.1. Anti-Thyroid Medication
- 10.2.2. Radioactive Iodine Therapy
- 10.2.3. Surgery
- 10.1. Market Analysis, Insights and Forecast - by Diagnosis
- 11. North America Graves Disease Market Analysis, Insights and Forecast, 2019-2031
- 11.1. Market Analysis, Insights and Forecast - By Country/Sub-region
- 11.1.1 United States
- 11.1.2 Canada
- 11.1.3 Mexico
- 12. Europe Graves Disease Market Analysis, Insights and Forecast, 2019-2031
- 12.1. Market Analysis, Insights and Forecast - By Country/Sub-region
- 12.1.1 Germany
- 12.1.2 United Kingdom
- 12.1.3 France
- 12.1.4 Spain
- 12.1.5 Italy
- 12.1.6 Spain
- 12.1.7 Belgium
- 12.1.8 Netherland
- 12.1.9 Nordics
- 12.1.10 Rest of Europe
- 13. Asia Pacific Graves Disease Market Analysis, Insights and Forecast, 2019-2031
- 13.1. Market Analysis, Insights and Forecast - By Country/Sub-region
- 13.1.1 China
- 13.1.2 Japan
- 13.1.3 India
- 13.1.4 South Korea
- 13.1.5 Southeast Asia
- 13.1.6 Australia
- 13.1.7 Indonesia
- 13.1.8 Phillipes
- 13.1.9 Singapore
- 13.1.10 Thailandc
- 13.1.11 Rest of Asia Pacific
- 14. South America Graves Disease Market Analysis, Insights and Forecast, 2019-2031
- 14.1. Market Analysis, Insights and Forecast - By Country/Sub-region
- 14.1.1 Brazil
- 14.1.2 Argentina
- 14.1.3 Peru
- 14.1.4 Chile
- 14.1.5 Colombia
- 14.1.6 Ecuador
- 14.1.7 Venezuela
- 14.1.8 Rest of South America
- 15. North America Graves Disease Market Analysis, Insights and Forecast, 2019-2031
- 15.1. Market Analysis, Insights and Forecast - By Country/Sub-region
- 15.1.1 United States
- 15.1.2 Canada
- 15.1.3 Mexico
- 16. MEA Graves Disease Market Analysis, Insights and Forecast, 2019-2031
- 16.1. Market Analysis, Insights and Forecast - By Country/Sub-region
- 16.1.1 United Arab Emirates
- 16.1.2 Saudi Arabia
- 16.1.3 South Africa
- 16.1.4 Rest of Middle East and Africa
- 17. Competitive Analysis
- 17.1. Global Market Share Analysis 2024
- 17.2. Company Profiles
- 17.2.1 Pfizer
- 17.2.1.1. Overview
- 17.2.1.2. Products
- 17.2.1.3. SWOT Analysis
- 17.2.1.4. Recent Developments
- 17.2.1.5. Financials (Based on Availability)
- 17.2.2 Novartis
- 17.2.2.1. Overview
- 17.2.2.2. Products
- 17.2.2.3. SWOT Analysis
- 17.2.2.4. Recent Developments
- 17.2.2.5. Financials (Based on Availability)
- 17.2.3 F Hoffmann-La Roche Ltd
- 17.2.3.1. Overview
- 17.2.3.2. Products
- 17.2.3.3. SWOT Analysis
- 17.2.3.4. Recent Developments
- 17.2.3.5. Financials (Based on Availability)
- 17.2.4 Institute of Isotopes Co Ltd
- 17.2.4.1. Overview
- 17.2.4.2. Products
- 17.2.4.3. SWOT Analysis
- 17.2.4.4. Recent Developments
- 17.2.4.5. Financials (Based on Availability)
- 17.2.5 Thermo Fisher Scientific Inc
- 17.2.5.1. Overview
- 17.2.5.2. Products
- 17.2.5.3. SWOT Analysis
- 17.2.5.4. Recent Developments
- 17.2.5.5. Financials (Based on Availability)
- 17.2.6 Horizon Therapeutics Ireland DAC
- 17.2.6.1. Overview
- 17.2.6.2. Products
- 17.2.6.3. SWOT Analysis
- 17.2.6.4. Recent Developments
- 17.2.6.5. Financials (Based on Availability)
- 17.2.7 Abbott
- 17.2.7.1. Overview
- 17.2.7.2. Products
- 17.2.7.3. SWOT Analysis
- 17.2.7.4. Recent Developments
- 17.2.7.5. Financials (Based on Availability)
- 17.2.8 Jubilant Pharma Holdings Inc
- 17.2.8.1. Overview
- 17.2.8.2. Products
- 17.2.8.3. SWOT Analysis
- 17.2.8.4. Recent Developments
- 17.2.8.5. Financials (Based on Availability)
- 17.2.9 bioMerieux SA
- 17.2.9.1. Overview
- 17.2.9.2. Products
- 17.2.9.3. SWOT Analysis
- 17.2.9.4. Recent Developments
- 17.2.9.5. Financials (Based on Availability)
- 17.2.10 Sun Pharma
- 17.2.10.1. Overview
- 17.2.10.2. Products
- 17.2.10.3. SWOT Analysis
- 17.2.10.4. Recent Developments
- 17.2.10.5. Financials (Based on Availability)
- 17.2.1 Pfizer
List of Figures
- Figure 1: Global Graves Disease Market Revenue Breakdown (Million, %) by Region 2024 & 2032
- Figure 2: Global Graves Disease Market Volume Breakdown (K Unit, %) by Region 2024 & 2032
- Figure 3: North America Graves Disease Market Revenue (Million), by Country 2024 & 2032
- Figure 4: North America Graves Disease Market Volume (K Unit), by Country 2024 & 2032
- Figure 5: North America Graves Disease Market Revenue Share (%), by Country 2024 & 2032
- Figure 6: North America Graves Disease Market Volume Share (%), by Country 2024 & 2032
- Figure 7: Europe Graves Disease Market Revenue (Million), by Country 2024 & 2032
- Figure 8: Europe Graves Disease Market Volume (K Unit), by Country 2024 & 2032
- Figure 9: Europe Graves Disease Market Revenue Share (%), by Country 2024 & 2032
- Figure 10: Europe Graves Disease Market Volume Share (%), by Country 2024 & 2032
- Figure 11: Asia Pacific Graves Disease Market Revenue (Million), by Country 2024 & 2032
- Figure 12: Asia Pacific Graves Disease Market Volume (K Unit), by Country 2024 & 2032
- Figure 13: Asia Pacific Graves Disease Market Revenue Share (%), by Country 2024 & 2032
- Figure 14: Asia Pacific Graves Disease Market Volume Share (%), by Country 2024 & 2032
- Figure 15: South America Graves Disease Market Revenue (Million), by Country 2024 & 2032
- Figure 16: South America Graves Disease Market Volume (K Unit), by Country 2024 & 2032
- Figure 17: South America Graves Disease Market Revenue Share (%), by Country 2024 & 2032
- Figure 18: South America Graves Disease Market Volume Share (%), by Country 2024 & 2032
- Figure 19: North America Graves Disease Market Revenue (Million), by Country 2024 & 2032
- Figure 20: North America Graves Disease Market Volume (K Unit), by Country 2024 & 2032
- Figure 21: North America Graves Disease Market Revenue Share (%), by Country 2024 & 2032
- Figure 22: North America Graves Disease Market Volume Share (%), by Country 2024 & 2032
- Figure 23: MEA Graves Disease Market Revenue (Million), by Country 2024 & 2032
- Figure 24: MEA Graves Disease Market Volume (K Unit), by Country 2024 & 2032
- Figure 25: MEA Graves Disease Market Revenue Share (%), by Country 2024 & 2032
- Figure 26: MEA Graves Disease Market Volume Share (%), by Country 2024 & 2032
- Figure 27: North America Graves Disease Market Revenue (Million), by Diagnosis 2024 & 2032
- Figure 28: North America Graves Disease Market Volume (K Unit), by Diagnosis 2024 & 2032
- Figure 29: North America Graves Disease Market Revenue Share (%), by Diagnosis 2024 & 2032
- Figure 30: North America Graves Disease Market Volume Share (%), by Diagnosis 2024 & 2032
- Figure 31: North America Graves Disease Market Revenue (Million), by Treatment 2024 & 2032
- Figure 32: North America Graves Disease Market Volume (K Unit), by Treatment 2024 & 2032
- Figure 33: North America Graves Disease Market Revenue Share (%), by Treatment 2024 & 2032
- Figure 34: North America Graves Disease Market Volume Share (%), by Treatment 2024 & 2032
- Figure 35: North America Graves Disease Market Revenue (Million), by Country 2024 & 2032
- Figure 36: North America Graves Disease Market Volume (K Unit), by Country 2024 & 2032
- Figure 37: North America Graves Disease Market Revenue Share (%), by Country 2024 & 2032
- Figure 38: North America Graves Disease Market Volume Share (%), by Country 2024 & 2032
- Figure 39: Europe Graves Disease Market Revenue (Million), by Diagnosis 2024 & 2032
- Figure 40: Europe Graves Disease Market Volume (K Unit), by Diagnosis 2024 & 2032
- Figure 41: Europe Graves Disease Market Revenue Share (%), by Diagnosis 2024 & 2032
- Figure 42: Europe Graves Disease Market Volume Share (%), by Diagnosis 2024 & 2032
- Figure 43: Europe Graves Disease Market Revenue (Million), by Treatment 2024 & 2032
- Figure 44: Europe Graves Disease Market Volume (K Unit), by Treatment 2024 & 2032
- Figure 45: Europe Graves Disease Market Revenue Share (%), by Treatment 2024 & 2032
- Figure 46: Europe Graves Disease Market Volume Share (%), by Treatment 2024 & 2032
- Figure 47: Europe Graves Disease Market Revenue (Million), by Country 2024 & 2032
- Figure 48: Europe Graves Disease Market Volume (K Unit), by Country 2024 & 2032
- Figure 49: Europe Graves Disease Market Revenue Share (%), by Country 2024 & 2032
- Figure 50: Europe Graves Disease Market Volume Share (%), by Country 2024 & 2032
- Figure 51: Asia Pacific Graves Disease Market Revenue (Million), by Diagnosis 2024 & 2032
- Figure 52: Asia Pacific Graves Disease Market Volume (K Unit), by Diagnosis 2024 & 2032
- Figure 53: Asia Pacific Graves Disease Market Revenue Share (%), by Diagnosis 2024 & 2032
- Figure 54: Asia Pacific Graves Disease Market Volume Share (%), by Diagnosis 2024 & 2032
- Figure 55: Asia Pacific Graves Disease Market Revenue (Million), by Treatment 2024 & 2032
- Figure 56: Asia Pacific Graves Disease Market Volume (K Unit), by Treatment 2024 & 2032
- Figure 57: Asia Pacific Graves Disease Market Revenue Share (%), by Treatment 2024 & 2032
- Figure 58: Asia Pacific Graves Disease Market Volume Share (%), by Treatment 2024 & 2032
- Figure 59: Asia Pacific Graves Disease Market Revenue (Million), by Country 2024 & 2032
- Figure 60: Asia Pacific Graves Disease Market Volume (K Unit), by Country 2024 & 2032
- Figure 61: Asia Pacific Graves Disease Market Revenue Share (%), by Country 2024 & 2032
- Figure 62: Asia Pacific Graves Disease Market Volume Share (%), by Country 2024 & 2032
- Figure 63: Middle East and Africa Graves Disease Market Revenue (Million), by Diagnosis 2024 & 2032
- Figure 64: Middle East and Africa Graves Disease Market Volume (K Unit), by Diagnosis 2024 & 2032
- Figure 65: Middle East and Africa Graves Disease Market Revenue Share (%), by Diagnosis 2024 & 2032
- Figure 66: Middle East and Africa Graves Disease Market Volume Share (%), by Diagnosis 2024 & 2032
- Figure 67: Middle East and Africa Graves Disease Market Revenue (Million), by Treatment 2024 & 2032
- Figure 68: Middle East and Africa Graves Disease Market Volume (K Unit), by Treatment 2024 & 2032
- Figure 69: Middle East and Africa Graves Disease Market Revenue Share (%), by Treatment 2024 & 2032
- Figure 70: Middle East and Africa Graves Disease Market Volume Share (%), by Treatment 2024 & 2032
- Figure 71: Middle East and Africa Graves Disease Market Revenue (Million), by Country 2024 & 2032
- Figure 72: Middle East and Africa Graves Disease Market Volume (K Unit), by Country 2024 & 2032
- Figure 73: Middle East and Africa Graves Disease Market Revenue Share (%), by Country 2024 & 2032
- Figure 74: Middle East and Africa Graves Disease Market Volume Share (%), by Country 2024 & 2032
- Figure 75: South America Graves Disease Market Revenue (Million), by Diagnosis 2024 & 2032
- Figure 76: South America Graves Disease Market Volume (K Unit), by Diagnosis 2024 & 2032
- Figure 77: South America Graves Disease Market Revenue Share (%), by Diagnosis 2024 & 2032
- Figure 78: South America Graves Disease Market Volume Share (%), by Diagnosis 2024 & 2032
- Figure 79: South America Graves Disease Market Revenue (Million), by Treatment 2024 & 2032
- Figure 80: South America Graves Disease Market Volume (K Unit), by Treatment 2024 & 2032
- Figure 81: South America Graves Disease Market Revenue Share (%), by Treatment 2024 & 2032
- Figure 82: South America Graves Disease Market Volume Share (%), by Treatment 2024 & 2032
- Figure 83: South America Graves Disease Market Revenue (Million), by Country 2024 & 2032
- Figure 84: South America Graves Disease Market Volume (K Unit), by Country 2024 & 2032
- Figure 85: South America Graves Disease Market Revenue Share (%), by Country 2024 & 2032
- Figure 86: South America Graves Disease Market Volume Share (%), by Country 2024 & 2032
List of Tables
- Table 1: Global Graves Disease Market Revenue Million Forecast, by Region 2019 & 2032
- Table 2: Global Graves Disease Market Volume K Unit Forecast, by Region 2019 & 2032
- Table 3: Global Graves Disease Market Revenue Million Forecast, by Diagnosis 2019 & 2032
- Table 4: Global Graves Disease Market Volume K Unit Forecast, by Diagnosis 2019 & 2032
- Table 5: Global Graves Disease Market Revenue Million Forecast, by Treatment 2019 & 2032
- Table 6: Global Graves Disease Market Volume K Unit Forecast, by Treatment 2019 & 2032
- Table 7: Global Graves Disease Market Revenue Million Forecast, by Region 2019 & 2032
- Table 8: Global Graves Disease Market Volume K Unit Forecast, by Region 2019 & 2032
- Table 9: Global Graves Disease Market Revenue Million Forecast, by Country 2019 & 2032
- Table 10: Global Graves Disease Market Volume K Unit Forecast, by Country 2019 & 2032
- Table 11: United States Graves Disease Market Revenue (Million) Forecast, by Application 2019 & 2032
- Table 12: United States Graves Disease Market Volume (K Unit) Forecast, by Application 2019 & 2032
- Table 13: Canada Graves Disease Market Revenue (Million) Forecast, by Application 2019 & 2032
- Table 14: Canada Graves Disease Market Volume (K Unit) Forecast, by Application 2019 & 2032
- Table 15: Mexico Graves Disease Market Revenue (Million) Forecast, by Application 2019 & 2032
- Table 16: Mexico Graves Disease Market Volume (K Unit) Forecast, by Application 2019 & 2032
- Table 17: Global Graves Disease Market Revenue Million Forecast, by Country 2019 & 2032
- Table 18: Global Graves Disease Market Volume K Unit Forecast, by Country 2019 & 2032
- Table 19: Germany Graves Disease Market Revenue (Million) Forecast, by Application 2019 & 2032
- Table 20: Germany Graves Disease Market Volume (K Unit) Forecast, by Application 2019 & 2032
- Table 21: United Kingdom Graves Disease Market Revenue (Million) Forecast, by Application 2019 & 2032
- Table 22: United Kingdom Graves Disease Market Volume (K Unit) Forecast, by Application 2019 & 2032
- Table 23: France Graves Disease Market Revenue (Million) Forecast, by Application 2019 & 2032
- Table 24: France Graves Disease Market Volume (K Unit) Forecast, by Application 2019 & 2032
- Table 25: Spain Graves Disease Market Revenue (Million) Forecast, by Application 2019 & 2032
- Table 26: Spain Graves Disease Market Volume (K Unit) Forecast, by Application 2019 & 2032
- Table 27: Italy Graves Disease Market Revenue (Million) Forecast, by Application 2019 & 2032
- Table 28: Italy Graves Disease Market Volume (K Unit) Forecast, by Application 2019 & 2032
- Table 29: Spain Graves Disease Market Revenue (Million) Forecast, by Application 2019 & 2032
- Table 30: Spain Graves Disease Market Volume (K Unit) Forecast, by Application 2019 & 2032
- Table 31: Belgium Graves Disease Market Revenue (Million) Forecast, by Application 2019 & 2032
- Table 32: Belgium Graves Disease Market Volume (K Unit) Forecast, by Application 2019 & 2032
- Table 33: Netherland Graves Disease Market Revenue (Million) Forecast, by Application 2019 & 2032
- Table 34: Netherland Graves Disease Market Volume (K Unit) Forecast, by Application 2019 & 2032
- Table 35: Nordics Graves Disease Market Revenue (Million) Forecast, by Application 2019 & 2032
- Table 36: Nordics Graves Disease Market Volume (K Unit) Forecast, by Application 2019 & 2032
- Table 37: Rest of Europe Graves Disease Market Revenue (Million) Forecast, by Application 2019 & 2032
- Table 38: Rest of Europe Graves Disease Market Volume (K Unit) Forecast, by Application 2019 & 2032
- Table 39: Global Graves Disease Market Revenue Million Forecast, by Country 2019 & 2032
- Table 40: Global Graves Disease Market Volume K Unit Forecast, by Country 2019 & 2032
- Table 41: China Graves Disease Market Revenue (Million) Forecast, by Application 2019 & 2032
- Table 42: China Graves Disease Market Volume (K Unit) Forecast, by Application 2019 & 2032
- Table 43: Japan Graves Disease Market Revenue (Million) Forecast, by Application 2019 & 2032
- Table 44: Japan Graves Disease Market Volume (K Unit) Forecast, by Application 2019 & 2032
- Table 45: India Graves Disease Market Revenue (Million) Forecast, by Application 2019 & 2032
- Table 46: India Graves Disease Market Volume (K Unit) Forecast, by Application 2019 & 2032
- Table 47: South Korea Graves Disease Market Revenue (Million) Forecast, by Application 2019 & 2032
- Table 48: South Korea Graves Disease Market Volume (K Unit) Forecast, by Application 2019 & 2032
- Table 49: Southeast Asia Graves Disease Market Revenue (Million) Forecast, by Application 2019 & 2032
- Table 50: Southeast Asia Graves Disease Market Volume (K Unit) Forecast, by Application 2019 & 2032
- Table 51: Australia Graves Disease Market Revenue (Million) Forecast, by Application 2019 & 2032
- Table 52: Australia Graves Disease Market Volume (K Unit) Forecast, by Application 2019 & 2032
- Table 53: Indonesia Graves Disease Market Revenue (Million) Forecast, by Application 2019 & 2032
- Table 54: Indonesia Graves Disease Market Volume (K Unit) Forecast, by Application 2019 & 2032
- Table 55: Phillipes Graves Disease Market Revenue (Million) Forecast, by Application 2019 & 2032
- Table 56: Phillipes Graves Disease Market Volume (K Unit) Forecast, by Application 2019 & 2032
- Table 57: Singapore Graves Disease Market Revenue (Million) Forecast, by Application 2019 & 2032
- Table 58: Singapore Graves Disease Market Volume (K Unit) Forecast, by Application 2019 & 2032
- Table 59: Thailandc Graves Disease Market Revenue (Million) Forecast, by Application 2019 & 2032
- Table 60: Thailandc Graves Disease Market Volume (K Unit) Forecast, by Application 2019 & 2032
- Table 61: Rest of Asia Pacific Graves Disease Market Revenue (Million) Forecast, by Application 2019 & 2032
- Table 62: Rest of Asia Pacific Graves Disease Market Volume (K Unit) Forecast, by Application 2019 & 2032
- Table 63: Global Graves Disease Market Revenue Million Forecast, by Country 2019 & 2032
- Table 64: Global Graves Disease Market Volume K Unit Forecast, by Country 2019 & 2032
- Table 65: Brazil Graves Disease Market Revenue (Million) Forecast, by Application 2019 & 2032
- Table 66: Brazil Graves Disease Market Volume (K Unit) Forecast, by Application 2019 & 2032
- Table 67: Argentina Graves Disease Market Revenue (Million) Forecast, by Application 2019 & 2032
- Table 68: Argentina Graves Disease Market Volume (K Unit) Forecast, by Application 2019 & 2032
- Table 69: Peru Graves Disease Market Revenue (Million) Forecast, by Application 2019 & 2032
- Table 70: Peru Graves Disease Market Volume (K Unit) Forecast, by Application 2019 & 2032
- Table 71: Chile Graves Disease Market Revenue (Million) Forecast, by Application 2019 & 2032
- Table 72: Chile Graves Disease Market Volume (K Unit) Forecast, by Application 2019 & 2032
- Table 73: Colombia Graves Disease Market Revenue (Million) Forecast, by Application 2019 & 2032
- Table 74: Colombia Graves Disease Market Volume (K Unit) Forecast, by Application 2019 & 2032
- Table 75: Ecuador Graves Disease Market Revenue (Million) Forecast, by Application 2019 & 2032
- Table 76: Ecuador Graves Disease Market Volume (K Unit) Forecast, by Application 2019 & 2032
- Table 77: Venezuela Graves Disease Market Revenue (Million) Forecast, by Application 2019 & 2032
- Table 78: Venezuela Graves Disease Market Volume (K Unit) Forecast, by Application 2019 & 2032
- Table 79: Rest of South America Graves Disease Market Revenue (Million) Forecast, by Application 2019 & 2032
- Table 80: Rest of South America Graves Disease Market Volume (K Unit) Forecast, by Application 2019 & 2032
- Table 81: Global Graves Disease Market Revenue Million Forecast, by Country 2019 & 2032
- Table 82: Global Graves Disease Market Volume K Unit Forecast, by Country 2019 & 2032
- Table 83: United States Graves Disease Market Revenue (Million) Forecast, by Application 2019 & 2032
- Table 84: United States Graves Disease Market Volume (K Unit) Forecast, by Application 2019 & 2032
- Table 85: Canada Graves Disease Market Revenue (Million) Forecast, by Application 2019 & 2032
- Table 86: Canada Graves Disease Market Volume (K Unit) Forecast, by Application 2019 & 2032
- Table 87: Mexico Graves Disease Market Revenue (Million) Forecast, by Application 2019 & 2032
- Table 88: Mexico Graves Disease Market Volume (K Unit) Forecast, by Application 2019 & 2032
- Table 89: Global Graves Disease Market Revenue Million Forecast, by Country 2019 & 2032
- Table 90: Global Graves Disease Market Volume K Unit Forecast, by Country 2019 & 2032
- Table 91: United Arab Emirates Graves Disease Market Revenue (Million) Forecast, by Application 2019 & 2032
- Table 92: United Arab Emirates Graves Disease Market Volume (K Unit) Forecast, by Application 2019 & 2032
- Table 93: Saudi Arabia Graves Disease Market Revenue (Million) Forecast, by Application 2019 & 2032
- Table 94: Saudi Arabia Graves Disease Market Volume (K Unit) Forecast, by Application 2019 & 2032
- Table 95: South Africa Graves Disease Market Revenue (Million) Forecast, by Application 2019 & 2032
- Table 96: South Africa Graves Disease Market Volume (K Unit) Forecast, by Application 2019 & 2032
- Table 97: Rest of Middle East and Africa Graves Disease Market Revenue (Million) Forecast, by Application 2019 & 2032
- Table 98: Rest of Middle East and Africa Graves Disease Market Volume (K Unit) Forecast, by Application 2019 & 2032
- Table 99: Global Graves Disease Market Revenue Million Forecast, by Diagnosis 2019 & 2032
- Table 100: Global Graves Disease Market Volume K Unit Forecast, by Diagnosis 2019 & 2032
- Table 101: Global Graves Disease Market Revenue Million Forecast, by Treatment 2019 & 2032
- Table 102: Global Graves Disease Market Volume K Unit Forecast, by Treatment 2019 & 2032
- Table 103: Global Graves Disease Market Revenue Million Forecast, by Country 2019 & 2032
- Table 104: Global Graves Disease Market Volume K Unit Forecast, by Country 2019 & 2032
- Table 105: Global Graves Disease Market Revenue Million Forecast, by Diagnosis 2019 & 2032
- Table 106: Global Graves Disease Market Volume K Unit Forecast, by Diagnosis 2019 & 2032
- Table 107: Global Graves Disease Market Revenue Million Forecast, by Treatment 2019 & 2032
- Table 108: Global Graves Disease Market Volume K Unit Forecast, by Treatment 2019 & 2032
- Table 109: Global Graves Disease Market Revenue Million Forecast, by Country 2019 & 2032
- Table 110: Global Graves Disease Market Volume K Unit Forecast, by Country 2019 & 2032
- Table 111: Global Graves Disease Market Revenue Million Forecast, by Diagnosis 2019 & 2032
- Table 112: Global Graves Disease Market Volume K Unit Forecast, by Diagnosis 2019 & 2032
- Table 113: Global Graves Disease Market Revenue Million Forecast, by Treatment 2019 & 2032
- Table 114: Global Graves Disease Market Volume K Unit Forecast, by Treatment 2019 & 2032
- Table 115: Global Graves Disease Market Revenue Million Forecast, by Country 2019 & 2032
- Table 116: Global Graves Disease Market Volume K Unit Forecast, by Country 2019 & 2032
- Table 117: Global Graves Disease Market Revenue Million Forecast, by Diagnosis 2019 & 2032
- Table 118: Global Graves Disease Market Volume K Unit Forecast, by Diagnosis 2019 & 2032
- Table 119: Global Graves Disease Market Revenue Million Forecast, by Treatment 2019 & 2032
- Table 120: Global Graves Disease Market Volume K Unit Forecast, by Treatment 2019 & 2032
- Table 121: Global Graves Disease Market Revenue Million Forecast, by Country 2019 & 2032
- Table 122: Global Graves Disease Market Volume K Unit Forecast, by Country 2019 & 2032
- Table 123: Global Graves Disease Market Revenue Million Forecast, by Diagnosis 2019 & 2032
- Table 124: Global Graves Disease Market Volume K Unit Forecast, by Diagnosis 2019 & 2032
- Table 125: Global Graves Disease Market Revenue Million Forecast, by Treatment 2019 & 2032
- Table 126: Global Graves Disease Market Volume K Unit Forecast, by Treatment 2019 & 2032
- Table 127: Global Graves Disease Market Revenue Million Forecast, by Country 2019 & 2032
- Table 128: Global Graves Disease Market Volume K Unit Forecast, by Country 2019 & 2032
Frequently Asked Questions
1. What is the projected Compound Annual Growth Rate (CAGR) of the Graves Disease Market?
The projected CAGR is approximately 4.20%.
2. Which companies are prominent players in the Graves Disease Market?
Key companies in the market include Pfizer, Novartis, F Hoffmann-La Roche Ltd, Institute of Isotopes Co Ltd, Thermo Fisher Scientific Inc, Horizon Therapeutics Ireland DAC, Abbott, Jubilant Pharma Holdings Inc, bioMerieux SA, Sun Pharma.
3. What are the main segments of the Graves Disease Market?
The market segments include Diagnosis, Treatment.
4. Can you provide details about the market size?
The market size is estimated to be USD XX Million as of 2022.
5. What are some drivers contributing to market growth?
Increasing Prevalance of Hyperthyroidism; Increasing Funding for Rare Diseases.
6. What are the notable trends driving market growth?
Anti-Thyroid Medication Expected to Dominate the Market.
7. Are there any restraints impacting market growth?
High Cost of Treatment.
8. Can you provide examples of recent developments in the market?
In June 2022, Sling Therapeutics, Inc., a biopharmaceutical company launched a USD 35 million Series A financing led by TPG's The Rise Fund. The funds will support a Phase 2b clinical trial evaluating the company's investigational drug, linsitinib, for the treatment of thyroid eye disease (TED). TED predominantly affects women, and most frequently affects people with hyperthyroidism due to Graves' disease.
9. What pricing options are available for accessing the report?
Pricing options include single-user, multi-user, and enterprise licenses priced at USD 4750, USD 5250, and USD 8750 respectively.
10. Is the market size provided in terms of value or volume?
The market size is provided in terms of value, measured in Million and volume, measured in K Unit.
11. Are there any specific market keywords associated with the report?
Yes, the market keyword associated with the report is "Graves Disease Market," which aids in identifying and referencing the specific market segment covered.
12. How do I determine which pricing option suits my needs best?
The pricing options vary based on user requirements and access needs. Individual users may opt for single-user licenses, while businesses requiring broader access may choose multi-user or enterprise licenses for cost-effective access to the report.
13. Are there any additional resources or data provided in the Graves Disease Market report?
While the report offers comprehensive insights, it's advisable to review the specific contents or supplementary materials provided to ascertain if additional resources or data are available.
14. How can I stay updated on further developments or reports in the Graves Disease Market?
To stay informed about further developments, trends, and reports in the Graves Disease Market, consider subscribing to industry newsletters, following relevant companies and organizations, or regularly checking reputable industry news sources and publications.
Methodology
Step 1 - Identification of Relevant Samples Size from Population Database


Step 2 - Approaches for Defining Global Market Size (Value, Volume* & Price*)

Note*: In applicable scenarios
Step 3 - Data Sources
Primary Research
- Web Analytics
- Survey Reports
- Research Institute
- Latest Research Reports
- Opinion Leaders
Secondary Research
- Annual Reports
- White Paper
- Latest Press Release
- Industry Association
- Paid Database
- Investor Presentations

Step 4 - Data Triangulation
Involves using different sources of information in order to increase the validity of a study
These sources are likely to be stakeholders in a program - participants, other researchers, program staff, other community members, and so on.
Then we put all data in single framework & apply various statistical tools to find out the dynamic on the market.
During the analysis stage, feedback from the stakeholder groups would be compared to determine areas of agreement as well as areas of divergence


