
Key Insights
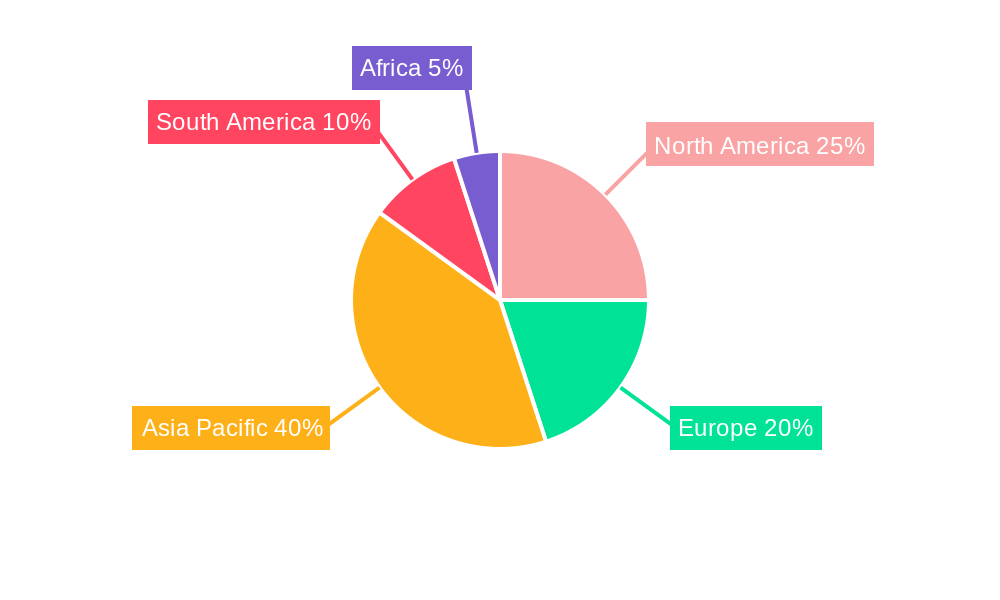
The global glyphosate market, valued at $9.14 billion in 2025, is projected to experience robust growth, driven by the increasing demand for high-yield crops and the persistent need for effective weed control in agriculture. A compound annual growth rate (CAGR) of 7.49% from 2025 to 2033 indicates a significant expansion, reaching an estimated value exceeding $17 billion by 2033. This growth is fueled by several factors. The rising global population necessitates increased food production, leading to higher herbicide usage. Furthermore, the adoption of genetically modified (GM) crops tolerant to glyphosate contributes significantly to market expansion. However, growing concerns regarding the environmental impact and potential health risks associated with glyphosate are acting as a significant restraint, prompting stricter regulations and driving innovation in alternative weed management solutions. The market is segmented by crop type (GM crops exhibiting higher adoption than non-GM crops), and application (grains and cereals, pulses and oilseeds, fruits and vegetables, and commercial crops dominating market share). Major players like FMC Corporation, Bayer Cropscience, and Syngenta are constantly innovating to enhance product efficacy and mitigate environmental concerns, while also navigating increasingly stringent regulatory landscapes. The Asia-Pacific region, driven by the expanding agricultural sector in countries like India and China, is expected to witness the most significant growth within the forecast period.
The competitive landscape is characterized by intense rivalry among established multinational corporations and regional players. Strategic partnerships, mergers and acquisitions, and the development of new formulations are key competitive strategies employed to gain market share. While the demand for glyphosate remains strong, the industry is facing increasing pressure to implement sustainable agricultural practices and develop more environmentally friendly alternatives. This necessitates a shift towards precision application techniques and integrated pest management strategies to minimize environmental impact while maintaining crop yields. The long-term outlook for the glyphosate market remains positive but contingent on addressing the environmental and health concerns associated with its use while continuing to adapt to evolving regulatory frameworks and consumer preferences.

Glyphosate Market: A Comprehensive Market Report (2019-2033)
This comprehensive report provides a detailed analysis of the Glyphosate Market, encompassing market dynamics, growth trends, regional segmentation, product landscape, key players, and future outlook. The study period spans from 2019 to 2033, with 2025 serving as the base and estimated year. The report delves into the parent market of agricultural chemicals and the child market of herbicides, offering valuable insights for industry professionals, investors, and stakeholders. The global market size is projected to reach xx Million units by 2033.
Glyphosate Market Dynamics & Structure
The Glyphosate market is characterized by moderate concentration, with key players holding significant market share. Technological innovation, particularly in herbicide tolerance traits and formulation advancements, is a crucial driver. Stringent regulatory frameworks and evolving environmental concerns pose significant challenges. The market witnesses competitive pressure from alternative weed control methods and ongoing M&A activity shapes the competitive landscape.
- Market Concentration: The top 5 players account for approximately xx% of the global market share in 2025.
- Technological Innovation: Focus on developing glyphosate-tolerant crops and more effective formulations drives market growth.
- Regulatory Landscape: Varying regulations across different geographies create complexities for manufacturers and distributors.
- Competitive Substitutes: Biopesticides and other herbicides pose a competitive threat, albeit limited market penetration at present (xx% in 2025).
- End-User Demographics: Large-scale commercial farms are the dominant consumers, while smallholder farms represent a growing segment.
- M&A Trends: The past five years have witnessed xx M&A deals, primarily focused on strengthening portfolios and expanding geographical reach.
Glyphosate Market Growth Trends & Insights
The Glyphosate market experienced significant growth during the historical period (2019-2024), primarily driven by the increasing adoption of glyphosate-tolerant crops and rising demand from the agricultural sector. The market is projected to witness a CAGR of xx% during the forecast period (2025-2033). Factors influencing growth include increasing agricultural production, rising global population, and the continuous adoption of efficient farming techniques. However, growing environmental concerns and regulatory restrictions are expected to impact market growth to some extent. Market penetration in developing regions remains significant, with room for further expansion. Technological disruptions, such as the development of more effective and environmentally friendly formulations, will shape future market dynamics. Consumer behavior shifts toward sustainable agricultural practices will influence the demand for glyphosate-based herbicides.

Dominant Regions, Countries, or Segments in Glyphosate Market
North America and South America currently dominate the Glyphosate market, driven by large-scale agricultural production and the widespread adoption of glyphosate-tolerant crops (GM crops accounting for xx% of market in 2025). The Grains and Cereals application segment holds the largest market share (xx%), followed by Pulses and Oilseeds.
- Key Drivers for North America: High adoption of GM crops, efficient agricultural practices, and favorable government policies.
- Key Drivers for South America: Extensive soybean and corn production, reliance on glyphosate-based weed management, and robust agricultural infrastructure.
- Growth Potential in Asia-Pacific: Rapid growth in agricultural output and increasing adoption of modern farming techniques create substantial growth opportunities.
- Growth Potential of Non-GM Crops Segment: The Non-GM Crops segment is expected to show a CAGR of xx% due to increasing demand from organic farming and environmentally conscious consumers.
Glyphosate Market Product Landscape
The Glyphosate market offers a range of formulations, including isopropylamine salts, potassium salts, and others, each tailored to specific crop types and application methods. Recent innovations focus on improving efficacy, reducing environmental impact, and enhancing user-friendliness. Companies are investing in developing low-drift formulations and targeted application technologies to mitigate environmental concerns and increase efficiency.
Key Drivers, Barriers & Challenges in Glyphosate Market
Key Drivers:
- Increasing demand for food production globally.
- Widespread adoption of glyphosate-resistant crops.
- Cost-effectiveness compared to other herbicides.
Key Challenges:
- Growing environmental concerns and regulatory restrictions on glyphosate use. This has led to an xx% decrease in market growth in certain regions between 2021 and 2022.
- Emergence of glyphosate-resistant weeds, necessitating the development of alternative weed management strategies.
- Price fluctuations due to raw material costs and global supply chain disruptions.
Emerging Opportunities in Glyphosate Market
- Development of innovative formulations that minimize environmental impact.
- Expansion into untapped markets in developing countries with high agricultural potential.
- Growing demand for organic and sustainable farming practices presents opportunities for eco-friendly glyphosate alternatives.
Growth Accelerators in the Glyphosate Market Industry
Strategic partnerships between herbicide manufacturers and seed companies are accelerating market growth, particularly in developing glyphosate-tolerant crop varieties. Technological advancements, such as precision application technologies and improved formulations, are enhancing efficiency and sustainability, fueling further expansion. Market expansion strategies into developing countries with high agricultural potential represent a significant growth driver.
Key Players Shaping the Glyphosate Market Market
- FMC Corporation
- Bayer Cropscience AG
- Dow AgroScience
- DuPont
- Adama Agricultural Solutions Ltd
- Nufarm Limited
- Zhejiang Xinan Chemical Industrial Group Company Ltd
- UPL Limited
- Syngenta International
- BASF SE
Notable Milestones in Glyphosate Market Sector
- January 2021: Syngenta launched Kesuda, a new glyphosate formulation in China, addressing limitations of conventional products.
- August 2022: BASF and Corteva Agriscience collaborated on developing soybean weed control solutions, including glyphosate-tolerant traits.
In-Depth Glyphosate Market Market Outlook
The Glyphosate market is poised for continued growth, albeit at a moderated pace, driven by the increasing global demand for food and the continued use of glyphosate-tolerant crops. Strategic partnerships, technological innovations, and expansion into new markets will play a critical role in shaping the market's future. However, sustained focus on addressing environmental concerns and regulatory challenges will be crucial for sustainable long-term growth. The market is expected to show a CAGR of xx% during the forecast period.
Glyphosate Market Segmentation
-
1. Type
- 1.1. GM Crops
- 1.2. Non-GM Crops
-
2. Application
- 2.1. Grains and Cereals
- 2.2. Pulses and Oilseeds
- 2.3. Fruits and Vegetables
- 2.4. Commercial Crops
- 2.5. Other Crop Types
-
3. Type
- 3.1. GM Crops
- 3.2. Non-GM Crops
-
4. Application
- 4.1. Grains and Cereals
- 4.2. Pulses and Oilseeds
- 4.3. Fruits and Vegetables
- 4.4. Commercial Crops
- 4.5. Other Crop Types
Glyphosate Market Segmentation By Geography
-
1. North America
- 1.1. United States
- 1.2. Canada
- 1.3. Mexico
- 1.4. Rest of North America
-
2. Europe
- 2.1. Spain
- 2.2. Italy
- 2.3. France
- 2.4. Germany
- 2.5. Russia
- 2.6. United Kingdom
- 2.7. Rest of Europe
-
3. Asia Pacific
- 3.1. India
- 3.2. China
- 3.3. Japan
- 3.4. Australia
- 3.5. Rest of Asia Pacific
-
4. South America
- 4.1. Brazil
- 4.2. Argentina
- 4.3. Rest of South America
-
5. Africa
- 5.1. South Africa
- 5.2. Rest of Africa
Glyphosate Market REPORT HIGHLIGHTS
| Aspects | Details |
|---|---|
| Study Period | 2019-2033 |
| Base Year | 2024 |
| Estimated Year | 2025 |
| Forecast Period | 2025-2033 |
| Historical Period | 2019-2024 |
| Growth Rate | CAGR of 7.49% from 2019-2033 |
| Segmentation |
|
Table of Contents
- 1. Introduction
- 1.1. Research Scope
- 1.2. Market Segmentation
- 1.3. Research Methodology
- 1.4. Definitions and Assumptions
- 2. Executive Summary
- 2.1. Introduction
- 3. Market Dynamics
- 3.1. Introduction
- 3.2. Market Drivers
- 3.2.1. Seed Treatment As A Solution To Enhance Yield; Growing Awareness For Seed Treatment Among The Farmers; Rising Trend Of Organic Farming
- 3.3. Market Restrains
- 3.3.1. Limitations Across Farm-Level Seed Treatment; Rising Environmental Concerns
- 3.4. Market Trends
- 3.4.1. Commercialization of Genetically Engineered Herbicide-tolerant Crops
- 4. Market Factor Analysis
- 4.1. Porters Five Forces
- 4.2. Supply/Value Chain
- 4.3. PESTEL analysis
- 4.4. Market Entropy
- 4.5. Patent/Trademark Analysis
- 5. Global Glyphosate Market Analysis, Insights and Forecast, 2019-2031
- 5.1. Market Analysis, Insights and Forecast - by Type
- 5.1.1. GM Crops
- 5.1.2. Non-GM Crops
- 5.2. Market Analysis, Insights and Forecast - by Application
- 5.2.1. Grains and Cereals
- 5.2.2. Pulses and Oilseeds
- 5.2.3. Fruits and Vegetables
- 5.2.4. Commercial Crops
- 5.2.5. Other Crop Types
- 5.3. Market Analysis, Insights and Forecast - by Type
- 5.3.1. GM Crops
- 5.3.2. Non-GM Crops
- 5.4. Market Analysis, Insights and Forecast - by Application
- 5.4.1. Grains and Cereals
- 5.4.2. Pulses and Oilseeds
- 5.4.3. Fruits and Vegetables
- 5.4.4. Commercial Crops
- 5.4.5. Other Crop Types
- 5.5. Market Analysis, Insights and Forecast - by Region
- 5.5.1. North America
- 5.5.2. Europe
- 5.5.3. Asia Pacific
- 5.5.4. South America
- 5.5.5. Africa
- 5.1. Market Analysis, Insights and Forecast - by Type
- 6. North America Glyphosate Market Analysis, Insights and Forecast, 2019-2031
- 6.1. Market Analysis, Insights and Forecast - by Type
- 6.1.1. GM Crops
- 6.1.2. Non-GM Crops
- 6.2. Market Analysis, Insights and Forecast - by Application
- 6.2.1. Grains and Cereals
- 6.2.2. Pulses and Oilseeds
- 6.2.3. Fruits and Vegetables
- 6.2.4. Commercial Crops
- 6.2.5. Other Crop Types
- 6.3. Market Analysis, Insights and Forecast - by Type
- 6.3.1. GM Crops
- 6.3.2. Non-GM Crops
- 6.4. Market Analysis, Insights and Forecast - by Application
- 6.4.1. Grains and Cereals
- 6.4.2. Pulses and Oilseeds
- 6.4.3. Fruits and Vegetables
- 6.4.4. Commercial Crops
- 6.4.5. Other Crop Types
- 6.1. Market Analysis, Insights and Forecast - by Type
- 7. Europe Glyphosate Market Analysis, Insights and Forecast, 2019-2031
- 7.1. Market Analysis, Insights and Forecast - by Type
- 7.1.1. GM Crops
- 7.1.2. Non-GM Crops
- 7.2. Market Analysis, Insights and Forecast - by Application
- 7.2.1. Grains and Cereals
- 7.2.2. Pulses and Oilseeds
- 7.2.3. Fruits and Vegetables
- 7.2.4. Commercial Crops
- 7.2.5. Other Crop Types
- 7.3. Market Analysis, Insights and Forecast - by Type
- 7.3.1. GM Crops
- 7.3.2. Non-GM Crops
- 7.4. Market Analysis, Insights and Forecast - by Application
- 7.4.1. Grains and Cereals
- 7.4.2. Pulses and Oilseeds
- 7.4.3. Fruits and Vegetables
- 7.4.4. Commercial Crops
- 7.4.5. Other Crop Types
- 7.1. Market Analysis, Insights and Forecast - by Type
- 8. Asia Pacific Glyphosate Market Analysis, Insights and Forecast, 2019-2031
- 8.1. Market Analysis, Insights and Forecast - by Type
- 8.1.1. GM Crops
- 8.1.2. Non-GM Crops
- 8.2. Market Analysis, Insights and Forecast - by Application
- 8.2.1. Grains and Cereals
- 8.2.2. Pulses and Oilseeds
- 8.2.3. Fruits and Vegetables
- 8.2.4. Commercial Crops
- 8.2.5. Other Crop Types
- 8.3. Market Analysis, Insights and Forecast - by Type
- 8.3.1. GM Crops
- 8.3.2. Non-GM Crops
- 8.4. Market Analysis, Insights and Forecast - by Application
- 8.4.1. Grains and Cereals
- 8.4.2. Pulses and Oilseeds
- 8.4.3. Fruits and Vegetables
- 8.4.4. Commercial Crops
- 8.4.5. Other Crop Types
- 8.1. Market Analysis, Insights and Forecast - by Type
- 9. South America Glyphosate Market Analysis, Insights and Forecast, 2019-2031
- 9.1. Market Analysis, Insights and Forecast - by Type
- 9.1.1. GM Crops
- 9.1.2. Non-GM Crops
- 9.2. Market Analysis, Insights and Forecast - by Application
- 9.2.1. Grains and Cereals
- 9.2.2. Pulses and Oilseeds
- 9.2.3. Fruits and Vegetables
- 9.2.4. Commercial Crops
- 9.2.5. Other Crop Types
- 9.3. Market Analysis, Insights and Forecast - by Type
- 9.3.1. GM Crops
- 9.3.2. Non-GM Crops
- 9.4. Market Analysis, Insights and Forecast - by Application
- 9.4.1. Grains and Cereals
- 9.4.2. Pulses and Oilseeds
- 9.4.3. Fruits and Vegetables
- 9.4.4. Commercial Crops
- 9.4.5. Other Crop Types
- 9.1. Market Analysis, Insights and Forecast - by Type
- 10. Africa Glyphosate Market Analysis, Insights and Forecast, 2019-2031
- 10.1. Market Analysis, Insights and Forecast - by Type
- 10.1.1. GM Crops
- 10.1.2. Non-GM Crops
- 10.2. Market Analysis, Insights and Forecast - by Application
- 10.2.1. Grains and Cereals
- 10.2.2. Pulses and Oilseeds
- 10.2.3. Fruits and Vegetables
- 10.2.4. Commercial Crops
- 10.2.5. Other Crop Types
- 10.3. Market Analysis, Insights and Forecast - by Type
- 10.3.1. GM Crops
- 10.3.2. Non-GM Crops
- 10.4. Market Analysis, Insights and Forecast - by Application
- 10.4.1. Grains and Cereals
- 10.4.2. Pulses and Oilseeds
- 10.4.3. Fruits and Vegetables
- 10.4.4. Commercial Crops
- 10.4.5. Other Crop Types
- 10.1. Market Analysis, Insights and Forecast - by Type
- 11. North America Glyphosate Market Analysis, Insights and Forecast, 2019-2031
- 11.1. Market Analysis, Insights and Forecast - By Country/Sub-region
- 11.1.1 United States
- 11.1.2 Canada
- 11.1.3 Mexico
- 11.1.4 Rest of North America
- 12. Europe Glyphosate Market Analysis, Insights and Forecast, 2019-2031
- 12.1. Market Analysis, Insights and Forecast - By Country/Sub-region
- 12.1.1 Spain
- 12.1.2 Italy
- 12.1.3 France
- 12.1.4 Germany
- 12.1.5 Russia
- 12.1.6 United Kingdom
- 12.1.7 Rest of Europe
- 13. Asia Pacific Glyphosate Market Analysis, Insights and Forecast, 2019-2031
- 13.1. Market Analysis, Insights and Forecast - By Country/Sub-region
- 13.1.1 India
- 13.1.2 China
- 13.1.3 Japan
- 13.1.4 Australia
- 13.1.5 Rest of Asia Pacific
- 14. South America Glyphosate Market Analysis, Insights and Forecast, 2019-2031
- 14.1. Market Analysis, Insights and Forecast - By Country/Sub-region
- 14.1.1 Brazil
- 14.1.2 Argentina
- 14.1.3 Rest of South America
- 15. Africa Glyphosate Market Analysis, Insights and Forecast, 2019-2031
- 15.1. Market Analysis, Insights and Forecast - By Country/Sub-region
- 15.1.1 South Africa
- 15.1.2 Rest of Africa
- 16. Competitive Analysis
- 16.1. Global Market Share Analysis 2024
- 16.2. Company Profiles
- 16.2.1 FMC Corporation
- 16.2.1.1. Overview
- 16.2.1.2. Products
- 16.2.1.3. SWOT Analysis
- 16.2.1.4. Recent Developments
- 16.2.1.5. Financials (Based on Availability)
- 16.2.2 Bayer Cropscience AG
- 16.2.2.1. Overview
- 16.2.2.2. Products
- 16.2.2.3. SWOT Analysis
- 16.2.2.4. Recent Developments
- 16.2.2.5. Financials (Based on Availability)
- 16.2.3 Dow AgroScience
- 16.2.3.1. Overview
- 16.2.3.2. Products
- 16.2.3.3. SWOT Analysis
- 16.2.3.4. Recent Developments
- 16.2.3.5. Financials (Based on Availability)
- 16.2.4 DuPont
- 16.2.4.1. Overview
- 16.2.4.2. Products
- 16.2.4.3. SWOT Analysis
- 16.2.4.4. Recent Developments
- 16.2.4.5. Financials (Based on Availability)
- 16.2.5 Adama Agricultural Solutions Ltd
- 16.2.5.1. Overview
- 16.2.5.2. Products
- 16.2.5.3. SWOT Analysis
- 16.2.5.4. Recent Developments
- 16.2.5.5. Financials (Based on Availability)
- 16.2.6 Nufarm Limited
- 16.2.6.1. Overview
- 16.2.6.2. Products
- 16.2.6.3. SWOT Analysis
- 16.2.6.4. Recent Developments
- 16.2.6.5. Financials (Based on Availability)
- 16.2.7 Zhejiang Xinan Chemical Industrial Group Company Ltd
- 16.2.7.1. Overview
- 16.2.7.2. Products
- 16.2.7.3. SWOT Analysis
- 16.2.7.4. Recent Developments
- 16.2.7.5. Financials (Based on Availability)
- 16.2.8 UPL Limited
- 16.2.8.1. Overview
- 16.2.8.2. Products
- 16.2.8.3. SWOT Analysis
- 16.2.8.4. Recent Developments
- 16.2.8.5. Financials (Based on Availability)
- 16.2.9 Syngenta International
- 16.2.9.1. Overview
- 16.2.9.2. Products
- 16.2.9.3. SWOT Analysis
- 16.2.9.4. Recent Developments
- 16.2.9.5. Financials (Based on Availability)
- 16.2.10 BASF SE
- 16.2.10.1. Overview
- 16.2.10.2. Products
- 16.2.10.3. SWOT Analysis
- 16.2.10.4. Recent Developments
- 16.2.10.5. Financials (Based on Availability)
- 16.2.1 FMC Corporation
List of Figures
- Figure 1: Global Glyphosate Market Revenue Breakdown (Million, %) by Region 2024 & 2032
- Figure 2: Global Glyphosate Market Volume Breakdown (Kiloton, %) by Region 2024 & 2032
- Figure 3: North America Glyphosate Market Revenue (Million), by Country 2024 & 2032
- Figure 4: North America Glyphosate Market Volume (Kiloton), by Country 2024 & 2032
- Figure 5: North America Glyphosate Market Revenue Share (%), by Country 2024 & 2032
- Figure 6: North America Glyphosate Market Volume Share (%), by Country 2024 & 2032
- Figure 7: Europe Glyphosate Market Revenue (Million), by Country 2024 & 2032
- Figure 8: Europe Glyphosate Market Volume (Kiloton), by Country 2024 & 2032
- Figure 9: Europe Glyphosate Market Revenue Share (%), by Country 2024 & 2032
- Figure 10: Europe Glyphosate Market Volume Share (%), by Country 2024 & 2032
- Figure 11: Asia Pacific Glyphosate Market Revenue (Million), by Country 2024 & 2032
- Figure 12: Asia Pacific Glyphosate Market Volume (Kiloton), by Country 2024 & 2032
- Figure 13: Asia Pacific Glyphosate Market Revenue Share (%), by Country 2024 & 2032
- Figure 14: Asia Pacific Glyphosate Market Volume Share (%), by Country 2024 & 2032
- Figure 15: South America Glyphosate Market Revenue (Million), by Country 2024 & 2032
- Figure 16: South America Glyphosate Market Volume (Kiloton), by Country 2024 & 2032
- Figure 17: South America Glyphosate Market Revenue Share (%), by Country 2024 & 2032
- Figure 18: South America Glyphosate Market Volume Share (%), by Country 2024 & 2032
- Figure 19: Africa Glyphosate Market Revenue (Million), by Country 2024 & 2032
- Figure 20: Africa Glyphosate Market Volume (Kiloton), by Country 2024 & 2032
- Figure 21: Africa Glyphosate Market Revenue Share (%), by Country 2024 & 2032
- Figure 22: Africa Glyphosate Market Volume Share (%), by Country 2024 & 2032
- Figure 23: North America Glyphosate Market Revenue (Million), by Type 2024 & 2032
- Figure 24: North America Glyphosate Market Volume (Kiloton), by Type 2024 & 2032
- Figure 25: North America Glyphosate Market Revenue Share (%), by Type 2024 & 2032
- Figure 26: North America Glyphosate Market Volume Share (%), by Type 2024 & 2032
- Figure 27: North America Glyphosate Market Revenue (Million), by Application 2024 & 2032
- Figure 28: North America Glyphosate Market Volume (Kiloton), by Application 2024 & 2032
- Figure 29: North America Glyphosate Market Revenue Share (%), by Application 2024 & 2032
- Figure 30: North America Glyphosate Market Volume Share (%), by Application 2024 & 2032
- Figure 31: North America Glyphosate Market Revenue (Million), by Type 2024 & 2032
- Figure 32: North America Glyphosate Market Volume (Kiloton), by Type 2024 & 2032
- Figure 33: North America Glyphosate Market Revenue Share (%), by Type 2024 & 2032
- Figure 34: North America Glyphosate Market Volume Share (%), by Type 2024 & 2032
- Figure 35: North America Glyphosate Market Revenue (Million), by Application 2024 & 2032
- Figure 36: North America Glyphosate Market Volume (Kiloton), by Application 2024 & 2032
- Figure 37: North America Glyphosate Market Revenue Share (%), by Application 2024 & 2032
- Figure 38: North America Glyphosate Market Volume Share (%), by Application 2024 & 2032
- Figure 39: North America Glyphosate Market Revenue (Million), by Country 2024 & 2032
- Figure 40: North America Glyphosate Market Volume (Kiloton), by Country 2024 & 2032
- Figure 41: North America Glyphosate Market Revenue Share (%), by Country 2024 & 2032
- Figure 42: North America Glyphosate Market Volume Share (%), by Country 2024 & 2032
- Figure 43: Europe Glyphosate Market Revenue (Million), by Type 2024 & 2032
- Figure 44: Europe Glyphosate Market Volume (Kiloton), by Type 2024 & 2032
- Figure 45: Europe Glyphosate Market Revenue Share (%), by Type 2024 & 2032
- Figure 46: Europe Glyphosate Market Volume Share (%), by Type 2024 & 2032
- Figure 47: Europe Glyphosate Market Revenue (Million), by Application 2024 & 2032
- Figure 48: Europe Glyphosate Market Volume (Kiloton), by Application 2024 & 2032
- Figure 49: Europe Glyphosate Market Revenue Share (%), by Application 2024 & 2032
- Figure 50: Europe Glyphosate Market Volume Share (%), by Application 2024 & 2032
- Figure 51: Europe Glyphosate Market Revenue (Million), by Type 2024 & 2032
- Figure 52: Europe Glyphosate Market Volume (Kiloton), by Type 2024 & 2032
- Figure 53: Europe Glyphosate Market Revenue Share (%), by Type 2024 & 2032
- Figure 54: Europe Glyphosate Market Volume Share (%), by Type 2024 & 2032
- Figure 55: Europe Glyphosate Market Revenue (Million), by Application 2024 & 2032
- Figure 56: Europe Glyphosate Market Volume (Kiloton), by Application 2024 & 2032
- Figure 57: Europe Glyphosate Market Revenue Share (%), by Application 2024 & 2032
- Figure 58: Europe Glyphosate Market Volume Share (%), by Application 2024 & 2032
- Figure 59: Europe Glyphosate Market Revenue (Million), by Country 2024 & 2032
- Figure 60: Europe Glyphosate Market Volume (Kiloton), by Country 2024 & 2032
- Figure 61: Europe Glyphosate Market Revenue Share (%), by Country 2024 & 2032
- Figure 62: Europe Glyphosate Market Volume Share (%), by Country 2024 & 2032
- Figure 63: Asia Pacific Glyphosate Market Revenue (Million), by Type 2024 & 2032
- Figure 64: Asia Pacific Glyphosate Market Volume (Kiloton), by Type 2024 & 2032
- Figure 65: Asia Pacific Glyphosate Market Revenue Share (%), by Type 2024 & 2032
- Figure 66: Asia Pacific Glyphosate Market Volume Share (%), by Type 2024 & 2032
- Figure 67: Asia Pacific Glyphosate Market Revenue (Million), by Application 2024 & 2032
- Figure 68: Asia Pacific Glyphosate Market Volume (Kiloton), by Application 2024 & 2032
- Figure 69: Asia Pacific Glyphosate Market Revenue Share (%), by Application 2024 & 2032
- Figure 70: Asia Pacific Glyphosate Market Volume Share (%), by Application 2024 & 2032
- Figure 71: Asia Pacific Glyphosate Market Revenue (Million), by Type 2024 & 2032
- Figure 72: Asia Pacific Glyphosate Market Volume (Kiloton), by Type 2024 & 2032
- Figure 73: Asia Pacific Glyphosate Market Revenue Share (%), by Type 2024 & 2032
- Figure 74: Asia Pacific Glyphosate Market Volume Share (%), by Type 2024 & 2032
- Figure 75: Asia Pacific Glyphosate Market Revenue (Million), by Application 2024 & 2032
- Figure 76: Asia Pacific Glyphosate Market Volume (Kiloton), by Application 2024 & 2032
- Figure 77: Asia Pacific Glyphosate Market Revenue Share (%), by Application 2024 & 2032
- Figure 78: Asia Pacific Glyphosate Market Volume Share (%), by Application 2024 & 2032
- Figure 79: Asia Pacific Glyphosate Market Revenue (Million), by Country 2024 & 2032
- Figure 80: Asia Pacific Glyphosate Market Volume (Kiloton), by Country 2024 & 2032
- Figure 81: Asia Pacific Glyphosate Market Revenue Share (%), by Country 2024 & 2032
- Figure 82: Asia Pacific Glyphosate Market Volume Share (%), by Country 2024 & 2032
- Figure 83: South America Glyphosate Market Revenue (Million), by Type 2024 & 2032
- Figure 84: South America Glyphosate Market Volume (Kiloton), by Type 2024 & 2032
- Figure 85: South America Glyphosate Market Revenue Share (%), by Type 2024 & 2032
- Figure 86: South America Glyphosate Market Volume Share (%), by Type 2024 & 2032
- Figure 87: South America Glyphosate Market Revenue (Million), by Application 2024 & 2032
- Figure 88: South America Glyphosate Market Volume (Kiloton), by Application 2024 & 2032
- Figure 89: South America Glyphosate Market Revenue Share (%), by Application 2024 & 2032
- Figure 90: South America Glyphosate Market Volume Share (%), by Application 2024 & 2032
- Figure 91: South America Glyphosate Market Revenue (Million), by Type 2024 & 2032
- Figure 92: South America Glyphosate Market Volume (Kiloton), by Type 2024 & 2032
- Figure 93: South America Glyphosate Market Revenue Share (%), by Type 2024 & 2032
- Figure 94: South America Glyphosate Market Volume Share (%), by Type 2024 & 2032
- Figure 95: South America Glyphosate Market Revenue (Million), by Application 2024 & 2032
- Figure 96: South America Glyphosate Market Volume (Kiloton), by Application 2024 & 2032
- Figure 97: South America Glyphosate Market Revenue Share (%), by Application 2024 & 2032
- Figure 98: South America Glyphosate Market Volume Share (%), by Application 2024 & 2032
- Figure 99: South America Glyphosate Market Revenue (Million), by Country 2024 & 2032
- Figure 100: South America Glyphosate Market Volume (Kiloton), by Country 2024 & 2032
- Figure 101: South America Glyphosate Market Revenue Share (%), by Country 2024 & 2032
- Figure 102: South America Glyphosate Market Volume Share (%), by Country 2024 & 2032
- Figure 103: Africa Glyphosate Market Revenue (Million), by Type 2024 & 2032
- Figure 104: Africa Glyphosate Market Volume (Kiloton), by Type 2024 & 2032
- Figure 105: Africa Glyphosate Market Revenue Share (%), by Type 2024 & 2032
- Figure 106: Africa Glyphosate Market Volume Share (%), by Type 2024 & 2032
- Figure 107: Africa Glyphosate Market Revenue (Million), by Application 2024 & 2032
- Figure 108: Africa Glyphosate Market Volume (Kiloton), by Application 2024 & 2032
- Figure 109: Africa Glyphosate Market Revenue Share (%), by Application 2024 & 2032
- Figure 110: Africa Glyphosate Market Volume Share (%), by Application 2024 & 2032
- Figure 111: Africa Glyphosate Market Revenue (Million), by Type 2024 & 2032
- Figure 112: Africa Glyphosate Market Volume (Kiloton), by Type 2024 & 2032
- Figure 113: Africa Glyphosate Market Revenue Share (%), by Type 2024 & 2032
- Figure 114: Africa Glyphosate Market Volume Share (%), by Type 2024 & 2032
- Figure 115: Africa Glyphosate Market Revenue (Million), by Application 2024 & 2032
- Figure 116: Africa Glyphosate Market Volume (Kiloton), by Application 2024 & 2032
- Figure 117: Africa Glyphosate Market Revenue Share (%), by Application 2024 & 2032
- Figure 118: Africa Glyphosate Market Volume Share (%), by Application 2024 & 2032
- Figure 119: Africa Glyphosate Market Revenue (Million), by Country 2024 & 2032
- Figure 120: Africa Glyphosate Market Volume (Kiloton), by Country 2024 & 2032
- Figure 121: Africa Glyphosate Market Revenue Share (%), by Country 2024 & 2032
- Figure 122: Africa Glyphosate Market Volume Share (%), by Country 2024 & 2032
List of Tables
- Table 1: Global Glyphosate Market Revenue Million Forecast, by Region 2019 & 2032
- Table 2: Global Glyphosate Market Volume Kiloton Forecast, by Region 2019 & 2032
- Table 3: Global Glyphosate Market Revenue Million Forecast, by Type 2019 & 2032
- Table 4: Global Glyphosate Market Volume Kiloton Forecast, by Type 2019 & 2032
- Table 5: Global Glyphosate Market Revenue Million Forecast, by Application 2019 & 2032
- Table 6: Global Glyphosate Market Volume Kiloton Forecast, by Application 2019 & 2032
- Table 7: Global Glyphosate Market Revenue Million Forecast, by Type 2019 & 2032
- Table 8: Global Glyphosate Market Volume Kiloton Forecast, by Type 2019 & 2032
- Table 9: Global Glyphosate Market Revenue Million Forecast, by Application 2019 & 2032
- Table 10: Global Glyphosate Market Volume Kiloton Forecast, by Application 2019 & 2032
- Table 11: Global Glyphosate Market Revenue Million Forecast, by Region 2019 & 2032
- Table 12: Global Glyphosate Market Volume Kiloton Forecast, by Region 2019 & 2032
- Table 13: Global Glyphosate Market Revenue Million Forecast, by Country 2019 & 2032
- Table 14: Global Glyphosate Market Volume Kiloton Forecast, by Country 2019 & 2032
- Table 15: United States Glyphosate Market Revenue (Million) Forecast, by Application 2019 & 2032
- Table 16: United States Glyphosate Market Volume (Kiloton) Forecast, by Application 2019 & 2032
- Table 17: Canada Glyphosate Market Revenue (Million) Forecast, by Application 2019 & 2032
- Table 18: Canada Glyphosate Market Volume (Kiloton) Forecast, by Application 2019 & 2032
- Table 19: Mexico Glyphosate Market Revenue (Million) Forecast, by Application 2019 & 2032
- Table 20: Mexico Glyphosate Market Volume (Kiloton) Forecast, by Application 2019 & 2032
- Table 21: Rest of North America Glyphosate Market Revenue (Million) Forecast, by Application 2019 & 2032
- Table 22: Rest of North America Glyphosate Market Volume (Kiloton) Forecast, by Application 2019 & 2032
- Table 23: Global Glyphosate Market Revenue Million Forecast, by Country 2019 & 2032
- Table 24: Global Glyphosate Market Volume Kiloton Forecast, by Country 2019 & 2032
- Table 25: Spain Glyphosate Market Revenue (Million) Forecast, by Application 2019 & 2032
- Table 26: Spain Glyphosate Market Volume (Kiloton) Forecast, by Application 2019 & 2032
- Table 27: Italy Glyphosate Market Revenue (Million) Forecast, by Application 2019 & 2032
- Table 28: Italy Glyphosate Market Volume (Kiloton) Forecast, by Application 2019 & 2032
- Table 29: France Glyphosate Market Revenue (Million) Forecast, by Application 2019 & 2032
- Table 30: France Glyphosate Market Volume (Kiloton) Forecast, by Application 2019 & 2032
- Table 31: Germany Glyphosate Market Revenue (Million) Forecast, by Application 2019 & 2032
- Table 32: Germany Glyphosate Market Volume (Kiloton) Forecast, by Application 2019 & 2032
- Table 33: Russia Glyphosate Market Revenue (Million) Forecast, by Application 2019 & 2032
- Table 34: Russia Glyphosate Market Volume (Kiloton) Forecast, by Application 2019 & 2032
- Table 35: United Kingdom Glyphosate Market Revenue (Million) Forecast, by Application 2019 & 2032
- Table 36: United Kingdom Glyphosate Market Volume (Kiloton) Forecast, by Application 2019 & 2032
- Table 37: Rest of Europe Glyphosate Market Revenue (Million) Forecast, by Application 2019 & 2032
- Table 38: Rest of Europe Glyphosate Market Volume (Kiloton) Forecast, by Application 2019 & 2032
- Table 39: Global Glyphosate Market Revenue Million Forecast, by Country 2019 & 2032
- Table 40: Global Glyphosate Market Volume Kiloton Forecast, by Country 2019 & 2032
- Table 41: India Glyphosate Market Revenue (Million) Forecast, by Application 2019 & 2032
- Table 42: India Glyphosate Market Volume (Kiloton) Forecast, by Application 2019 & 2032
- Table 43: China Glyphosate Market Revenue (Million) Forecast, by Application 2019 & 2032
- Table 44: China Glyphosate Market Volume (Kiloton) Forecast, by Application 2019 & 2032
- Table 45: Japan Glyphosate Market Revenue (Million) Forecast, by Application 2019 & 2032
- Table 46: Japan Glyphosate Market Volume (Kiloton) Forecast, by Application 2019 & 2032
- Table 47: Australia Glyphosate Market Revenue (Million) Forecast, by Application 2019 & 2032
- Table 48: Australia Glyphosate Market Volume (Kiloton) Forecast, by Application 2019 & 2032
- Table 49: Rest of Asia Pacific Glyphosate Market Revenue (Million) Forecast, by Application 2019 & 2032
- Table 50: Rest of Asia Pacific Glyphosate Market Volume (Kiloton) Forecast, by Application 2019 & 2032
- Table 51: Global Glyphosate Market Revenue Million Forecast, by Country 2019 & 2032
- Table 52: Global Glyphosate Market Volume Kiloton Forecast, by Country 2019 & 2032
- Table 53: Brazil Glyphosate Market Revenue (Million) Forecast, by Application 2019 & 2032
- Table 54: Brazil Glyphosate Market Volume (Kiloton) Forecast, by Application 2019 & 2032
- Table 55: Argentina Glyphosate Market Revenue (Million) Forecast, by Application 2019 & 2032
- Table 56: Argentina Glyphosate Market Volume (Kiloton) Forecast, by Application 2019 & 2032
- Table 57: Rest of South America Glyphosate Market Revenue (Million) Forecast, by Application 2019 & 2032
- Table 58: Rest of South America Glyphosate Market Volume (Kiloton) Forecast, by Application 2019 & 2032
- Table 59: Global Glyphosate Market Revenue Million Forecast, by Country 2019 & 2032
- Table 60: Global Glyphosate Market Volume Kiloton Forecast, by Country 2019 & 2032
- Table 61: South Africa Glyphosate Market Revenue (Million) Forecast, by Application 2019 & 2032
- Table 62: South Africa Glyphosate Market Volume (Kiloton) Forecast, by Application 2019 & 2032
- Table 63: Rest of Africa Glyphosate Market Revenue (Million) Forecast, by Application 2019 & 2032
- Table 64: Rest of Africa Glyphosate Market Volume (Kiloton) Forecast, by Application 2019 & 2032
- Table 65: Global Glyphosate Market Revenue Million Forecast, by Type 2019 & 2032
- Table 66: Global Glyphosate Market Volume Kiloton Forecast, by Type 2019 & 2032
- Table 67: Global Glyphosate Market Revenue Million Forecast, by Application 2019 & 2032
- Table 68: Global Glyphosate Market Volume Kiloton Forecast, by Application 2019 & 2032
- Table 69: Global Glyphosate Market Revenue Million Forecast, by Type 2019 & 2032
- Table 70: Global Glyphosate Market Volume Kiloton Forecast, by Type 2019 & 2032
- Table 71: Global Glyphosate Market Revenue Million Forecast, by Application 2019 & 2032
- Table 72: Global Glyphosate Market Volume Kiloton Forecast, by Application 2019 & 2032
- Table 73: Global Glyphosate Market Revenue Million Forecast, by Country 2019 & 2032
- Table 74: Global Glyphosate Market Volume Kiloton Forecast, by Country 2019 & 2032
- Table 75: United States Glyphosate Market Revenue (Million) Forecast, by Application 2019 & 2032
- Table 76: United States Glyphosate Market Volume (Kiloton) Forecast, by Application 2019 & 2032
- Table 77: Canada Glyphosate Market Revenue (Million) Forecast, by Application 2019 & 2032
- Table 78: Canada Glyphosate Market Volume (Kiloton) Forecast, by Application 2019 & 2032
- Table 79: Mexico Glyphosate Market Revenue (Million) Forecast, by Application 2019 & 2032
- Table 80: Mexico Glyphosate Market Volume (Kiloton) Forecast, by Application 2019 & 2032
- Table 81: Rest of North America Glyphosate Market Revenue (Million) Forecast, by Application 2019 & 2032
- Table 82: Rest of North America Glyphosate Market Volume (Kiloton) Forecast, by Application 2019 & 2032
- Table 83: Global Glyphosate Market Revenue Million Forecast, by Type 2019 & 2032
- Table 84: Global Glyphosate Market Volume Kiloton Forecast, by Type 2019 & 2032
- Table 85: Global Glyphosate Market Revenue Million Forecast, by Application 2019 & 2032
- Table 86: Global Glyphosate Market Volume Kiloton Forecast, by Application 2019 & 2032
- Table 87: Global Glyphosate Market Revenue Million Forecast, by Type 2019 & 2032
- Table 88: Global Glyphosate Market Volume Kiloton Forecast, by Type 2019 & 2032
- Table 89: Global Glyphosate Market Revenue Million Forecast, by Application 2019 & 2032
- Table 90: Global Glyphosate Market Volume Kiloton Forecast, by Application 2019 & 2032
- Table 91: Global Glyphosate Market Revenue Million Forecast, by Country 2019 & 2032
- Table 92: Global Glyphosate Market Volume Kiloton Forecast, by Country 2019 & 2032
- Table 93: Spain Glyphosate Market Revenue (Million) Forecast, by Application 2019 & 2032
- Table 94: Spain Glyphosate Market Volume (Kiloton) Forecast, by Application 2019 & 2032
- Table 95: Italy Glyphosate Market Revenue (Million) Forecast, by Application 2019 & 2032
- Table 96: Italy Glyphosate Market Volume (Kiloton) Forecast, by Application 2019 & 2032
- Table 97: France Glyphosate Market Revenue (Million) Forecast, by Application 2019 & 2032
- Table 98: France Glyphosate Market Volume (Kiloton) Forecast, by Application 2019 & 2032
- Table 99: Germany Glyphosate Market Revenue (Million) Forecast, by Application 2019 & 2032
- Table 100: Germany Glyphosate Market Volume (Kiloton) Forecast, by Application 2019 & 2032
- Table 101: Russia Glyphosate Market Revenue (Million) Forecast, by Application 2019 & 2032
- Table 102: Russia Glyphosate Market Volume (Kiloton) Forecast, by Application 2019 & 2032
- Table 103: United Kingdom Glyphosate Market Revenue (Million) Forecast, by Application 2019 & 2032
- Table 104: United Kingdom Glyphosate Market Volume (Kiloton) Forecast, by Application 2019 & 2032
- Table 105: Rest of Europe Glyphosate Market Revenue (Million) Forecast, by Application 2019 & 2032
- Table 106: Rest of Europe Glyphosate Market Volume (Kiloton) Forecast, by Application 2019 & 2032
- Table 107: Global Glyphosate Market Revenue Million Forecast, by Type 2019 & 2032
- Table 108: Global Glyphosate Market Volume Kiloton Forecast, by Type 2019 & 2032
- Table 109: Global Glyphosate Market Revenue Million Forecast, by Application 2019 & 2032
- Table 110: Global Glyphosate Market Volume Kiloton Forecast, by Application 2019 & 2032
- Table 111: Global Glyphosate Market Revenue Million Forecast, by Type 2019 & 2032
- Table 112: Global Glyphosate Market Volume Kiloton Forecast, by Type 2019 & 2032
- Table 113: Global Glyphosate Market Revenue Million Forecast, by Application 2019 & 2032
- Table 114: Global Glyphosate Market Volume Kiloton Forecast, by Application 2019 & 2032
- Table 115: Global Glyphosate Market Revenue Million Forecast, by Country 2019 & 2032
- Table 116: Global Glyphosate Market Volume Kiloton Forecast, by Country 2019 & 2032
- Table 117: India Glyphosate Market Revenue (Million) Forecast, by Application 2019 & 2032
- Table 118: India Glyphosate Market Volume (Kiloton) Forecast, by Application 2019 & 2032
- Table 119: China Glyphosate Market Revenue (Million) Forecast, by Application 2019 & 2032
- Table 120: China Glyphosate Market Volume (Kiloton) Forecast, by Application 2019 & 2032
- Table 121: Japan Glyphosate Market Revenue (Million) Forecast, by Application 2019 & 2032
- Table 122: Japan Glyphosate Market Volume (Kiloton) Forecast, by Application 2019 & 2032
- Table 123: Australia Glyphosate Market Revenue (Million) Forecast, by Application 2019 & 2032
- Table 124: Australia Glyphosate Market Volume (Kiloton) Forecast, by Application 2019 & 2032
- Table 125: Rest of Asia Pacific Glyphosate Market Revenue (Million) Forecast, by Application 2019 & 2032
- Table 126: Rest of Asia Pacific Glyphosate Market Volume (Kiloton) Forecast, by Application 2019 & 2032
- Table 127: Global Glyphosate Market Revenue Million Forecast, by Type 2019 & 2032
- Table 128: Global Glyphosate Market Volume Kiloton Forecast, by Type 2019 & 2032
- Table 129: Global Glyphosate Market Revenue Million Forecast, by Application 2019 & 2032
- Table 130: Global Glyphosate Market Volume Kiloton Forecast, by Application 2019 & 2032
- Table 131: Global Glyphosate Market Revenue Million Forecast, by Type 2019 & 2032
- Table 132: Global Glyphosate Market Volume Kiloton Forecast, by Type 2019 & 2032
- Table 133: Global Glyphosate Market Revenue Million Forecast, by Application 2019 & 2032
- Table 134: Global Glyphosate Market Volume Kiloton Forecast, by Application 2019 & 2032
- Table 135: Global Glyphosate Market Revenue Million Forecast, by Country 2019 & 2032
- Table 136: Global Glyphosate Market Volume Kiloton Forecast, by Country 2019 & 2032
- Table 137: Brazil Glyphosate Market Revenue (Million) Forecast, by Application 2019 & 2032
- Table 138: Brazil Glyphosate Market Volume (Kiloton) Forecast, by Application 2019 & 2032
- Table 139: Argentina Glyphosate Market Revenue (Million) Forecast, by Application 2019 & 2032
- Table 140: Argentina Glyphosate Market Volume (Kiloton) Forecast, by Application 2019 & 2032
- Table 141: Rest of South America Glyphosate Market Revenue (Million) Forecast, by Application 2019 & 2032
- Table 142: Rest of South America Glyphosate Market Volume (Kiloton) Forecast, by Application 2019 & 2032
- Table 143: Global Glyphosate Market Revenue Million Forecast, by Type 2019 & 2032
- Table 144: Global Glyphosate Market Volume Kiloton Forecast, by Type 2019 & 2032
- Table 145: Global Glyphosate Market Revenue Million Forecast, by Application 2019 & 2032
- Table 146: Global Glyphosate Market Volume Kiloton Forecast, by Application 2019 & 2032
- Table 147: Global Glyphosate Market Revenue Million Forecast, by Type 2019 & 2032
- Table 148: Global Glyphosate Market Volume Kiloton Forecast, by Type 2019 & 2032
- Table 149: Global Glyphosate Market Revenue Million Forecast, by Application 2019 & 2032
- Table 150: Global Glyphosate Market Volume Kiloton Forecast, by Application 2019 & 2032
- Table 151: Global Glyphosate Market Revenue Million Forecast, by Country 2019 & 2032
- Table 152: Global Glyphosate Market Volume Kiloton Forecast, by Country 2019 & 2032
- Table 153: South Africa Glyphosate Market Revenue (Million) Forecast, by Application 2019 & 2032
- Table 154: South Africa Glyphosate Market Volume (Kiloton) Forecast, by Application 2019 & 2032
- Table 155: Rest of Africa Glyphosate Market Revenue (Million) Forecast, by Application 2019 & 2032
- Table 156: Rest of Africa Glyphosate Market Volume (Kiloton) Forecast, by Application 2019 & 2032
Frequently Asked Questions
1. What is the projected Compound Annual Growth Rate (CAGR) of the Glyphosate Market?
The projected CAGR is approximately 7.49%.
2. Which companies are prominent players in the Glyphosate Market?
Key companies in the market include FMC Corporation, Bayer Cropscience AG, Dow AgroScience, DuPont, Adama Agricultural Solutions Ltd, Nufarm Limited, Zhejiang Xinan Chemical Industrial Group Company Ltd, UPL Limited, Syngenta International, BASF SE.
3. What are the main segments of the Glyphosate Market?
The market segments include Type, Application, Type, Application.
4. Can you provide details about the market size?
The market size is estimated to be USD 9.14 Million as of 2022.
5. What are some drivers contributing to market growth?
Seed Treatment As A Solution To Enhance Yield; Growing Awareness For Seed Treatment Among The Farmers; Rising Trend Of Organic Farming.
6. What are the notable trends driving market growth?
Commercialization of Genetically Engineered Herbicide-tolerant Crops.
7. Are there any restraints impacting market growth?
Limitations Across Farm-Level Seed Treatment; Rising Environmental Concerns.
8. Can you provide examples of recent developments in the market?
August 2022: BASF and Corteva Agriscience entered a collaboration deal to develop new soybean weed control solutions for farmers around the world, and the companies agreed to cross-license soybean traits while developing complementary herbicide technologies (which will include tolerance to glyphosate), enabling both companies to offer innovative soybean weed management solutions.
9. What pricing options are available for accessing the report?
Pricing options include single-user, multi-user, and enterprise licenses priced at USD 4750, USD 5250, and USD 8750 respectively.
10. Is the market size provided in terms of value or volume?
The market size is provided in terms of value, measured in Million and volume, measured in Kiloton.
11. Are there any specific market keywords associated with the report?
Yes, the market keyword associated with the report is "Glyphosate Market," which aids in identifying and referencing the specific market segment covered.
12. How do I determine which pricing option suits my needs best?
The pricing options vary based on user requirements and access needs. Individual users may opt for single-user licenses, while businesses requiring broader access may choose multi-user or enterprise licenses for cost-effective access to the report.
13. Are there any additional resources or data provided in the Glyphosate Market report?
While the report offers comprehensive insights, it's advisable to review the specific contents or supplementary materials provided to ascertain if additional resources or data are available.
14. How can I stay updated on further developments or reports in the Glyphosate Market?
To stay informed about further developments, trends, and reports in the Glyphosate Market, consider subscribing to industry newsletters, following relevant companies and organizations, or regularly checking reputable industry news sources and publications.
Methodology
Step 1 - Identification of Relevant Samples Size from Population Database


Step 2 - Approaches for Defining Global Market Size (Value, Volume* & Price*)

Note*: In applicable scenarios
Step 3 - Data Sources
Primary Research
- Web Analytics
- Survey Reports
- Research Institute
- Latest Research Reports
- Opinion Leaders
Secondary Research
- Annual Reports
- White Paper
- Latest Press Release
- Industry Association
- Paid Database
- Investor Presentations

Step 4 - Data Triangulation
Involves using different sources of information in order to increase the validity of a study
These sources are likely to be stakeholders in a program - participants, other researchers, program staff, other community members, and so on.
Then we put all data in single framework & apply various statistical tools to find out the dynamic on the market.
During the analysis stage, feedback from the stakeholder groups would be compared to determine areas of agreement as well as areas of divergence


