
Key Insights
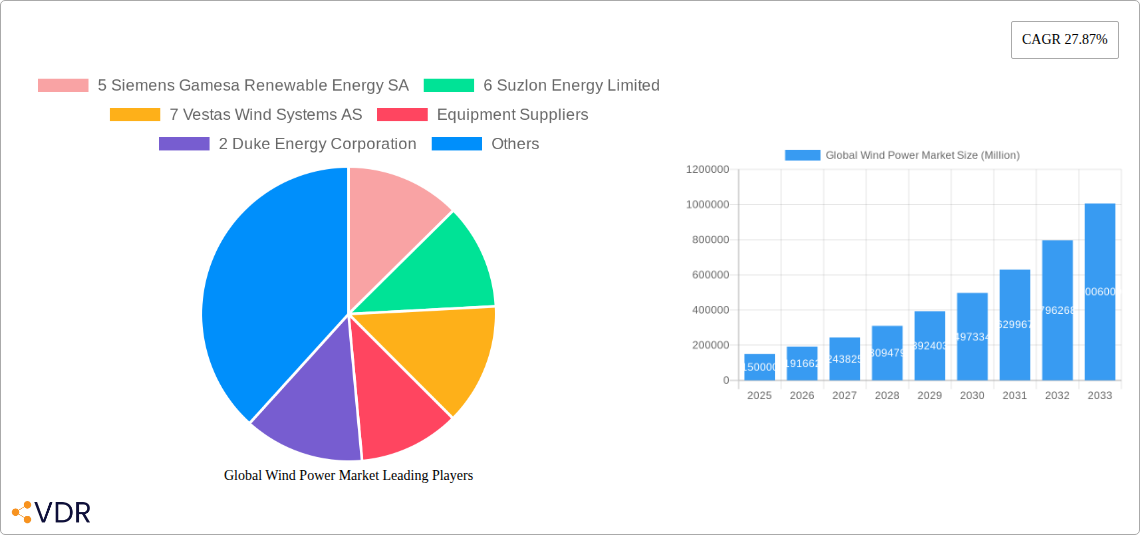
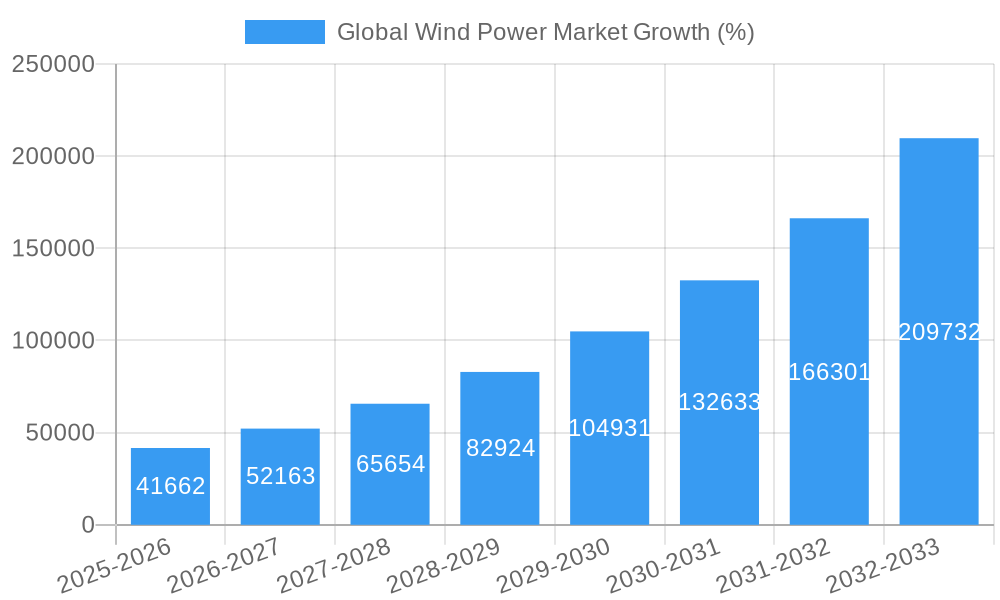
The global wind power market is experiencing robust growth, projected to reach a significant size by 2033, driven by increasing concerns about climate change and the urgent need for renewable energy sources. A compound annual growth rate (CAGR) of 27.87% from 2019 to 2024 suggests a substantial market expansion. This growth is fueled by supportive government policies promoting renewable energy adoption, decreasing wind turbine costs, and technological advancements leading to higher efficiency and improved energy capture. Key market segments include onshore and offshore wind power generation, with the latter expected to see particularly strong growth due to its higher capacity factor and access to larger, more consistent wind resources. Major players like Siemens Gamesa, Vestas, and Goldwind are driving innovation and competition, while leading wind farm operators such as Orsted and NextEra Energy are expanding their portfolios to meet growing energy demand. Regional variations exist, with North America, Europe, and Asia-Pacific emerging as key markets, each presenting unique opportunities and challenges. Factors such as grid infrastructure limitations, land availability, and permitting processes can influence regional market development. Further expansion will depend on continued technological improvements, supportive regulatory frameworks, and increasing investor confidence in the long-term viability of wind power as a clean energy solution.
The market's future trajectory will be significantly impacted by the successful integration of wind power into existing energy grids, advancements in energy storage technologies, and the development of offshore wind farms in deeper waters. Addressing environmental concerns, such as the impact on wildlife, and securing sufficient financing for large-scale projects will also be critical for continued growth. While challenges exist, the strong fundamentals of the wind power market, combined with increasing global pressure to decarbonize the energy sector, suggest a promising outlook for sustainable long-term expansion. The continued focus on technological advancements, optimized supply chains, and efficient project development will be instrumental in realizing the market's full potential and achieving global renewable energy targets.
Global Wind Power Market: A Comprehensive Report (2019-2033)
This in-depth report provides a comprehensive analysis of the global wind power market, encompassing market dynamics, growth trends, regional dominance, product landscape, key players, and future outlook. The report covers the period from 2019 to 2033, with a focus on the 2025-2033 forecast period. It examines both onshore and offshore wind power segments, offering granular insights for industry professionals, investors, and strategists. The market size is projected in Million units.
Global Wind Power Market Dynamics & Structure
The global wind power market exhibits a dynamic interplay of factors shaping its structure and growth trajectory. Market concentration is moderate, with a few major players holding significant shares, while numerous smaller companies contribute to innovation and competition. Technological advancements, particularly in turbine design and energy storage, are key drivers, alongside supportive government policies and increasing concerns about climate change. However, challenges remain, including grid integration complexities, land-use constraints, and fluctuating energy prices. The market is also influenced by mergers and acquisitions (M&A) activity, as larger players seek to consolidate their market position and access new technologies.
- Market Concentration: Moderate, with top 5 players holding approximately xx% market share (2024).
- Technological Innovation: Focus on increased turbine efficiency, improved blade design, and smart grid integration.
- Regulatory Framework: Varying government incentives and regulations across regions significantly impact market growth.
- Competitive Substitutes: Solar power, hydroelectric power, and fossil fuels compete for energy generation investments.
- End-User Demographics: A diverse range of end-users, including utilities, independent power producers (IPPs), and corporations, contribute to market demand.
- M&A Activity: Significant M&A activity observed in recent years, indicating industry consolidation. xx major deals were recorded between 2019-2024.
Global Wind Power Market Growth Trends & Insights
The global wind power market is experiencing substantial growth, driven by a combination of factors. The increasing demand for renewable energy sources, supportive government policies aimed at reducing carbon emissions, and declining technology costs are all contributing to the market's expansion. Technological innovations, such as improved turbine designs and the integration of smart grids, are enhancing the efficiency and cost-effectiveness of wind power generation. Consumer awareness of environmental issues is also fueling the demand for cleaner energy alternatives. The market exhibits a compound annual growth rate (CAGR) of xx% during the forecast period (2025-2033), with a projected market size of xx Million units by 2033.
Dominant Regions, Countries, or Segments in Global Wind Power Market
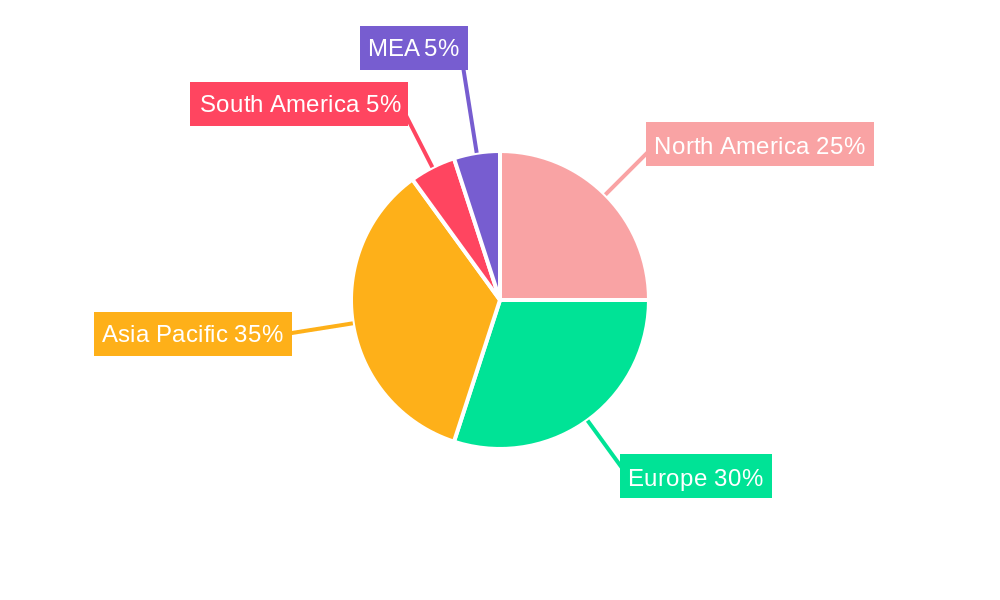
The onshore wind power segment currently dominates the market, owing to its lower initial investment costs and established infrastructure in many regions. However, offshore wind power is witnessing rapid growth, driven by technological advancements that enhance energy output and efficiency. China, the United States, and several European countries are leading the market, boosted by government support, favorable geographical conditions, and strong investments in renewable energy infrastructure.
- Key Drivers (Onshore): Abundant land availability, established supply chains, and government incentives.
- Key Drivers (Offshore): High wind speeds, advancements in floating offshore wind technology, and supportive government policies (e.g., UK's increased subsidies).
- Market Share: China holds the largest market share (xx%), followed by the US (xx%) and Europe (xx%).
- Growth Potential: Offshore wind exhibits higher growth potential due to technological advancements and increasing policy support.
Global Wind Power Market Product Landscape
The global wind power market offers a diverse range of products, including onshore and offshore wind turbines of varying capacities and designs. Recent innovations focus on increasing turbine efficiency, reducing noise pollution, and enhancing the longevity of components. Advancements in blade design, generator technology, and control systems contribute to improved performance metrics, such as higher energy output and lower maintenance costs. Key selling propositions include improved reliability, reduced lifecycle costs, and environmental sustainability.
Key Drivers, Barriers & Challenges in Global Wind Power Market
Key Drivers:
- Increasing demand for renewable energy due to climate change concerns.
- Government policies and subsidies promoting renewable energy adoption.
- Technological advancements leading to cost reductions and efficiency improvements.
Challenges:
- Intermittency of wind power, requiring effective grid integration solutions.
- High initial investment costs, particularly for offshore wind projects.
- Land-use constraints, particularly for onshore wind farms. ( xx% of projects face significant land-use limitations).
- Supply chain disruptions impacting component availability and project timelines.
Emerging Opportunities in Global Wind Power Market
- Floating offshore wind technology expansion in deep waters.
- Hybrid energy projects integrating wind, solar, and energy storage.
- Growth in developing markets with high renewable energy potential.
- Smart grid integration for better grid stability and efficiency.
- Advancements in wind power forecasting and grid management.
Growth Accelerators in the Global Wind Power Market Industry
Technological breakthroughs in turbine design, energy storage, and grid integration are significantly accelerating market growth. Strategic partnerships between technology providers, energy companies, and investors are fostering innovation and market expansion. Government policies supporting renewable energy adoption and international collaborations are also creating favorable market conditions.
Key Players Shaping the Global Wind Power Market Market
- Siemens Gamesa Renewable Energy SA
- Suzlon Energy Limited
- Vestas Wind Systems AS
- Equipment Suppliers
- Duke Energy Corporation
- E ON SE
- NextEra Energy Inc
- Xinjiang Goldwind Science & Technology Co Ltd (Goldwind)
- Envision Energy
- Orsted AS
- Wind Farm Operators
- EDF SA
- Dongfang Electric Corporation
- General Electric Company
- Aerodyn Energiesysteme GmbH
- Acciona Energia SA
Notable Milestones in Global Wind Power Market Sector
- November 2023: The UK government increased offshore wind farm subsidies by 66%, significantly boosting investment in the sector.
- April 2024: Mahindra Group invested USD 144 million in solar and wind energy projects in India, signifying growing investment in hybrid renewable energy solutions.
In-Depth Global Wind Power Market Market Outlook
The future of the global wind power market is bright, driven by a confluence of factors. Continued technological advancements, supportive government policies, and increasing investor interest will propel market growth. Strategic partnerships and regional expansion into untapped markets will further unlock growth potential. The market is poised for significant expansion in the coming years, presenting lucrative opportunities for companies operating across the entire value chain.
Global Wind Power Market Segmentation
-
1. Location
- 1.1. Onshore
- 1.2. Offshore
Global Wind Power Market Segmentation By Geography
-
1. North America
- 1.1. United States
- 1.2. Canada
- 1.3. Rest of North America
-
2. Europe
- 2.1. United Kingdom
- 2.2. France
- 2.3. Norway
- 2.4. Germany
- 2.5. Spain
- 2.6. Turkey
- 2.7. Russia
- 2.8. NORDIC
- 2.9. Rest of Europe
-
3. Asia Pacific
- 3.1. China
- 3.2. India
- 3.3. Japan
- 3.4. Malaysia
- 3.5. Thailand
- 3.6. Indonesia
- 3.7. Vietnam
- 4. Rest of Asia Pacific
-
5. Middle East and Africa
- 5.1. United Arab Emirates
- 5.2. Egypt
- 5.3. Saudi Arabia
- 5.4. Nigeria
- 5.5. Qatar
- 6. Rest of Middle East and Africa
-
7. South America
- 7.1. Brazil
- 7.2. Chile
- 7.3. Argentina
- 7.4. Colombia
- 7.5. Rest of South America
Global Wind Power Market REPORT HIGHLIGHTS
| Aspects | Details |
|---|---|
| Study Period | 2019-2033 |
| Base Year | 2024 |
| Estimated Year | 2025 |
| Forecast Period | 2025-2033 |
| Historical Period | 2019-2024 |
| Growth Rate | CAGR of 27.87% from 2019-2033 |
| Segmentation |
|
Table of Contents
- 1. Introduction
- 1.1. Research Scope
- 1.2. Market Segmentation
- 1.3. Research Methodology
- 1.4. Definitions and Assumptions
- 2. Executive Summary
- 2.1. Introduction
- 3. Market Dynamics
- 3.1. Introduction
- 3.2. Market Drivers
- 3.2.1. 4.; Increasing Investments in Offshore Wind Power Projects4.; Supportive Government Policies
- 3.3. Market Restrains
- 3.3.1. 4.; Increasing Adopting of Alternative Clean Energy Sources (Ex
- 3.4. Market Trends
- 3.4.1. The Offshore Wind Power Sector is Expected to Witness Significant Growth
- 4. Market Factor Analysis
- 4.1. Porters Five Forces
- 4.2. Supply/Value Chain
- 4.3. PESTEL analysis
- 4.4. Market Entropy
- 4.5. Patent/Trademark Analysis
- 5. Global Wind Power Market Analysis, Insights and Forecast, 2019-2031
- 5.1. Market Analysis, Insights and Forecast - by Location
- 5.1.1. Onshore
- 5.1.2. Offshore
- 5.2. Market Analysis, Insights and Forecast - by Region
- 5.2.1. North America
- 5.2.2. Europe
- 5.2.3. Asia Pacific
- 5.2.4. Rest of Asia Pacific
- 5.2.5. Middle East and Africa
- 5.2.6. Rest of Middle East and Africa
- 5.2.7. South America
- 5.1. Market Analysis, Insights and Forecast - by Location
- 6. North America Global Wind Power Market Analysis, Insights and Forecast, 2019-2031
- 6.1. Market Analysis, Insights and Forecast - by Location
- 6.1.1. Onshore
- 6.1.2. Offshore
- 6.1. Market Analysis, Insights and Forecast - by Location
- 7. Europe Global Wind Power Market Analysis, Insights and Forecast, 2019-2031
- 7.1. Market Analysis, Insights and Forecast - by Location
- 7.1.1. Onshore
- 7.1.2. Offshore
- 7.1. Market Analysis, Insights and Forecast - by Location
- 8. Asia Pacific Global Wind Power Market Analysis, Insights and Forecast, 2019-2031
- 8.1. Market Analysis, Insights and Forecast - by Location
- 8.1.1. Onshore
- 8.1.2. Offshore
- 8.1. Market Analysis, Insights and Forecast - by Location
- 9. Rest of Asia Pacific Global Wind Power Market Analysis, Insights and Forecast, 2019-2031
- 9.1. Market Analysis, Insights and Forecast - by Location
- 9.1.1. Onshore
- 9.1.2. Offshore
- 9.1. Market Analysis, Insights and Forecast - by Location
- 10. Middle East and Africa Global Wind Power Market Analysis, Insights and Forecast, 2019-2031
- 10.1. Market Analysis, Insights and Forecast - by Location
- 10.1.1. Onshore
- 10.1.2. Offshore
- 10.1. Market Analysis, Insights and Forecast - by Location
- 11. Rest of Middle East and Africa Global Wind Power Market Analysis, Insights and Forecast, 2019-2031
- 11.1. Market Analysis, Insights and Forecast - by Location
- 11.1.1. Onshore
- 11.1.2. Offshore
- 11.1. Market Analysis, Insights and Forecast - by Location
- 12. South America Global Wind Power Market Analysis, Insights and Forecast, 2019-2031
- 12.1. Market Analysis, Insights and Forecast - by Location
- 12.1.1. Onshore
- 12.1.2. Offshore
- 12.1. Market Analysis, Insights and Forecast - by Location
- 13. North America Global Wind Power Market Analysis, Insights and Forecast, 2019-2031
- 13.1. Market Analysis, Insights and Forecast - By Country/Sub-region
- 13.1.1 United States
- 13.1.2 Canada
- 13.1.3 Mexico
- 14. Europe Global Wind Power Market Analysis, Insights and Forecast, 2019-2031
- 14.1. Market Analysis, Insights and Forecast - By Country/Sub-region
- 14.1.1 Germany
- 14.1.2 United Kingdom
- 14.1.3 France
- 14.1.4 Spain
- 14.1.5 Italy
- 14.1.6 Spain
- 14.1.7 Belgium
- 14.1.8 Netherland
- 14.1.9 Nordics
- 14.1.10 Rest of Europe
- 15. Asia Pacific Global Wind Power Market Analysis, Insights and Forecast, 2019-2031
- 15.1. Market Analysis, Insights and Forecast - By Country/Sub-region
- 15.1.1 China
- 15.1.2 Japan
- 15.1.3 India
- 15.1.4 South Korea
- 15.1.5 Southeast Asia
- 15.1.6 Australia
- 15.1.7 Indonesia
- 15.1.8 Phillipes
- 15.1.9 Singapore
- 15.1.10 Thailandc
- 15.1.11 Rest of Asia Pacific
- 16. South America Global Wind Power Market Analysis, Insights and Forecast, 2019-2031
- 16.1. Market Analysis, Insights and Forecast - By Country/Sub-region
- 16.1.1 Brazil
- 16.1.2 Argentina
- 16.1.3 Peru
- 16.1.4 Chile
- 16.1.5 Colombia
- 16.1.6 Ecuador
- 16.1.7 Venezuela
- 16.1.8 Rest of South America
- 17. North America Global Wind Power Market Analysis, Insights and Forecast, 2019-2031
- 17.1. Market Analysis, Insights and Forecast - By Country/Sub-region
- 17.1.1 United States
- 17.1.2 Canada
- 17.1.3 Mexico
- 18. MEA Global Wind Power Market Analysis, Insights and Forecast, 2019-2031
- 18.1. Market Analysis, Insights and Forecast - By Country/Sub-region
- 18.1.1 United Arab Emirates
- 18.1.2 Saudi Arabia
- 18.1.3 South Africa
- 18.1.4 Rest of Middle East and Africa
- 19. Competitive Analysis
- 19.1. Market Share Analysis 2024
- 19.2. Company Profiles
- 19.2.1 5 Siemens Gamesa Renewable Energy SA
- 19.2.1.1. Overview
- 19.2.1.2. Products
- 19.2.1.3. SWOT Analysis
- 19.2.1.4. Recent Developments
- 19.2.1.5. Financials (Based on Availability)
- 19.2.2 6 Suzlon Energy Limited
- 19.2.2.1. Overview
- 19.2.2.2. Products
- 19.2.2.3. SWOT Analysis
- 19.2.2.4. Recent Developments
- 19.2.2.5. Financials (Based on Availability)
- 19.2.3 7 Vestas Wind Systems AS
- 19.2.3.1. Overview
- 19.2.3.2. Products
- 19.2.3.3. SWOT Analysis
- 19.2.3.4. Recent Developments
- 19.2.3.5. Financials (Based on Availability)
- 19.2.4 Equipment Suppliers
- 19.2.4.1. Overview
- 19.2.4.2. Products
- 19.2.4.3. SWOT Analysis
- 19.2.4.4. Recent Developments
- 19.2.4.5. Financials (Based on Availability)
- 19.2.5 2 Duke Energy Corporation
- 19.2.5.1. Overview
- 19.2.5.2. Products
- 19.2.5.3. SWOT Analysis
- 19.2.5.4. Recent Developments
- 19.2.5.5. Financials (Based on Availability)
- 19.2.6 6 E ON SE
- 19.2.6.1. Overview
- 19.2.6.2. Products
- 19.2.6.3. SWOT Analysis
- 19.2.6.4. Recent Developments
- 19.2.6.5. Financials (Based on Availability)
- 19.2.7 5 NextEra Energy Inc
- 19.2.7.1. Overview
- 19.2.7.2. Products
- 19.2.7.3. SWOT Analysis
- 19.2.7.4. Recent Developments
- 19.2.7.5. Financials (Based on Availability)
- 19.2.8 4 Xinjiang Goldwind Science & Technology Co Ltd (Goldwind)
- 19.2.8.1. Overview
- 19.2.8.2. Products
- 19.2.8.3. SWOT Analysis
- 19.2.8.4. Recent Developments
- 19.2.8.5. Financials (Based on Availability)
- 19.2.9 2 Envision Energy
- 19.2.9.1. Overview
- 19.2.9.2. Products
- 19.2.9.3. SWOT Analysis
- 19.2.9.4. Recent Developments
- 19.2.9.5. Financials (Based on Availability)
- 19.2.10 4 Orsted AS
- 19.2.10.1. Overview
- 19.2.10.2. Products
- 19.2.10.3. SWOT Analysis
- 19.2.10.4. Recent Developments
- 19.2.10.5. Financials (Based on Availability)
- 19.2.11 Wind Farm Operators
- 19.2.11.1. Overview
- 19.2.11.2. Products
- 19.2.11.3. SWOT Analysis
- 19.2.11.4. Recent Developments
- 19.2.11.5. Financials (Based on Availability)
- 19.2.12 3 EDF SA
- 19.2.12.1. Overview
- 19.2.12.2. Products
- 19.2.12.3. SWOT Analysis
- 19.2.12.4. Recent Developments
- 19.2.12.5. Financials (Based on Availability)
- 19.2.13 8 Dongfang Electric Corporation*List Not Exhaustive 6 5 Market Share/Ranking Analysi
- 19.2.13.1. Overview
- 19.2.13.2. Products
- 19.2.13.3. SWOT Analysis
- 19.2.13.4. Recent Developments
- 19.2.13.5. Financials (Based on Availability)
- 19.2.14 3 General Electric Company
- 19.2.14.1. Overview
- 19.2.14.2. Products
- 19.2.14.3. SWOT Analysis
- 19.2.14.4. Recent Developments
- 19.2.14.5. Financials (Based on Availability)
- 19.2.15 1 Aerodyn Energiesysteme GmbH
- 19.2.15.1. Overview
- 19.2.15.2. Products
- 19.2.15.3. SWOT Analysis
- 19.2.15.4. Recent Developments
- 19.2.15.5. Financials (Based on Availability)
- 19.2.16 1 Acciona Energia SA
- 19.2.16.1. Overview
- 19.2.16.2. Products
- 19.2.16.3. SWOT Analysis
- 19.2.16.4. Recent Developments
- 19.2.16.5. Financials (Based on Availability)
- 19.2.1 5 Siemens Gamesa Renewable Energy SA
List of Figures
- Figure 1: Global Global Wind Power Market Revenue Breakdown (Million, %) by Region 2024 & 2032
- Figure 2: Global Global Wind Power Market Volume Breakdown (Thousand, %) by Region 2024 & 2032
- Figure 3: North America Global Wind Power Market Revenue (Million), by Country 2024 & 2032
- Figure 4: North America Global Wind Power Market Volume (Thousand), by Country 2024 & 2032
- Figure 5: North America Global Wind Power Market Revenue Share (%), by Country 2024 & 2032
- Figure 6: North America Global Wind Power Market Volume Share (%), by Country 2024 & 2032
- Figure 7: Europe Global Wind Power Market Revenue (Million), by Country 2024 & 2032
- Figure 8: Europe Global Wind Power Market Volume (Thousand), by Country 2024 & 2032
- Figure 9: Europe Global Wind Power Market Revenue Share (%), by Country 2024 & 2032
- Figure 10: Europe Global Wind Power Market Volume Share (%), by Country 2024 & 2032
- Figure 11: Asia Pacific Global Wind Power Market Revenue (Million), by Country 2024 & 2032
- Figure 12: Asia Pacific Global Wind Power Market Volume (Thousand), by Country 2024 & 2032
- Figure 13: Asia Pacific Global Wind Power Market Revenue Share (%), by Country 2024 & 2032
- Figure 14: Asia Pacific Global Wind Power Market Volume Share (%), by Country 2024 & 2032
- Figure 15: South America Global Wind Power Market Revenue (Million), by Country 2024 & 2032
- Figure 16: South America Global Wind Power Market Volume (Thousand), by Country 2024 & 2032
- Figure 17: South America Global Wind Power Market Revenue Share (%), by Country 2024 & 2032
- Figure 18: South America Global Wind Power Market Volume Share (%), by Country 2024 & 2032
- Figure 19: North America Global Wind Power Market Revenue (Million), by Country 2024 & 2032
- Figure 20: North America Global Wind Power Market Volume (Thousand), by Country 2024 & 2032
- Figure 21: North America Global Wind Power Market Revenue Share (%), by Country 2024 & 2032
- Figure 22: North America Global Wind Power Market Volume Share (%), by Country 2024 & 2032
- Figure 23: MEA Global Wind Power Market Revenue (Million), by Country 2024 & 2032
- Figure 24: MEA Global Wind Power Market Volume (Thousand), by Country 2024 & 2032
- Figure 25: MEA Global Wind Power Market Revenue Share (%), by Country 2024 & 2032
- Figure 26: MEA Global Wind Power Market Volume Share (%), by Country 2024 & 2032
- Figure 27: North America Global Wind Power Market Revenue (Million), by Location 2024 & 2032
- Figure 28: North America Global Wind Power Market Volume (Thousand), by Location 2024 & 2032
- Figure 29: North America Global Wind Power Market Revenue Share (%), by Location 2024 & 2032
- Figure 30: North America Global Wind Power Market Volume Share (%), by Location 2024 & 2032
- Figure 31: North America Global Wind Power Market Revenue (Million), by Country 2024 & 2032
- Figure 32: North America Global Wind Power Market Volume (Thousand), by Country 2024 & 2032
- Figure 33: North America Global Wind Power Market Revenue Share (%), by Country 2024 & 2032
- Figure 34: North America Global Wind Power Market Volume Share (%), by Country 2024 & 2032
- Figure 35: Europe Global Wind Power Market Revenue (Million), by Location 2024 & 2032
- Figure 36: Europe Global Wind Power Market Volume (Thousand), by Location 2024 & 2032
- Figure 37: Europe Global Wind Power Market Revenue Share (%), by Location 2024 & 2032
- Figure 38: Europe Global Wind Power Market Volume Share (%), by Location 2024 & 2032
- Figure 39: Europe Global Wind Power Market Revenue (Million), by Country 2024 & 2032
- Figure 40: Europe Global Wind Power Market Volume (Thousand), by Country 2024 & 2032
- Figure 41: Europe Global Wind Power Market Revenue Share (%), by Country 2024 & 2032
- Figure 42: Europe Global Wind Power Market Volume Share (%), by Country 2024 & 2032
- Figure 43: Asia Pacific Global Wind Power Market Revenue (Million), by Location 2024 & 2032
- Figure 44: Asia Pacific Global Wind Power Market Volume (Thousand), by Location 2024 & 2032
- Figure 45: Asia Pacific Global Wind Power Market Revenue Share (%), by Location 2024 & 2032
- Figure 46: Asia Pacific Global Wind Power Market Volume Share (%), by Location 2024 & 2032
- Figure 47: Asia Pacific Global Wind Power Market Revenue (Million), by Country 2024 & 2032
- Figure 48: Asia Pacific Global Wind Power Market Volume (Thousand), by Country 2024 & 2032
- Figure 49: Asia Pacific Global Wind Power Market Revenue Share (%), by Country 2024 & 2032
- Figure 50: Asia Pacific Global Wind Power Market Volume Share (%), by Country 2024 & 2032
- Figure 51: Rest of Asia Pacific Global Wind Power Market Revenue (Million), by Location 2024 & 2032
- Figure 52: Rest of Asia Pacific Global Wind Power Market Volume (Thousand), by Location 2024 & 2032
- Figure 53: Rest of Asia Pacific Global Wind Power Market Revenue Share (%), by Location 2024 & 2032
- Figure 54: Rest of Asia Pacific Global Wind Power Market Volume Share (%), by Location 2024 & 2032
- Figure 55: Rest of Asia Pacific Global Wind Power Market Revenue (Million), by Country 2024 & 2032
- Figure 56: Rest of Asia Pacific Global Wind Power Market Volume (Thousand), by Country 2024 & 2032
- Figure 57: Rest of Asia Pacific Global Wind Power Market Revenue Share (%), by Country 2024 & 2032
- Figure 58: Rest of Asia Pacific Global Wind Power Market Volume Share (%), by Country 2024 & 2032
- Figure 59: Middle East and Africa Global Wind Power Market Revenue (Million), by Location 2024 & 2032
- Figure 60: Middle East and Africa Global Wind Power Market Volume (Thousand), by Location 2024 & 2032
- Figure 61: Middle East and Africa Global Wind Power Market Revenue Share (%), by Location 2024 & 2032
- Figure 62: Middle East and Africa Global Wind Power Market Volume Share (%), by Location 2024 & 2032
- Figure 63: Middle East and Africa Global Wind Power Market Revenue (Million), by Country 2024 & 2032
- Figure 64: Middle East and Africa Global Wind Power Market Volume (Thousand), by Country 2024 & 2032
- Figure 65: Middle East and Africa Global Wind Power Market Revenue Share (%), by Country 2024 & 2032
- Figure 66: Middle East and Africa Global Wind Power Market Volume Share (%), by Country 2024 & 2032
- Figure 67: Rest of Middle East and Africa Global Wind Power Market Revenue (Million), by Location 2024 & 2032
- Figure 68: Rest of Middle East and Africa Global Wind Power Market Volume (Thousand), by Location 2024 & 2032
- Figure 69: Rest of Middle East and Africa Global Wind Power Market Revenue Share (%), by Location 2024 & 2032
- Figure 70: Rest of Middle East and Africa Global Wind Power Market Volume Share (%), by Location 2024 & 2032
- Figure 71: Rest of Middle East and Africa Global Wind Power Market Revenue (Million), by Country 2024 & 2032
- Figure 72: Rest of Middle East and Africa Global Wind Power Market Volume (Thousand), by Country 2024 & 2032
- Figure 73: Rest of Middle East and Africa Global Wind Power Market Revenue Share (%), by Country 2024 & 2032
- Figure 74: Rest of Middle East and Africa Global Wind Power Market Volume Share (%), by Country 2024 & 2032
- Figure 75: South America Global Wind Power Market Revenue (Million), by Location 2024 & 2032
- Figure 76: South America Global Wind Power Market Volume (Thousand), by Location 2024 & 2032
- Figure 77: South America Global Wind Power Market Revenue Share (%), by Location 2024 & 2032
- Figure 78: South America Global Wind Power Market Volume Share (%), by Location 2024 & 2032
- Figure 79: South America Global Wind Power Market Revenue (Million), by Country 2024 & 2032
- Figure 80: South America Global Wind Power Market Volume (Thousand), by Country 2024 & 2032
- Figure 81: South America Global Wind Power Market Revenue Share (%), by Country 2024 & 2032
- Figure 82: South America Global Wind Power Market Volume Share (%), by Country 2024 & 2032
List of Tables
- Table 1: Global Wind Power Market Revenue Million Forecast, by Region 2019 & 2032
- Table 2: Global Wind Power Market Volume Thousand Forecast, by Region 2019 & 2032
- Table 3: Global Wind Power Market Revenue Million Forecast, by Location 2019 & 2032
- Table 4: Global Wind Power Market Volume Thousand Forecast, by Location 2019 & 2032
- Table 5: Global Wind Power Market Revenue Million Forecast, by Region 2019 & 2032
- Table 6: Global Wind Power Market Volume Thousand Forecast, by Region 2019 & 2032
- Table 7: Global Wind Power Market Revenue Million Forecast, by Country 2019 & 2032
- Table 8: Global Wind Power Market Volume Thousand Forecast, by Country 2019 & 2032
- Table 9: United States Global Wind Power Market Revenue (Million) Forecast, by Application 2019 & 2032
- Table 10: United States Global Wind Power Market Volume (Thousand) Forecast, by Application 2019 & 2032
- Table 11: Canada Global Wind Power Market Revenue (Million) Forecast, by Application 2019 & 2032
- Table 12: Canada Global Wind Power Market Volume (Thousand) Forecast, by Application 2019 & 2032
- Table 13: Mexico Global Wind Power Market Revenue (Million) Forecast, by Application 2019 & 2032
- Table 14: Mexico Global Wind Power Market Volume (Thousand) Forecast, by Application 2019 & 2032
- Table 15: Global Wind Power Market Revenue Million Forecast, by Country 2019 & 2032
- Table 16: Global Wind Power Market Volume Thousand Forecast, by Country 2019 & 2032
- Table 17: Germany Global Wind Power Market Revenue (Million) Forecast, by Application 2019 & 2032
- Table 18: Germany Global Wind Power Market Volume (Thousand) Forecast, by Application 2019 & 2032
- Table 19: United Kingdom Global Wind Power Market Revenue (Million) Forecast, by Application 2019 & 2032
- Table 20: United Kingdom Global Wind Power Market Volume (Thousand) Forecast, by Application 2019 & 2032
- Table 21: France Global Wind Power Market Revenue (Million) Forecast, by Application 2019 & 2032
- Table 22: France Global Wind Power Market Volume (Thousand) Forecast, by Application 2019 & 2032
- Table 23: Spain Global Wind Power Market Revenue (Million) Forecast, by Application 2019 & 2032
- Table 24: Spain Global Wind Power Market Volume (Thousand) Forecast, by Application 2019 & 2032
- Table 25: Italy Global Wind Power Market Revenue (Million) Forecast, by Application 2019 & 2032
- Table 26: Italy Global Wind Power Market Volume (Thousand) Forecast, by Application 2019 & 2032
- Table 27: Spain Global Wind Power Market Revenue (Million) Forecast, by Application 2019 & 2032
- Table 28: Spain Global Wind Power Market Volume (Thousand) Forecast, by Application 2019 & 2032
- Table 29: Belgium Global Wind Power Market Revenue (Million) Forecast, by Application 2019 & 2032
- Table 30: Belgium Global Wind Power Market Volume (Thousand) Forecast, by Application 2019 & 2032
- Table 31: Netherland Global Wind Power Market Revenue (Million) Forecast, by Application 2019 & 2032
- Table 32: Netherland Global Wind Power Market Volume (Thousand) Forecast, by Application 2019 & 2032
- Table 33: Nordics Global Wind Power Market Revenue (Million) Forecast, by Application 2019 & 2032
- Table 34: Nordics Global Wind Power Market Volume (Thousand) Forecast, by Application 2019 & 2032
- Table 35: Rest of Europe Global Wind Power Market Revenue (Million) Forecast, by Application 2019 & 2032
- Table 36: Rest of Europe Global Wind Power Market Volume (Thousand) Forecast, by Application 2019 & 2032
- Table 37: Global Wind Power Market Revenue Million Forecast, by Country 2019 & 2032
- Table 38: Global Wind Power Market Volume Thousand Forecast, by Country 2019 & 2032
- Table 39: China Global Wind Power Market Revenue (Million) Forecast, by Application 2019 & 2032
- Table 40: China Global Wind Power Market Volume (Thousand) Forecast, by Application 2019 & 2032
- Table 41: Japan Global Wind Power Market Revenue (Million) Forecast, by Application 2019 & 2032
- Table 42: Japan Global Wind Power Market Volume (Thousand) Forecast, by Application 2019 & 2032
- Table 43: India Global Wind Power Market Revenue (Million) Forecast, by Application 2019 & 2032
- Table 44: India Global Wind Power Market Volume (Thousand) Forecast, by Application 2019 & 2032
- Table 45: South Korea Global Wind Power Market Revenue (Million) Forecast, by Application 2019 & 2032
- Table 46: South Korea Global Wind Power Market Volume (Thousand) Forecast, by Application 2019 & 2032
- Table 47: Southeast Asia Global Wind Power Market Revenue (Million) Forecast, by Application 2019 & 2032
- Table 48: Southeast Asia Global Wind Power Market Volume (Thousand) Forecast, by Application 2019 & 2032
- Table 49: Australia Global Wind Power Market Revenue (Million) Forecast, by Application 2019 & 2032
- Table 50: Australia Global Wind Power Market Volume (Thousand) Forecast, by Application 2019 & 2032
- Table 51: Indonesia Global Wind Power Market Revenue (Million) Forecast, by Application 2019 & 2032
- Table 52: Indonesia Global Wind Power Market Volume (Thousand) Forecast, by Application 2019 & 2032
- Table 53: Phillipes Global Wind Power Market Revenue (Million) Forecast, by Application 2019 & 2032
- Table 54: Phillipes Global Wind Power Market Volume (Thousand) Forecast, by Application 2019 & 2032
- Table 55: Singapore Global Wind Power Market Revenue (Million) Forecast, by Application 2019 & 2032
- Table 56: Singapore Global Wind Power Market Volume (Thousand) Forecast, by Application 2019 & 2032
- Table 57: Thailandc Global Wind Power Market Revenue (Million) Forecast, by Application 2019 & 2032
- Table 58: Thailandc Global Wind Power Market Volume (Thousand) Forecast, by Application 2019 & 2032
- Table 59: Rest of Asia Pacific Global Wind Power Market Revenue (Million) Forecast, by Application 2019 & 2032
- Table 60: Rest of Asia Pacific Global Wind Power Market Volume (Thousand) Forecast, by Application 2019 & 2032
- Table 61: Global Wind Power Market Revenue Million Forecast, by Country 2019 & 2032
- Table 62: Global Wind Power Market Volume Thousand Forecast, by Country 2019 & 2032
- Table 63: Brazil Global Wind Power Market Revenue (Million) Forecast, by Application 2019 & 2032
- Table 64: Brazil Global Wind Power Market Volume (Thousand) Forecast, by Application 2019 & 2032
- Table 65: Argentina Global Wind Power Market Revenue (Million) Forecast, by Application 2019 & 2032
- Table 66: Argentina Global Wind Power Market Volume (Thousand) Forecast, by Application 2019 & 2032
- Table 67: Peru Global Wind Power Market Revenue (Million) Forecast, by Application 2019 & 2032
- Table 68: Peru Global Wind Power Market Volume (Thousand) Forecast, by Application 2019 & 2032
- Table 69: Chile Global Wind Power Market Revenue (Million) Forecast, by Application 2019 & 2032
- Table 70: Chile Global Wind Power Market Volume (Thousand) Forecast, by Application 2019 & 2032
- Table 71: Colombia Global Wind Power Market Revenue (Million) Forecast, by Application 2019 & 2032
- Table 72: Colombia Global Wind Power Market Volume (Thousand) Forecast, by Application 2019 & 2032
- Table 73: Ecuador Global Wind Power Market Revenue (Million) Forecast, by Application 2019 & 2032
- Table 74: Ecuador Global Wind Power Market Volume (Thousand) Forecast, by Application 2019 & 2032
- Table 75: Venezuela Global Wind Power Market Revenue (Million) Forecast, by Application 2019 & 2032
- Table 76: Venezuela Global Wind Power Market Volume (Thousand) Forecast, by Application 2019 & 2032
- Table 77: Rest of South America Global Wind Power Market Revenue (Million) Forecast, by Application 2019 & 2032
- Table 78: Rest of South America Global Wind Power Market Volume (Thousand) Forecast, by Application 2019 & 2032
- Table 79: Global Wind Power Market Revenue Million Forecast, by Country 2019 & 2032
- Table 80: Global Wind Power Market Volume Thousand Forecast, by Country 2019 & 2032
- Table 81: United States Global Wind Power Market Revenue (Million) Forecast, by Application 2019 & 2032
- Table 82: United States Global Wind Power Market Volume (Thousand) Forecast, by Application 2019 & 2032
- Table 83: Canada Global Wind Power Market Revenue (Million) Forecast, by Application 2019 & 2032
- Table 84: Canada Global Wind Power Market Volume (Thousand) Forecast, by Application 2019 & 2032
- Table 85: Mexico Global Wind Power Market Revenue (Million) Forecast, by Application 2019 & 2032
- Table 86: Mexico Global Wind Power Market Volume (Thousand) Forecast, by Application 2019 & 2032
- Table 87: Global Wind Power Market Revenue Million Forecast, by Country 2019 & 2032
- Table 88: Global Wind Power Market Volume Thousand Forecast, by Country 2019 & 2032
- Table 89: United Arab Emirates Global Wind Power Market Revenue (Million) Forecast, by Application 2019 & 2032
- Table 90: United Arab Emirates Global Wind Power Market Volume (Thousand) Forecast, by Application 2019 & 2032
- Table 91: Saudi Arabia Global Wind Power Market Revenue (Million) Forecast, by Application 2019 & 2032
- Table 92: Saudi Arabia Global Wind Power Market Volume (Thousand) Forecast, by Application 2019 & 2032
- Table 93: South Africa Global Wind Power Market Revenue (Million) Forecast, by Application 2019 & 2032
- Table 94: South Africa Global Wind Power Market Volume (Thousand) Forecast, by Application 2019 & 2032
- Table 95: Rest of Middle East and Africa Global Wind Power Market Revenue (Million) Forecast, by Application 2019 & 2032
- Table 96: Rest of Middle East and Africa Global Wind Power Market Volume (Thousand) Forecast, by Application 2019 & 2032
- Table 97: Global Wind Power Market Revenue Million Forecast, by Location 2019 & 2032
- Table 98: Global Wind Power Market Volume Thousand Forecast, by Location 2019 & 2032
- Table 99: Global Wind Power Market Revenue Million Forecast, by Country 2019 & 2032
- Table 100: Global Wind Power Market Volume Thousand Forecast, by Country 2019 & 2032
- Table 101: United States Global Wind Power Market Revenue (Million) Forecast, by Application 2019 & 2032
- Table 102: United States Global Wind Power Market Volume (Thousand) Forecast, by Application 2019 & 2032
- Table 103: Canada Global Wind Power Market Revenue (Million) Forecast, by Application 2019 & 2032
- Table 104: Canada Global Wind Power Market Volume (Thousand) Forecast, by Application 2019 & 2032
- Table 105: Rest of North America Global Wind Power Market Revenue (Million) Forecast, by Application 2019 & 2032
- Table 106: Rest of North America Global Wind Power Market Volume (Thousand) Forecast, by Application 2019 & 2032
- Table 107: Global Wind Power Market Revenue Million Forecast, by Location 2019 & 2032
- Table 108: Global Wind Power Market Volume Thousand Forecast, by Location 2019 & 2032
- Table 109: Global Wind Power Market Revenue Million Forecast, by Country 2019 & 2032
- Table 110: Global Wind Power Market Volume Thousand Forecast, by Country 2019 & 2032
- Table 111: United Kingdom Global Wind Power Market Revenue (Million) Forecast, by Application 2019 & 2032
- Table 112: United Kingdom Global Wind Power Market Volume (Thousand) Forecast, by Application 2019 & 2032
- Table 113: France Global Wind Power Market Revenue (Million) Forecast, by Application 2019 & 2032
- Table 114: France Global Wind Power Market Volume (Thousand) Forecast, by Application 2019 & 2032
- Table 115: Norway Global Wind Power Market Revenue (Million) Forecast, by Application 2019 & 2032
- Table 116: Norway Global Wind Power Market Volume (Thousand) Forecast, by Application 2019 & 2032
- Table 117: Germany Global Wind Power Market Revenue (Million) Forecast, by Application 2019 & 2032
- Table 118: Germany Global Wind Power Market Volume (Thousand) Forecast, by Application 2019 & 2032
- Table 119: Spain Global Wind Power Market Revenue (Million) Forecast, by Application 2019 & 2032
- Table 120: Spain Global Wind Power Market Volume (Thousand) Forecast, by Application 2019 & 2032
- Table 121: Turkey Global Wind Power Market Revenue (Million) Forecast, by Application 2019 & 2032
- Table 122: Turkey Global Wind Power Market Volume (Thousand) Forecast, by Application 2019 & 2032
- Table 123: Russia Global Wind Power Market Revenue (Million) Forecast, by Application 2019 & 2032
- Table 124: Russia Global Wind Power Market Volume (Thousand) Forecast, by Application 2019 & 2032
- Table 125: NORDIC Global Wind Power Market Revenue (Million) Forecast, by Application 2019 & 2032
- Table 126: NORDIC Global Wind Power Market Volume (Thousand) Forecast, by Application 2019 & 2032
- Table 127: Rest of Europe Global Wind Power Market Revenue (Million) Forecast, by Application 2019 & 2032
- Table 128: Rest of Europe Global Wind Power Market Volume (Thousand) Forecast, by Application 2019 & 2032
- Table 129: Global Wind Power Market Revenue Million Forecast, by Location 2019 & 2032
- Table 130: Global Wind Power Market Volume Thousand Forecast, by Location 2019 & 2032
- Table 131: Global Wind Power Market Revenue Million Forecast, by Country 2019 & 2032
- Table 132: Global Wind Power Market Volume Thousand Forecast, by Country 2019 & 2032
- Table 133: China Global Wind Power Market Revenue (Million) Forecast, by Application 2019 & 2032
- Table 134: China Global Wind Power Market Volume (Thousand) Forecast, by Application 2019 & 2032
- Table 135: India Global Wind Power Market Revenue (Million) Forecast, by Application 2019 & 2032
- Table 136: India Global Wind Power Market Volume (Thousand) Forecast, by Application 2019 & 2032
- Table 137: Japan Global Wind Power Market Revenue (Million) Forecast, by Application 2019 & 2032
- Table 138: Japan Global Wind Power Market Volume (Thousand) Forecast, by Application 2019 & 2032
- Table 139: Malaysia Global Wind Power Market Revenue (Million) Forecast, by Application 2019 & 2032
- Table 140: Malaysia Global Wind Power Market Volume (Thousand) Forecast, by Application 2019 & 2032
- Table 141: Thailand Global Wind Power Market Revenue (Million) Forecast, by Application 2019 & 2032
- Table 142: Thailand Global Wind Power Market Volume (Thousand) Forecast, by Application 2019 & 2032
- Table 143: Indonesia Global Wind Power Market Revenue (Million) Forecast, by Application 2019 & 2032
- Table 144: Indonesia Global Wind Power Market Volume (Thousand) Forecast, by Application 2019 & 2032
- Table 145: Vietnam Global Wind Power Market Revenue (Million) Forecast, by Application 2019 & 2032
- Table 146: Vietnam Global Wind Power Market Volume (Thousand) Forecast, by Application 2019 & 2032
- Table 147: Global Wind Power Market Revenue Million Forecast, by Location 2019 & 2032
- Table 148: Global Wind Power Market Volume Thousand Forecast, by Location 2019 & 2032
- Table 149: Global Wind Power Market Revenue Million Forecast, by Country 2019 & 2032
- Table 150: Global Wind Power Market Volume Thousand Forecast, by Country 2019 & 2032
- Table 151: Global Wind Power Market Revenue Million Forecast, by Location 2019 & 2032
- Table 152: Global Wind Power Market Volume Thousand Forecast, by Location 2019 & 2032
- Table 153: Global Wind Power Market Revenue Million Forecast, by Country 2019 & 2032
- Table 154: Global Wind Power Market Volume Thousand Forecast, by Country 2019 & 2032
- Table 155: United Arab Emirates Global Wind Power Market Revenue (Million) Forecast, by Application 2019 & 2032
- Table 156: United Arab Emirates Global Wind Power Market Volume (Thousand) Forecast, by Application 2019 & 2032
- Table 157: Egypt Global Wind Power Market Revenue (Million) Forecast, by Application 2019 & 2032
- Table 158: Egypt Global Wind Power Market Volume (Thousand) Forecast, by Application 2019 & 2032
- Table 159: Saudi Arabia Global Wind Power Market Revenue (Million) Forecast, by Application 2019 & 2032
- Table 160: Saudi Arabia Global Wind Power Market Volume (Thousand) Forecast, by Application 2019 & 2032
- Table 161: Nigeria Global Wind Power Market Revenue (Million) Forecast, by Application 2019 & 2032
- Table 162: Nigeria Global Wind Power Market Volume (Thousand) Forecast, by Application 2019 & 2032
- Table 163: Qatar Global Wind Power Market Revenue (Million) Forecast, by Application 2019 & 2032
- Table 164: Qatar Global Wind Power Market Volume (Thousand) Forecast, by Application 2019 & 2032
- Table 165: Global Wind Power Market Revenue Million Forecast, by Location 2019 & 2032
- Table 166: Global Wind Power Market Volume Thousand Forecast, by Location 2019 & 2032
- Table 167: Global Wind Power Market Revenue Million Forecast, by Country 2019 & 2032
- Table 168: Global Wind Power Market Volume Thousand Forecast, by Country 2019 & 2032
- Table 169: Global Wind Power Market Revenue Million Forecast, by Location 2019 & 2032
- Table 170: Global Wind Power Market Volume Thousand Forecast, by Location 2019 & 2032
- Table 171: Global Wind Power Market Revenue Million Forecast, by Country 2019 & 2032
- Table 172: Global Wind Power Market Volume Thousand Forecast, by Country 2019 & 2032
- Table 173: Brazil Global Wind Power Market Revenue (Million) Forecast, by Application 2019 & 2032
- Table 174: Brazil Global Wind Power Market Volume (Thousand) Forecast, by Application 2019 & 2032
- Table 175: Chile Global Wind Power Market Revenue (Million) Forecast, by Application 2019 & 2032
- Table 176: Chile Global Wind Power Market Volume (Thousand) Forecast, by Application 2019 & 2032
- Table 177: Argentina Global Wind Power Market Revenue (Million) Forecast, by Application 2019 & 2032
- Table 178: Argentina Global Wind Power Market Volume (Thousand) Forecast, by Application 2019 & 2032
- Table 179: Colombia Global Wind Power Market Revenue (Million) Forecast, by Application 2019 & 2032
- Table 180: Colombia Global Wind Power Market Volume (Thousand) Forecast, by Application 2019 & 2032
- Table 181: Rest of South America Global Wind Power Market Revenue (Million) Forecast, by Application 2019 & 2032
- Table 182: Rest of South America Global Wind Power Market Volume (Thousand) Forecast, by Application 2019 & 2032
Frequently Asked Questions
1. What is the projected Compound Annual Growth Rate (CAGR) of the Global Wind Power Market?
The projected CAGR is approximately 27.87%.
2. Which companies are prominent players in the Global Wind Power Market?
Key companies in the market include 5 Siemens Gamesa Renewable Energy SA, 6 Suzlon Energy Limited, 7 Vestas Wind Systems AS, Equipment Suppliers, 2 Duke Energy Corporation, 6 E ON SE, 5 NextEra Energy Inc, 4 Xinjiang Goldwind Science & Technology Co Ltd (Goldwind), 2 Envision Energy, 4 Orsted AS, Wind Farm Operators, 3 EDF SA, 8 Dongfang Electric Corporation*List Not Exhaustive 6 5 Market Share/Ranking Analysi, 3 General Electric Company, 1 Aerodyn Energiesysteme GmbH, 1 Acciona Energia SA.
3. What are the main segments of the Global Wind Power Market?
The market segments include Location.
4. Can you provide details about the market size?
The market size is estimated to be USD XX Million as of 2022.
5. What are some drivers contributing to market growth?
4.; Increasing Investments in Offshore Wind Power Projects4.; Supportive Government Policies.
6. What are the notable trends driving market growth?
The Offshore Wind Power Sector is Expected to Witness Significant Growth.
7. Are there any restraints impacting market growth?
4.; Increasing Adopting of Alternative Clean Energy Sources (Ex: Solar. Hydro).
8. Can you provide examples of recent developments in the market?
April 2024: Mahindra Group, a conglomerate that spans technology to tractor manufacture, announced an investment of INR 12 billion (USD 144 million) in the establishment of solar and wind energy projects. The renewable projects are likely to be developed by Mahindra Susten, the group's renewable, with a hybrid capacity of 150 megawatts (MW).
9. What pricing options are available for accessing the report?
Pricing options include single-user, multi-user, and enterprise licenses priced at USD 4750, USD 5250, and USD 8750 respectively.
10. Is the market size provided in terms of value or volume?
The market size is provided in terms of value, measured in Million and volume, measured in Thousand.
11. Are there any specific market keywords associated with the report?
Yes, the market keyword associated with the report is "Global Wind Power Market," which aids in identifying and referencing the specific market segment covered.
12. How do I determine which pricing option suits my needs best?
The pricing options vary based on user requirements and access needs. Individual users may opt for single-user licenses, while businesses requiring broader access may choose multi-user or enterprise licenses for cost-effective access to the report.
13. Are there any additional resources or data provided in the Global Wind Power Market report?
While the report offers comprehensive insights, it's advisable to review the specific contents or supplementary materials provided to ascertain if additional resources or data are available.
14. How can I stay updated on further developments or reports in the Global Wind Power Market?
To stay informed about further developments, trends, and reports in the Global Wind Power Market, consider subscribing to industry newsletters, following relevant companies and organizations, or regularly checking reputable industry news sources and publications.
Methodology
Step 1 - Identification of Relevant Samples Size from Population Database


Step 2 - Approaches for Defining Global Market Size (Value, Volume* & Price*)

Note*: In applicable scenarios
Step 3 - Data Sources
Primary Research
- Web Analytics
- Survey Reports
- Research Institute
- Latest Research Reports
- Opinion Leaders
Secondary Research
- Annual Reports
- White Paper
- Latest Press Release
- Industry Association
- Paid Database
- Investor Presentations

Step 4 - Data Triangulation
Involves using different sources of information in order to increase the validity of a study
These sources are likely to be stakeholders in a program - participants, other researchers, program staff, other community members, and so on.
Then we put all data in single framework & apply various statistical tools to find out the dynamic on the market.
During the analysis stage, feedback from the stakeholder groups would be compared to determine areas of agreement as well as areas of divergence


