
Key Insights
The global gene expression analysis market is experiencing robust growth, driven by the increasing prevalence of chronic diseases, the rising demand for personalized medicine, and advancements in sequencing technologies. The market's expansion is fueled by a surge in research activities focused on understanding complex biological processes and developing targeted therapies. The market is segmented by end-user (drug discovery & development, diagnostic laboratories, academic research centers), technology (PCR, NGS, microarrays), and product type (instruments, reagents & consumables, services). The high CAGR of 8.90% indicates significant future potential. While the base year is 2025, the historical period (2019-2024) suggests a steady growth trajectory that is projected to continue through 2033. The leading companies, including Thermo Fisher Scientific, Illumina, and QIAGEN, are investing heavily in R&D to develop innovative technologies and expand their market share. North America currently holds a dominant position, benefiting from robust healthcare infrastructure and substantial research funding. However, the Asia-Pacific region is expected to witness the fastest growth, driven by increasing healthcare expenditure and a growing number of research institutions. The market faces some restraints, such as the high cost of advanced technologies and stringent regulatory approvals. However, the increasing availability of government grants and collaborations between research institutions and pharmaceutical companies are expected to mitigate these challenges.
The market's future growth will largely depend on technological advancements, particularly in NGS and microarrays, which offer higher throughput and more comprehensive data analysis. Furthermore, the development of cost-effective and user-friendly gene expression analysis tools will broaden accessibility and stimulate wider adoption across diverse research and clinical settings. The ongoing focus on personalized medicine will further fuel demand for accurate and efficient gene expression profiling, making the market a promising area for investment and innovation. Factors such as expanding genomic databases and the growing understanding of gene-disease relationships are also poised to significantly contribute to market growth in the coming years. Competitive pressures are expected to drive innovation and improve the cost-effectiveness of gene expression analysis technologies.
This comprehensive report provides an in-depth analysis of the global gene expression analysis market, encompassing market dynamics, growth trends, regional dominance, product landscape, key challenges and opportunities, and prominent players. The report covers the period from 2019 to 2033, with 2025 serving as the base and estimated year. The study meticulously examines parent markets (e.g., genomics, molecular diagnostics) and child markets (e.g., specific applications within drug discovery, diagnostics) to offer a holistic view of this rapidly evolving sector. The market value is presented in Million USD.
Global Gene Expression Analysis Market Dynamics & Structure
The global gene expression analysis market is characterized by moderate concentration, with key players like Illumina, Thermo Fisher Scientific, and QIAGEN holding significant market share (estimated at xx% collectively in 2025). Technological innovation, particularly in Next-Generation Sequencing (NGS) and microarrays, is a primary growth driver. Stringent regulatory frameworks, particularly concerning data privacy and clinical diagnostics, influence market access and adoption. The market also faces competition from alternative technologies and diagnostic methods. M&A activity remains steady, with a noticeable increase in strategic partnerships and licensing agreements focused on expanding product portfolios and gaining access to novel technologies.
- Market Concentration: Moderately concentrated, with top players holding xx% market share in 2025.
- Technological Innovation: NGS and microarrays drive market growth; ongoing development of high-throughput technologies and improved data analysis tools.
- Regulatory Framework: Stringent regulations regarding data privacy and clinical validation impact market expansion.
- Competitive Substitutes: Traditional diagnostic methods and emerging technologies pose competitive pressure.
- M&A Trends: Steady M&A activity; strategic partnerships and licensing agreements are becoming increasingly prevalent.
- Innovation Barriers: High R&D costs, complex regulatory pathways, and the need for skilled professionals.
Global Gene Expression Analysis Market Growth Trends & Insights
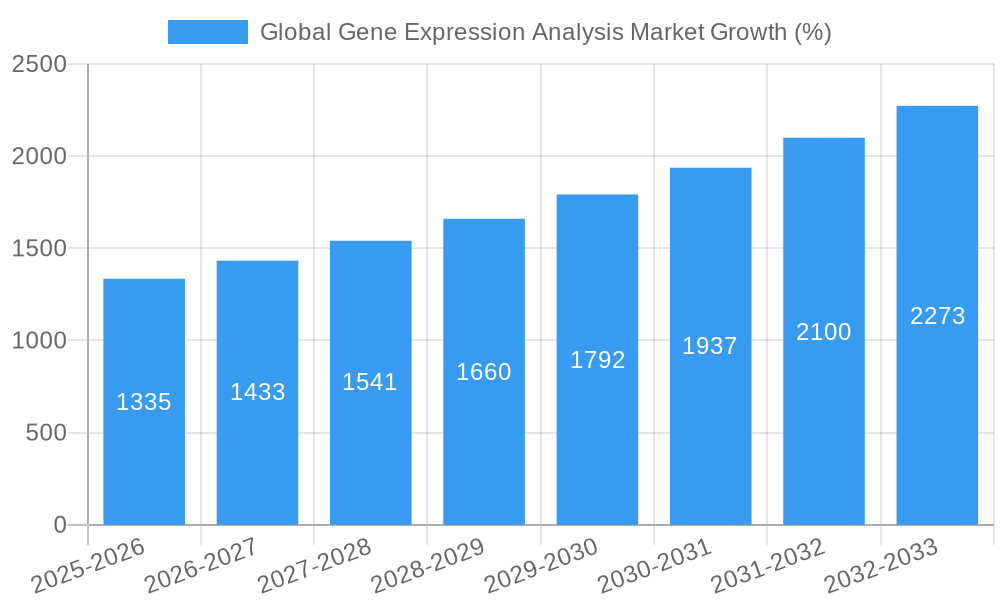
The global gene expression analysis market is experiencing robust growth, driven by the increasing prevalence of chronic diseases, rising demand for personalized medicine, and advancements in genomic technologies. The market size, estimated at xx Million in 2025, is projected to reach xx Million by 2033, exhibiting a CAGR of xx% during the forecast period (2025-2033). This growth is fueled by increasing adoption rates in drug discovery and development, diagnostic laboratories, and academic research centers. Technological disruptions, such as the introduction of more affordable and user-friendly NGS platforms, and shifts in consumer behavior towards proactive healthcare are further accelerating market growth. Market penetration of NGS technology is steadily increasing in various healthcare settings.
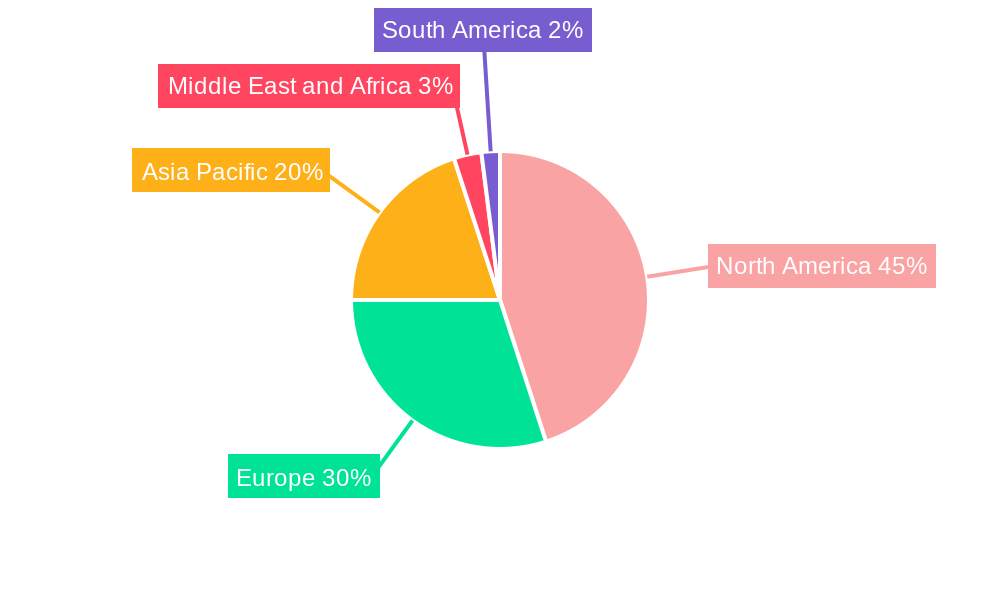
Dominant Regions, Countries, or Segments in Global Gene Expression Analysis Market
North America currently dominates the global gene expression analysis market, driven by strong R&D investment, a well-established healthcare infrastructure, and high adoption rates across various end-user segments. Within this region, the U.S. holds the largest market share. Europe is another significant market, followed by Asia-Pacific, exhibiting substantial growth potential due to increasing healthcare spending and rising awareness of advanced diagnostic techniques.
By End-user:
- Drug Discovery & Development: Largest segment due to its crucial role in target identification and validation.
- Diagnostic Laboratories: Significant growth driven by increased demand for faster and more accurate diagnostic tests.
- Academic Research Centers: Steady growth supported by ongoing research efforts aimed at improving genomic understanding.
By Technology:
- Next Generation Sequencing (NGS): Fastest-growing segment due to its high throughput and comprehensive information yield.
- Polymerase Chain Reaction (PCR): Mature technology, still holding significant market share due to its reliability and widespread availability.
- Microarrays: Established technology, maintaining a significant market share in specific applications.
By Product Type:
- Reagents and Consumables: Largest segment due to high consumption rates and the need for regular replenishment.
- Instruments: Significant market value, driven by advancements in technology and increased demand for high-throughput platforms.
- Services: Growing segment, driven by increasing demand for bioinformatics analysis and data interpretation.
Global Gene Expression Analysis Market Product Landscape
The gene expression analysis market offers a diverse range of products, including instruments (e.g., sequencers, PCR machines, microarray scanners), reagents and consumables (e.g., primers, probes, kits), and services (e.g., bioinformatics analysis, data interpretation, assay development). Recent innovations focus on improving throughput, accuracy, and cost-effectiveness. Unique selling propositions revolve around ease of use, data analysis capabilities, and integration with existing workflows. Key technological advancements include the development of miniaturized platforms, portable devices, and cloud-based data analysis tools.
Key Drivers, Barriers & Challenges in Global Gene Expression Analysis Market
Key Drivers:
- Rising prevalence of chronic diseases: Increased demand for early and accurate diagnostics.
- Growing adoption of personalized medicine: Tailored treatments based on individual genetic profiles.
- Technological advancements: Improved speed, accuracy, and cost-effectiveness of gene expression analysis technologies.
Key Challenges and Restraints:
- High cost of instruments and reagents: Limiting affordability in resource-constrained settings.
- Complex data analysis: Requires specialized expertise and sophisticated software.
- Regulatory hurdles and data privacy concerns: Slowing down market penetration in certain regions.
- Supply chain disruptions: Impacting availability and costs of essential components.
Emerging Opportunities in Global Gene Expression Analysis Market
- Liquid biopsies: Non-invasive gene expression analysis for early cancer detection and monitoring.
- Point-of-care diagnostics: Rapid and accessible gene expression analysis at the patient's bedside.
- Expansion into emerging markets: Significant untapped potential in developing countries.
- Development of novel applications: Expanding use cases in agriculture, environmental monitoring, and forensics.
Growth Accelerators in the Global Gene Expression Analysis Market Industry
Long-term growth in the gene expression analysis market will be driven by continued technological breakthroughs in sequencing technologies, further miniaturization of devices, and the development of more user-friendly software. Strategic partnerships between technology providers, research institutions, and pharmaceutical companies will play a crucial role in expanding market access and driving adoption. Furthermore, market expansion strategies targeting under-served regions and the development of new applications will fuel long-term market growth.
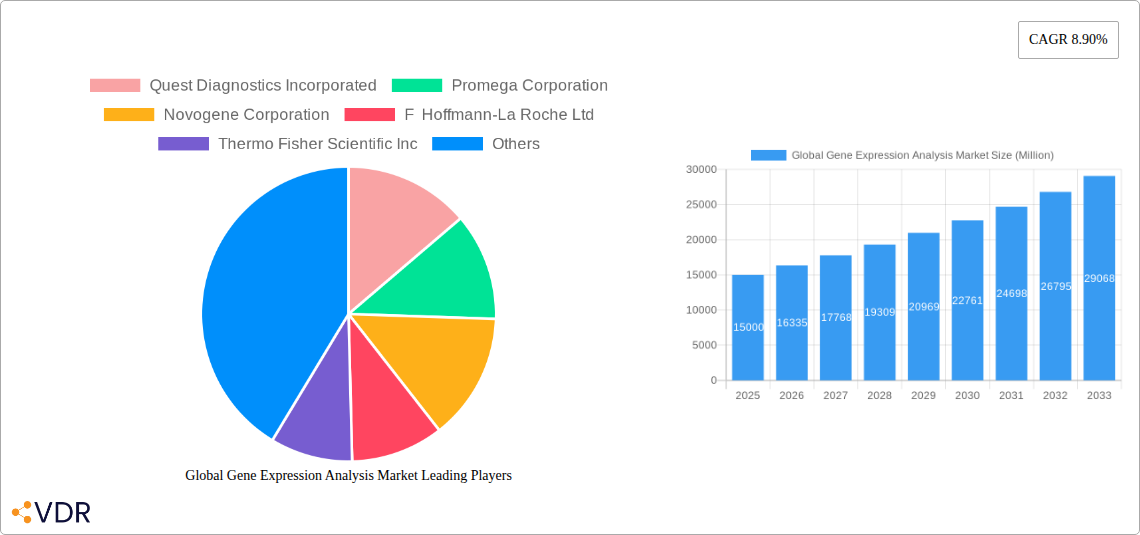
Key Players Shaping the Global Gene Expression Analysis Market Market
- Quest Diagnostics Incorporated
- Promega Corporation
- Novogene Corporation
- F Hoffmann-La Roche Ltd
- Thermo Fisher Scientific Inc
- Bio-Rad Laboratories
- Luminex Corporation
- PerkinElmer Inc
- Illumina Inc
- QIAGEN
- Agilent Technologies
Notable Milestones in Global Gene Expression Analysis Market Sector
- January 2023: QIAGEN launched QIAGEN CLC Genomics Workbench Premium, significantly improving NGS data analysis speed.
- October 2022: Kite (Gilead) licensed Refuge Biotechnologies' gene expression platform for blood cancer therapy development.
- March 2022: The University of Mississippi Medical Center installed a clinical NGS machine, enhancing cancer diagnostics.
In-Depth Global Gene Expression Analysis Market Market Outlook
The future of the gene expression analysis market is bright, with significant growth potential driven by ongoing technological advancements, expanding applications across various sectors, and the increasing adoption of personalized medicine. Strategic opportunities exist for companies that can effectively address the challenges related to cost, data analysis, and regulatory compliance. The focus on developing user-friendly platforms and streamlining workflows will be key to unlocking further market penetration and driving long-term success.
Global Gene Expression Analysis Market Segmentation
-
1. Technology
- 1.1. Polymerase Chain Reaction (PCR)
- 1.2. Next Generation Sequencing (NGS)
- 1.3. Microarrays
- 1.4. Others
-
2. Product Type
- 2.1. Instruments
- 2.2. Reagents and Consumables
- 2.3. Services
-
3. End-user
- 3.1. Drug Discovery & Development
- 3.2. Diagnostic Laboratories
- 3.3. Academic Research Centers
Global Gene Expression Analysis Market Segmentation By Geography
-
1. North America
- 1.1. United States
- 1.2. Canada
- 1.3. Mexico
-
2. Europe
- 2.1. Germany
- 2.2. United Kingdom
- 2.3. France
- 2.4. Italy
- 2.5. Spain
- 2.6. Rest of Europe
-
3. Asia Pacific
- 3.1. China
- 3.2. Japan
- 3.3. India
- 3.4. Australia
- 3.5. South Korea
- 3.6. Rest of Asia Pacific
-
4. Middle East and Africa
- 4.1. GCC
- 4.2. South Africa
- 4.3. Rest of Middle East and Africa
-
5. South America
- 5.1. Brazil
- 5.2. Argentina
- 5.3. Rest of South America
Global Gene Expression Analysis Market REPORT HIGHLIGHTS
| Aspects | Details |
|---|---|
| Study Period | 2019-2033 |
| Base Year | 2024 |
| Estimated Year | 2025 |
| Forecast Period | 2025-2033 |
| Historical Period | 2019-2024 |
| Growth Rate | CAGR of 8.90% from 2019-2033 |
| Segmentation |
|
Table of Contents
- 1. Introduction
- 1.1. Research Scope
- 1.2. Market Segmentation
- 1.3. Research Methodology
- 1.4. Definitions and Assumptions
- 2. Executive Summary
- 2.1. Introduction
- 3. Market Dynamics
- 3.1. Introduction
- 3.2. Market Drivers
- 3.2.1. Rapid Technological Advancement; Increased Government Funding towards Genomics; Growing Adoption of Personalized Medicine
- 3.3. Market Restrains
- 3.3.1. Lack of Skilled Labor; High Cost of the Instruments
- 3.4. Market Trends
- 3.4.1. Next Generation Sequencing (NGS) Segment Expects to Register a High CAGR in the Forecast Period
- 4. Market Factor Analysis
- 4.1. Porters Five Forces
- 4.2. Supply/Value Chain
- 4.3. PESTEL analysis
- 4.4. Market Entropy
- 4.5. Patent/Trademark Analysis
- 5. Global Gene Expression Analysis Market Analysis, Insights and Forecast, 2019-2031
- 5.1. Market Analysis, Insights and Forecast - by Technology
- 5.1.1. Polymerase Chain Reaction (PCR)
- 5.1.2. Next Generation Sequencing (NGS)
- 5.1.3. Microarrays
- 5.1.4. Others
- 5.2. Market Analysis, Insights and Forecast - by Product Type
- 5.2.1. Instruments
- 5.2.2. Reagents and Consumables
- 5.2.3. Services
- 5.3. Market Analysis, Insights and Forecast - by End-user
- 5.3.1. Drug Discovery & Development
- 5.3.2. Diagnostic Laboratories
- 5.3.3. Academic Research Centers
- 5.4. Market Analysis, Insights and Forecast - by Region
- 5.4.1. North America
- 5.4.2. Europe
- 5.4.3. Asia Pacific
- 5.4.4. Middle East and Africa
- 5.4.5. South America
- 5.1. Market Analysis, Insights and Forecast - by Technology
- 6. North America Global Gene Expression Analysis Market Analysis, Insights and Forecast, 2019-2031
- 6.1. Market Analysis, Insights and Forecast - by Technology
- 6.1.1. Polymerase Chain Reaction (PCR)
- 6.1.2. Next Generation Sequencing (NGS)
- 6.1.3. Microarrays
- 6.1.4. Others
- 6.2. Market Analysis, Insights and Forecast - by Product Type
- 6.2.1. Instruments
- 6.2.2. Reagents and Consumables
- 6.2.3. Services
- 6.3. Market Analysis, Insights and Forecast - by End-user
- 6.3.1. Drug Discovery & Development
- 6.3.2. Diagnostic Laboratories
- 6.3.3. Academic Research Centers
- 6.1. Market Analysis, Insights and Forecast - by Technology
- 7. Europe Global Gene Expression Analysis Market Analysis, Insights and Forecast, 2019-2031
- 7.1. Market Analysis, Insights and Forecast - by Technology
- 7.1.1. Polymerase Chain Reaction (PCR)
- 7.1.2. Next Generation Sequencing (NGS)
- 7.1.3. Microarrays
- 7.1.4. Others
- 7.2. Market Analysis, Insights and Forecast - by Product Type
- 7.2.1. Instruments
- 7.2.2. Reagents and Consumables
- 7.2.3. Services
- 7.3. Market Analysis, Insights and Forecast - by End-user
- 7.3.1. Drug Discovery & Development
- 7.3.2. Diagnostic Laboratories
- 7.3.3. Academic Research Centers
- 7.1. Market Analysis, Insights and Forecast - by Technology
- 8. Asia Pacific Global Gene Expression Analysis Market Analysis, Insights and Forecast, 2019-2031
- 8.1. Market Analysis, Insights and Forecast - by Technology
- 8.1.1. Polymerase Chain Reaction (PCR)
- 8.1.2. Next Generation Sequencing (NGS)
- 8.1.3. Microarrays
- 8.1.4. Others
- 8.2. Market Analysis, Insights and Forecast - by Product Type
- 8.2.1. Instruments
- 8.2.2. Reagents and Consumables
- 8.2.3. Services
- 8.3. Market Analysis, Insights and Forecast - by End-user
- 8.3.1. Drug Discovery & Development
- 8.3.2. Diagnostic Laboratories
- 8.3.3. Academic Research Centers
- 8.1. Market Analysis, Insights and Forecast - by Technology
- 9. Middle East and Africa Global Gene Expression Analysis Market Analysis, Insights and Forecast, 2019-2031
- 9.1. Market Analysis, Insights and Forecast - by Technology
- 9.1.1. Polymerase Chain Reaction (PCR)
- 9.1.2. Next Generation Sequencing (NGS)
- 9.1.3. Microarrays
- 9.1.4. Others
- 9.2. Market Analysis, Insights and Forecast - by Product Type
- 9.2.1. Instruments
- 9.2.2. Reagents and Consumables
- 9.2.3. Services
- 9.3. Market Analysis, Insights and Forecast - by End-user
- 9.3.1. Drug Discovery & Development
- 9.3.2. Diagnostic Laboratories
- 9.3.3. Academic Research Centers
- 9.1. Market Analysis, Insights and Forecast - by Technology
- 10. South America Global Gene Expression Analysis Market Analysis, Insights and Forecast, 2019-2031
- 10.1. Market Analysis, Insights and Forecast - by Technology
- 10.1.1. Polymerase Chain Reaction (PCR)
- 10.1.2. Next Generation Sequencing (NGS)
- 10.1.3. Microarrays
- 10.1.4. Others
- 10.2. Market Analysis, Insights and Forecast - by Product Type
- 10.2.1. Instruments
- 10.2.2. Reagents and Consumables
- 10.2.3. Services
- 10.3. Market Analysis, Insights and Forecast - by End-user
- 10.3.1. Drug Discovery & Development
- 10.3.2. Diagnostic Laboratories
- 10.3.3. Academic Research Centers
- 10.1. Market Analysis, Insights and Forecast - by Technology
- 11. North America Global Gene Expression Analysis Market Analysis, Insights and Forecast, 2019-2031
- 11.1. Market Analysis, Insights and Forecast - By Country/Sub-region
- 11.1.1 United States
- 11.1.2 Canada
- 11.1.3 Mexico
- 12. Europe Global Gene Expression Analysis Market Analysis, Insights and Forecast, 2019-2031
- 12.1. Market Analysis, Insights and Forecast - By Country/Sub-region
- 12.1.1 Germany
- 12.1.2 United Kingdom
- 12.1.3 France
- 12.1.4 Italy
- 12.1.5 Spain
- 12.1.6 Rest of Europe
- 13. Asia Pacific Global Gene Expression Analysis Market Analysis, Insights and Forecast, 2019-2031
- 13.1. Market Analysis, Insights and Forecast - By Country/Sub-region
- 13.1.1 China
- 13.1.2 Japan
- 13.1.3 India
- 13.1.4 Australia
- 13.1.5 South Korea
- 13.1.6 Rest of Asia Pacific
- 14. Middle East and Africa Global Gene Expression Analysis Market Analysis, Insights and Forecast, 2019-2031
- 14.1. Market Analysis, Insights and Forecast - By Country/Sub-region
- 14.1.1 GCC
- 14.1.2 South Africa
- 14.1.3 Rest of Middle East and Africa
- 15. South America Global Gene Expression Analysis Market Analysis, Insights and Forecast, 2019-2031
- 15.1. Market Analysis, Insights and Forecast - By Country/Sub-region
- 15.1.1 Brazil
- 15.1.2 Argentina
- 15.1.3 Rest of South America
- 16. Competitive Analysis
- 16.1. Market Share Analysis 2024
- 16.2. Company Profiles
- 16.2.1 Quest Diagnostics Incorporated
- 16.2.1.1. Overview
- 16.2.1.2. Products
- 16.2.1.3. SWOT Analysis
- 16.2.1.4. Recent Developments
- 16.2.1.5. Financials (Based on Availability)
- 16.2.2 Promega Corporation
- 16.2.2.1. Overview
- 16.2.2.2. Products
- 16.2.2.3. SWOT Analysis
- 16.2.2.4. Recent Developments
- 16.2.2.5. Financials (Based on Availability)
- 16.2.3 Novogene Corporation
- 16.2.3.1. Overview
- 16.2.3.2. Products
- 16.2.3.3. SWOT Analysis
- 16.2.3.4. Recent Developments
- 16.2.3.5. Financials (Based on Availability)
- 16.2.4 F Hoffmann-La Roche Ltd
- 16.2.4.1. Overview
- 16.2.4.2. Products
- 16.2.4.3. SWOT Analysis
- 16.2.4.4. Recent Developments
- 16.2.4.5. Financials (Based on Availability)
- 16.2.5 Thermo Fisher Scientific Inc
- 16.2.5.1. Overview
- 16.2.5.2. Products
- 16.2.5.3. SWOT Analysis
- 16.2.5.4. Recent Developments
- 16.2.5.5. Financials (Based on Availability)
- 16.2.6 Bio-Rad Laboratories
- 16.2.6.1. Overview
- 16.2.6.2. Products
- 16.2.6.3. SWOT Analysis
- 16.2.6.4. Recent Developments
- 16.2.6.5. Financials (Based on Availability)
- 16.2.7 Luminex Corporation
- 16.2.7.1. Overview
- 16.2.7.2. Products
- 16.2.7.3. SWOT Analysis
- 16.2.7.4. Recent Developments
- 16.2.7.5. Financials (Based on Availability)
- 16.2.8 PerkinElmer Inc
- 16.2.8.1. Overview
- 16.2.8.2. Products
- 16.2.8.3. SWOT Analysis
- 16.2.8.4. Recent Developments
- 16.2.8.5. Financials (Based on Availability)
- 16.2.9 Illumina Inc
- 16.2.9.1. Overview
- 16.2.9.2. Products
- 16.2.9.3. SWOT Analysis
- 16.2.9.4. Recent Developments
- 16.2.9.5. Financials (Based on Availability)
- 16.2.10 QIAGEN
- 16.2.10.1. Overview
- 16.2.10.2. Products
- 16.2.10.3. SWOT Analysis
- 16.2.10.4. Recent Developments
- 16.2.10.5. Financials (Based on Availability)
- 16.2.11 Agilent Technologies
- 16.2.11.1. Overview
- 16.2.11.2. Products
- 16.2.11.3. SWOT Analysis
- 16.2.11.4. Recent Developments
- 16.2.11.5. Financials (Based on Availability)
- 16.2.1 Quest Diagnostics Incorporated
List of Figures
- Figure 1: Global Global Gene Expression Analysis Market Revenue Breakdown (Million, %) by Region 2024 & 2032
- Figure 2: Global Global Gene Expression Analysis Market Volume Breakdown (K Unit, %) by Region 2024 & 2032
- Figure 3: North America Global Gene Expression Analysis Market Revenue (Million), by Country 2024 & 2032
- Figure 4: North America Global Gene Expression Analysis Market Volume (K Unit), by Country 2024 & 2032
- Figure 5: North America Global Gene Expression Analysis Market Revenue Share (%), by Country 2024 & 2032
- Figure 6: North America Global Gene Expression Analysis Market Volume Share (%), by Country 2024 & 2032
- Figure 7: Europe Global Gene Expression Analysis Market Revenue (Million), by Country 2024 & 2032
- Figure 8: Europe Global Gene Expression Analysis Market Volume (K Unit), by Country 2024 & 2032
- Figure 9: Europe Global Gene Expression Analysis Market Revenue Share (%), by Country 2024 & 2032
- Figure 10: Europe Global Gene Expression Analysis Market Volume Share (%), by Country 2024 & 2032
- Figure 11: Asia Pacific Global Gene Expression Analysis Market Revenue (Million), by Country 2024 & 2032
- Figure 12: Asia Pacific Global Gene Expression Analysis Market Volume (K Unit), by Country 2024 & 2032
- Figure 13: Asia Pacific Global Gene Expression Analysis Market Revenue Share (%), by Country 2024 & 2032
- Figure 14: Asia Pacific Global Gene Expression Analysis Market Volume Share (%), by Country 2024 & 2032
- Figure 15: Middle East and Africa Global Gene Expression Analysis Market Revenue (Million), by Country 2024 & 2032
- Figure 16: Middle East and Africa Global Gene Expression Analysis Market Volume (K Unit), by Country 2024 & 2032
- Figure 17: Middle East and Africa Global Gene Expression Analysis Market Revenue Share (%), by Country 2024 & 2032
- Figure 18: Middle East and Africa Global Gene Expression Analysis Market Volume Share (%), by Country 2024 & 2032
- Figure 19: South America Global Gene Expression Analysis Market Revenue (Million), by Country 2024 & 2032
- Figure 20: South America Global Gene Expression Analysis Market Volume (K Unit), by Country 2024 & 2032
- Figure 21: South America Global Gene Expression Analysis Market Revenue Share (%), by Country 2024 & 2032
- Figure 22: South America Global Gene Expression Analysis Market Volume Share (%), by Country 2024 & 2032
- Figure 23: North America Global Gene Expression Analysis Market Revenue (Million), by Technology 2024 & 2032
- Figure 24: North America Global Gene Expression Analysis Market Volume (K Unit), by Technology 2024 & 2032
- Figure 25: North America Global Gene Expression Analysis Market Revenue Share (%), by Technology 2024 & 2032
- Figure 26: North America Global Gene Expression Analysis Market Volume Share (%), by Technology 2024 & 2032
- Figure 27: North America Global Gene Expression Analysis Market Revenue (Million), by Product Type 2024 & 2032
- Figure 28: North America Global Gene Expression Analysis Market Volume (K Unit), by Product Type 2024 & 2032
- Figure 29: North America Global Gene Expression Analysis Market Revenue Share (%), by Product Type 2024 & 2032
- Figure 30: North America Global Gene Expression Analysis Market Volume Share (%), by Product Type 2024 & 2032
- Figure 31: North America Global Gene Expression Analysis Market Revenue (Million), by End-user 2024 & 2032
- Figure 32: North America Global Gene Expression Analysis Market Volume (K Unit), by End-user 2024 & 2032
- Figure 33: North America Global Gene Expression Analysis Market Revenue Share (%), by End-user 2024 & 2032
- Figure 34: North America Global Gene Expression Analysis Market Volume Share (%), by End-user 2024 & 2032
- Figure 35: North America Global Gene Expression Analysis Market Revenue (Million), by Country 2024 & 2032
- Figure 36: North America Global Gene Expression Analysis Market Volume (K Unit), by Country 2024 & 2032
- Figure 37: North America Global Gene Expression Analysis Market Revenue Share (%), by Country 2024 & 2032
- Figure 38: North America Global Gene Expression Analysis Market Volume Share (%), by Country 2024 & 2032
- Figure 39: Europe Global Gene Expression Analysis Market Revenue (Million), by Technology 2024 & 2032
- Figure 40: Europe Global Gene Expression Analysis Market Volume (K Unit), by Technology 2024 & 2032
- Figure 41: Europe Global Gene Expression Analysis Market Revenue Share (%), by Technology 2024 & 2032
- Figure 42: Europe Global Gene Expression Analysis Market Volume Share (%), by Technology 2024 & 2032
- Figure 43: Europe Global Gene Expression Analysis Market Revenue (Million), by Product Type 2024 & 2032
- Figure 44: Europe Global Gene Expression Analysis Market Volume (K Unit), by Product Type 2024 & 2032
- Figure 45: Europe Global Gene Expression Analysis Market Revenue Share (%), by Product Type 2024 & 2032
- Figure 46: Europe Global Gene Expression Analysis Market Volume Share (%), by Product Type 2024 & 2032
- Figure 47: Europe Global Gene Expression Analysis Market Revenue (Million), by End-user 2024 & 2032
- Figure 48: Europe Global Gene Expression Analysis Market Volume (K Unit), by End-user 2024 & 2032
- Figure 49: Europe Global Gene Expression Analysis Market Revenue Share (%), by End-user 2024 & 2032
- Figure 50: Europe Global Gene Expression Analysis Market Volume Share (%), by End-user 2024 & 2032
- Figure 51: Europe Global Gene Expression Analysis Market Revenue (Million), by Country 2024 & 2032
- Figure 52: Europe Global Gene Expression Analysis Market Volume (K Unit), by Country 2024 & 2032
- Figure 53: Europe Global Gene Expression Analysis Market Revenue Share (%), by Country 2024 & 2032
- Figure 54: Europe Global Gene Expression Analysis Market Volume Share (%), by Country 2024 & 2032
- Figure 55: Asia Pacific Global Gene Expression Analysis Market Revenue (Million), by Technology 2024 & 2032
- Figure 56: Asia Pacific Global Gene Expression Analysis Market Volume (K Unit), by Technology 2024 & 2032
- Figure 57: Asia Pacific Global Gene Expression Analysis Market Revenue Share (%), by Technology 2024 & 2032
- Figure 58: Asia Pacific Global Gene Expression Analysis Market Volume Share (%), by Technology 2024 & 2032
- Figure 59: Asia Pacific Global Gene Expression Analysis Market Revenue (Million), by Product Type 2024 & 2032
- Figure 60: Asia Pacific Global Gene Expression Analysis Market Volume (K Unit), by Product Type 2024 & 2032
- Figure 61: Asia Pacific Global Gene Expression Analysis Market Revenue Share (%), by Product Type 2024 & 2032
- Figure 62: Asia Pacific Global Gene Expression Analysis Market Volume Share (%), by Product Type 2024 & 2032
- Figure 63: Asia Pacific Global Gene Expression Analysis Market Revenue (Million), by End-user 2024 & 2032
- Figure 64: Asia Pacific Global Gene Expression Analysis Market Volume (K Unit), by End-user 2024 & 2032
- Figure 65: Asia Pacific Global Gene Expression Analysis Market Revenue Share (%), by End-user 2024 & 2032
- Figure 66: Asia Pacific Global Gene Expression Analysis Market Volume Share (%), by End-user 2024 & 2032
- Figure 67: Asia Pacific Global Gene Expression Analysis Market Revenue (Million), by Country 2024 & 2032
- Figure 68: Asia Pacific Global Gene Expression Analysis Market Volume (K Unit), by Country 2024 & 2032
- Figure 69: Asia Pacific Global Gene Expression Analysis Market Revenue Share (%), by Country 2024 & 2032
- Figure 70: Asia Pacific Global Gene Expression Analysis Market Volume Share (%), by Country 2024 & 2032
- Figure 71: Middle East and Africa Global Gene Expression Analysis Market Revenue (Million), by Technology 2024 & 2032
- Figure 72: Middle East and Africa Global Gene Expression Analysis Market Volume (K Unit), by Technology 2024 & 2032
- Figure 73: Middle East and Africa Global Gene Expression Analysis Market Revenue Share (%), by Technology 2024 & 2032
- Figure 74: Middle East and Africa Global Gene Expression Analysis Market Volume Share (%), by Technology 2024 & 2032
- Figure 75: Middle East and Africa Global Gene Expression Analysis Market Revenue (Million), by Product Type 2024 & 2032
- Figure 76: Middle East and Africa Global Gene Expression Analysis Market Volume (K Unit), by Product Type 2024 & 2032
- Figure 77: Middle East and Africa Global Gene Expression Analysis Market Revenue Share (%), by Product Type 2024 & 2032
- Figure 78: Middle East and Africa Global Gene Expression Analysis Market Volume Share (%), by Product Type 2024 & 2032
- Figure 79: Middle East and Africa Global Gene Expression Analysis Market Revenue (Million), by End-user 2024 & 2032
- Figure 80: Middle East and Africa Global Gene Expression Analysis Market Volume (K Unit), by End-user 2024 & 2032
- Figure 81: Middle East and Africa Global Gene Expression Analysis Market Revenue Share (%), by End-user 2024 & 2032
- Figure 82: Middle East and Africa Global Gene Expression Analysis Market Volume Share (%), by End-user 2024 & 2032
- Figure 83: Middle East and Africa Global Gene Expression Analysis Market Revenue (Million), by Country 2024 & 2032
- Figure 84: Middle East and Africa Global Gene Expression Analysis Market Volume (K Unit), by Country 2024 & 2032
- Figure 85: Middle East and Africa Global Gene Expression Analysis Market Revenue Share (%), by Country 2024 & 2032
- Figure 86: Middle East and Africa Global Gene Expression Analysis Market Volume Share (%), by Country 2024 & 2032
- Figure 87: South America Global Gene Expression Analysis Market Revenue (Million), by Technology 2024 & 2032
- Figure 88: South America Global Gene Expression Analysis Market Volume (K Unit), by Technology 2024 & 2032
- Figure 89: South America Global Gene Expression Analysis Market Revenue Share (%), by Technology 2024 & 2032
- Figure 90: South America Global Gene Expression Analysis Market Volume Share (%), by Technology 2024 & 2032
- Figure 91: South America Global Gene Expression Analysis Market Revenue (Million), by Product Type 2024 & 2032
- Figure 92: South America Global Gene Expression Analysis Market Volume (K Unit), by Product Type 2024 & 2032
- Figure 93: South America Global Gene Expression Analysis Market Revenue Share (%), by Product Type 2024 & 2032
- Figure 94: South America Global Gene Expression Analysis Market Volume Share (%), by Product Type 2024 & 2032
- Figure 95: South America Global Gene Expression Analysis Market Revenue (Million), by End-user 2024 & 2032
- Figure 96: South America Global Gene Expression Analysis Market Volume (K Unit), by End-user 2024 & 2032
- Figure 97: South America Global Gene Expression Analysis Market Revenue Share (%), by End-user 2024 & 2032
- Figure 98: South America Global Gene Expression Analysis Market Volume Share (%), by End-user 2024 & 2032
- Figure 99: South America Global Gene Expression Analysis Market Revenue (Million), by Country 2024 & 2032
- Figure 100: South America Global Gene Expression Analysis Market Volume (K Unit), by Country 2024 & 2032
- Figure 101: South America Global Gene Expression Analysis Market Revenue Share (%), by Country 2024 & 2032
- Figure 102: South America Global Gene Expression Analysis Market Volume Share (%), by Country 2024 & 2032
List of Tables
- Table 1: Global Gene Expression Analysis Market Revenue Million Forecast, by Region 2019 & 2032
- Table 2: Global Gene Expression Analysis Market Volume K Unit Forecast, by Region 2019 & 2032
- Table 3: Global Gene Expression Analysis Market Revenue Million Forecast, by Technology 2019 & 2032
- Table 4: Global Gene Expression Analysis Market Volume K Unit Forecast, by Technology 2019 & 2032
- Table 5: Global Gene Expression Analysis Market Revenue Million Forecast, by Product Type 2019 & 2032
- Table 6: Global Gene Expression Analysis Market Volume K Unit Forecast, by Product Type 2019 & 2032
- Table 7: Global Gene Expression Analysis Market Revenue Million Forecast, by End-user 2019 & 2032
- Table 8: Global Gene Expression Analysis Market Volume K Unit Forecast, by End-user 2019 & 2032
- Table 9: Global Gene Expression Analysis Market Revenue Million Forecast, by Region 2019 & 2032
- Table 10: Global Gene Expression Analysis Market Volume K Unit Forecast, by Region 2019 & 2032
- Table 11: Global Gene Expression Analysis Market Revenue Million Forecast, by Country 2019 & 2032
- Table 12: Global Gene Expression Analysis Market Volume K Unit Forecast, by Country 2019 & 2032
- Table 13: United States Global Gene Expression Analysis Market Revenue (Million) Forecast, by Application 2019 & 2032
- Table 14: United States Global Gene Expression Analysis Market Volume (K Unit) Forecast, by Application 2019 & 2032
- Table 15: Canada Global Gene Expression Analysis Market Revenue (Million) Forecast, by Application 2019 & 2032
- Table 16: Canada Global Gene Expression Analysis Market Volume (K Unit) Forecast, by Application 2019 & 2032
- Table 17: Mexico Global Gene Expression Analysis Market Revenue (Million) Forecast, by Application 2019 & 2032
- Table 18: Mexico Global Gene Expression Analysis Market Volume (K Unit) Forecast, by Application 2019 & 2032
- Table 19: Global Gene Expression Analysis Market Revenue Million Forecast, by Country 2019 & 2032
- Table 20: Global Gene Expression Analysis Market Volume K Unit Forecast, by Country 2019 & 2032
- Table 21: Germany Global Gene Expression Analysis Market Revenue (Million) Forecast, by Application 2019 & 2032
- Table 22: Germany Global Gene Expression Analysis Market Volume (K Unit) Forecast, by Application 2019 & 2032
- Table 23: United Kingdom Global Gene Expression Analysis Market Revenue (Million) Forecast, by Application 2019 & 2032
- Table 24: United Kingdom Global Gene Expression Analysis Market Volume (K Unit) Forecast, by Application 2019 & 2032
- Table 25: France Global Gene Expression Analysis Market Revenue (Million) Forecast, by Application 2019 & 2032
- Table 26: France Global Gene Expression Analysis Market Volume (K Unit) Forecast, by Application 2019 & 2032
- Table 27: Italy Global Gene Expression Analysis Market Revenue (Million) Forecast, by Application 2019 & 2032
- Table 28: Italy Global Gene Expression Analysis Market Volume (K Unit) Forecast, by Application 2019 & 2032
- Table 29: Spain Global Gene Expression Analysis Market Revenue (Million) Forecast, by Application 2019 & 2032
- Table 30: Spain Global Gene Expression Analysis Market Volume (K Unit) Forecast, by Application 2019 & 2032
- Table 31: Rest of Europe Global Gene Expression Analysis Market Revenue (Million) Forecast, by Application 2019 & 2032
- Table 32: Rest of Europe Global Gene Expression Analysis Market Volume (K Unit) Forecast, by Application 2019 & 2032
- Table 33: Global Gene Expression Analysis Market Revenue Million Forecast, by Country 2019 & 2032
- Table 34: Global Gene Expression Analysis Market Volume K Unit Forecast, by Country 2019 & 2032
- Table 35: China Global Gene Expression Analysis Market Revenue (Million) Forecast, by Application 2019 & 2032
- Table 36: China Global Gene Expression Analysis Market Volume (K Unit) Forecast, by Application 2019 & 2032
- Table 37: Japan Global Gene Expression Analysis Market Revenue (Million) Forecast, by Application 2019 & 2032
- Table 38: Japan Global Gene Expression Analysis Market Volume (K Unit) Forecast, by Application 2019 & 2032
- Table 39: India Global Gene Expression Analysis Market Revenue (Million) Forecast, by Application 2019 & 2032
- Table 40: India Global Gene Expression Analysis Market Volume (K Unit) Forecast, by Application 2019 & 2032
- Table 41: Australia Global Gene Expression Analysis Market Revenue (Million) Forecast, by Application 2019 & 2032
- Table 42: Australia Global Gene Expression Analysis Market Volume (K Unit) Forecast, by Application 2019 & 2032
- Table 43: South Korea Global Gene Expression Analysis Market Revenue (Million) Forecast, by Application 2019 & 2032
- Table 44: South Korea Global Gene Expression Analysis Market Volume (K Unit) Forecast, by Application 2019 & 2032
- Table 45: Rest of Asia Pacific Global Gene Expression Analysis Market Revenue (Million) Forecast, by Application 2019 & 2032
- Table 46: Rest of Asia Pacific Global Gene Expression Analysis Market Volume (K Unit) Forecast, by Application 2019 & 2032
- Table 47: Global Gene Expression Analysis Market Revenue Million Forecast, by Country 2019 & 2032
- Table 48: Global Gene Expression Analysis Market Volume K Unit Forecast, by Country 2019 & 2032
- Table 49: GCC Global Gene Expression Analysis Market Revenue (Million) Forecast, by Application 2019 & 2032
- Table 50: GCC Global Gene Expression Analysis Market Volume (K Unit) Forecast, by Application 2019 & 2032
- Table 51: South Africa Global Gene Expression Analysis Market Revenue (Million) Forecast, by Application 2019 & 2032
- Table 52: South Africa Global Gene Expression Analysis Market Volume (K Unit) Forecast, by Application 2019 & 2032
- Table 53: Rest of Middle East and Africa Global Gene Expression Analysis Market Revenue (Million) Forecast, by Application 2019 & 2032
- Table 54: Rest of Middle East and Africa Global Gene Expression Analysis Market Volume (K Unit) Forecast, by Application 2019 & 2032
- Table 55: Global Gene Expression Analysis Market Revenue Million Forecast, by Country 2019 & 2032
- Table 56: Global Gene Expression Analysis Market Volume K Unit Forecast, by Country 2019 & 2032
- Table 57: Brazil Global Gene Expression Analysis Market Revenue (Million) Forecast, by Application 2019 & 2032
- Table 58: Brazil Global Gene Expression Analysis Market Volume (K Unit) Forecast, by Application 2019 & 2032
- Table 59: Argentina Global Gene Expression Analysis Market Revenue (Million) Forecast, by Application 2019 & 2032
- Table 60: Argentina Global Gene Expression Analysis Market Volume (K Unit) Forecast, by Application 2019 & 2032
- Table 61: Rest of South America Global Gene Expression Analysis Market Revenue (Million) Forecast, by Application 2019 & 2032
- Table 62: Rest of South America Global Gene Expression Analysis Market Volume (K Unit) Forecast, by Application 2019 & 2032
- Table 63: Global Gene Expression Analysis Market Revenue Million Forecast, by Technology 2019 & 2032
- Table 64: Global Gene Expression Analysis Market Volume K Unit Forecast, by Technology 2019 & 2032
- Table 65: Global Gene Expression Analysis Market Revenue Million Forecast, by Product Type 2019 & 2032
- Table 66: Global Gene Expression Analysis Market Volume K Unit Forecast, by Product Type 2019 & 2032
- Table 67: Global Gene Expression Analysis Market Revenue Million Forecast, by End-user 2019 & 2032
- Table 68: Global Gene Expression Analysis Market Volume K Unit Forecast, by End-user 2019 & 2032
- Table 69: Global Gene Expression Analysis Market Revenue Million Forecast, by Country 2019 & 2032
- Table 70: Global Gene Expression Analysis Market Volume K Unit Forecast, by Country 2019 & 2032
- Table 71: United States Global Gene Expression Analysis Market Revenue (Million) Forecast, by Application 2019 & 2032
- Table 72: United States Global Gene Expression Analysis Market Volume (K Unit) Forecast, by Application 2019 & 2032
- Table 73: Canada Global Gene Expression Analysis Market Revenue (Million) Forecast, by Application 2019 & 2032
- Table 74: Canada Global Gene Expression Analysis Market Volume (K Unit) Forecast, by Application 2019 & 2032
- Table 75: Mexico Global Gene Expression Analysis Market Revenue (Million) Forecast, by Application 2019 & 2032
- Table 76: Mexico Global Gene Expression Analysis Market Volume (K Unit) Forecast, by Application 2019 & 2032
- Table 77: Global Gene Expression Analysis Market Revenue Million Forecast, by Technology 2019 & 2032
- Table 78: Global Gene Expression Analysis Market Volume K Unit Forecast, by Technology 2019 & 2032
- Table 79: Global Gene Expression Analysis Market Revenue Million Forecast, by Product Type 2019 & 2032
- Table 80: Global Gene Expression Analysis Market Volume K Unit Forecast, by Product Type 2019 & 2032
- Table 81: Global Gene Expression Analysis Market Revenue Million Forecast, by End-user 2019 & 2032
- Table 82: Global Gene Expression Analysis Market Volume K Unit Forecast, by End-user 2019 & 2032
- Table 83: Global Gene Expression Analysis Market Revenue Million Forecast, by Country 2019 & 2032
- Table 84: Global Gene Expression Analysis Market Volume K Unit Forecast, by Country 2019 & 2032
- Table 85: Germany Global Gene Expression Analysis Market Revenue (Million) Forecast, by Application 2019 & 2032
- Table 86: Germany Global Gene Expression Analysis Market Volume (K Unit) Forecast, by Application 2019 & 2032
- Table 87: United Kingdom Global Gene Expression Analysis Market Revenue (Million) Forecast, by Application 2019 & 2032
- Table 88: United Kingdom Global Gene Expression Analysis Market Volume (K Unit) Forecast, by Application 2019 & 2032
- Table 89: France Global Gene Expression Analysis Market Revenue (Million) Forecast, by Application 2019 & 2032
- Table 90: France Global Gene Expression Analysis Market Volume (K Unit) Forecast, by Application 2019 & 2032
- Table 91: Italy Global Gene Expression Analysis Market Revenue (Million) Forecast, by Application 2019 & 2032
- Table 92: Italy Global Gene Expression Analysis Market Volume (K Unit) Forecast, by Application 2019 & 2032
- Table 93: Spain Global Gene Expression Analysis Market Revenue (Million) Forecast, by Application 2019 & 2032
- Table 94: Spain Global Gene Expression Analysis Market Volume (K Unit) Forecast, by Application 2019 & 2032
- Table 95: Rest of Europe Global Gene Expression Analysis Market Revenue (Million) Forecast, by Application 2019 & 2032
- Table 96: Rest of Europe Global Gene Expression Analysis Market Volume (K Unit) Forecast, by Application 2019 & 2032
- Table 97: Global Gene Expression Analysis Market Revenue Million Forecast, by Technology 2019 & 2032
- Table 98: Global Gene Expression Analysis Market Volume K Unit Forecast, by Technology 2019 & 2032
- Table 99: Global Gene Expression Analysis Market Revenue Million Forecast, by Product Type 2019 & 2032
- Table 100: Global Gene Expression Analysis Market Volume K Unit Forecast, by Product Type 2019 & 2032
- Table 101: Global Gene Expression Analysis Market Revenue Million Forecast, by End-user 2019 & 2032
- Table 102: Global Gene Expression Analysis Market Volume K Unit Forecast, by End-user 2019 & 2032
- Table 103: Global Gene Expression Analysis Market Revenue Million Forecast, by Country 2019 & 2032
- Table 104: Global Gene Expression Analysis Market Volume K Unit Forecast, by Country 2019 & 2032
- Table 105: China Global Gene Expression Analysis Market Revenue (Million) Forecast, by Application 2019 & 2032
- Table 106: China Global Gene Expression Analysis Market Volume (K Unit) Forecast, by Application 2019 & 2032
- Table 107: Japan Global Gene Expression Analysis Market Revenue (Million) Forecast, by Application 2019 & 2032
- Table 108: Japan Global Gene Expression Analysis Market Volume (K Unit) Forecast, by Application 2019 & 2032
- Table 109: India Global Gene Expression Analysis Market Revenue (Million) Forecast, by Application 2019 & 2032
- Table 110: India Global Gene Expression Analysis Market Volume (K Unit) Forecast, by Application 2019 & 2032
- Table 111: Australia Global Gene Expression Analysis Market Revenue (Million) Forecast, by Application 2019 & 2032
- Table 112: Australia Global Gene Expression Analysis Market Volume (K Unit) Forecast, by Application 2019 & 2032
- Table 113: South Korea Global Gene Expression Analysis Market Revenue (Million) Forecast, by Application 2019 & 2032
- Table 114: South Korea Global Gene Expression Analysis Market Volume (K Unit) Forecast, by Application 2019 & 2032
- Table 115: Rest of Asia Pacific Global Gene Expression Analysis Market Revenue (Million) Forecast, by Application 2019 & 2032
- Table 116: Rest of Asia Pacific Global Gene Expression Analysis Market Volume (K Unit) Forecast, by Application 2019 & 2032
- Table 117: Global Gene Expression Analysis Market Revenue Million Forecast, by Technology 2019 & 2032
- Table 118: Global Gene Expression Analysis Market Volume K Unit Forecast, by Technology 2019 & 2032
- Table 119: Global Gene Expression Analysis Market Revenue Million Forecast, by Product Type 2019 & 2032
- Table 120: Global Gene Expression Analysis Market Volume K Unit Forecast, by Product Type 2019 & 2032
- Table 121: Global Gene Expression Analysis Market Revenue Million Forecast, by End-user 2019 & 2032
- Table 122: Global Gene Expression Analysis Market Volume K Unit Forecast, by End-user 2019 & 2032
- Table 123: Global Gene Expression Analysis Market Revenue Million Forecast, by Country 2019 & 2032
- Table 124: Global Gene Expression Analysis Market Volume K Unit Forecast, by Country 2019 & 2032
- Table 125: GCC Global Gene Expression Analysis Market Revenue (Million) Forecast, by Application 2019 & 2032
- Table 126: GCC Global Gene Expression Analysis Market Volume (K Unit) Forecast, by Application 2019 & 2032
- Table 127: South Africa Global Gene Expression Analysis Market Revenue (Million) Forecast, by Application 2019 & 2032
- Table 128: South Africa Global Gene Expression Analysis Market Volume (K Unit) Forecast, by Application 2019 & 2032
- Table 129: Rest of Middle East and Africa Global Gene Expression Analysis Market Revenue (Million) Forecast, by Application 2019 & 2032
- Table 130: Rest of Middle East and Africa Global Gene Expression Analysis Market Volume (K Unit) Forecast, by Application 2019 & 2032
- Table 131: Global Gene Expression Analysis Market Revenue Million Forecast, by Technology 2019 & 2032
- Table 132: Global Gene Expression Analysis Market Volume K Unit Forecast, by Technology 2019 & 2032
- Table 133: Global Gene Expression Analysis Market Revenue Million Forecast, by Product Type 2019 & 2032
- Table 134: Global Gene Expression Analysis Market Volume K Unit Forecast, by Product Type 2019 & 2032
- Table 135: Global Gene Expression Analysis Market Revenue Million Forecast, by End-user 2019 & 2032
- Table 136: Global Gene Expression Analysis Market Volume K Unit Forecast, by End-user 2019 & 2032
- Table 137: Global Gene Expression Analysis Market Revenue Million Forecast, by Country 2019 & 2032
- Table 138: Global Gene Expression Analysis Market Volume K Unit Forecast, by Country 2019 & 2032
- Table 139: Brazil Global Gene Expression Analysis Market Revenue (Million) Forecast, by Application 2019 & 2032
- Table 140: Brazil Global Gene Expression Analysis Market Volume (K Unit) Forecast, by Application 2019 & 2032
- Table 141: Argentina Global Gene Expression Analysis Market Revenue (Million) Forecast, by Application 2019 & 2032
- Table 142: Argentina Global Gene Expression Analysis Market Volume (K Unit) Forecast, by Application 2019 & 2032
- Table 143: Rest of South America Global Gene Expression Analysis Market Revenue (Million) Forecast, by Application 2019 & 2032
- Table 144: Rest of South America Global Gene Expression Analysis Market Volume (K Unit) Forecast, by Application 2019 & 2032
Frequently Asked Questions
1. What is the projected Compound Annual Growth Rate (CAGR) of the Global Gene Expression Analysis Market?
The projected CAGR is approximately 8.90%.
2. Which companies are prominent players in the Global Gene Expression Analysis Market?
Key companies in the market include Quest Diagnostics Incorporated, Promega Corporation, Novogene Corporation, F Hoffmann-La Roche Ltd, Thermo Fisher Scientific Inc, Bio-Rad Laboratories, Luminex Corporation, PerkinElmer Inc, Illumina Inc, QIAGEN, Agilent Technologies.
3. What are the main segments of the Global Gene Expression Analysis Market?
The market segments include Technology, Product Type, End-user.
4. Can you provide details about the market size?
The market size is estimated to be USD XX Million as of 2022.
5. What are some drivers contributing to market growth?
Rapid Technological Advancement; Increased Government Funding towards Genomics; Growing Adoption of Personalized Medicine.
6. What are the notable trends driving market growth?
Next Generation Sequencing (NGS) Segment Expects to Register a High CAGR in the Forecast Period.
7. Are there any restraints impacting market growth?
Lack of Skilled Labor; High Cost of the Instruments.
8. Can you provide examples of recent developments in the market?
January 2023: QIAGEN Digital Insights (QDI), the bioinformatics business of QIAGEN, launched its QIAGEN CLC Genomics Workbench Premium, which removes the data-analysis bottleneck of next-generation sequencing. The bottleneck of the NGS data analysis is offered by adding high analysis speed to the analysis and interpretation of the whole exome sequencing (WES), whole genome sequencing (WGS), and large panel sequencing data.
9. What pricing options are available for accessing the report?
Pricing options include single-user, multi-user, and enterprise licenses priced at USD 4750, USD 5250, and USD 8750 respectively.
10. Is the market size provided in terms of value or volume?
The market size is provided in terms of value, measured in Million and volume, measured in K Unit.
11. Are there any specific market keywords associated with the report?
Yes, the market keyword associated with the report is "Global Gene Expression Analysis Market," which aids in identifying and referencing the specific market segment covered.
12. How do I determine which pricing option suits my needs best?
The pricing options vary based on user requirements and access needs. Individual users may opt for single-user licenses, while businesses requiring broader access may choose multi-user or enterprise licenses for cost-effective access to the report.
13. Are there any additional resources or data provided in the Global Gene Expression Analysis Market report?
While the report offers comprehensive insights, it's advisable to review the specific contents or supplementary materials provided to ascertain if additional resources or data are available.
14. How can I stay updated on further developments or reports in the Global Gene Expression Analysis Market?
To stay informed about further developments, trends, and reports in the Global Gene Expression Analysis Market, consider subscribing to industry newsletters, following relevant companies and organizations, or regularly checking reputable industry news sources and publications.
Methodology
Step 1 - Identification of Relevant Samples Size from Population Database


Step 2 - Approaches for Defining Global Market Size (Value, Volume* & Price*)

Note*: In applicable scenarios
Step 3 - Data Sources
Primary Research
- Web Analytics
- Survey Reports
- Research Institute
- Latest Research Reports
- Opinion Leaders
Secondary Research
- Annual Reports
- White Paper
- Latest Press Release
- Industry Association
- Paid Database
- Investor Presentations

Step 4 - Data Triangulation
Involves using different sources of information in order to increase the validity of a study
These sources are likely to be stakeholders in a program - participants, other researchers, program staff, other community members, and so on.
Then we put all data in single framework & apply various statistical tools to find out the dynamic on the market.
During the analysis stage, feedback from the stakeholder groups would be compared to determine areas of agreement as well as areas of divergence


