


Key Insights
The global glass packaging recycling service market is experiencing robust growth, driven by increasing environmental concerns, stringent government regulations promoting sustainable practices, and the rising demand for recycled glass in various industries. The market's expansion is fueled by a growing consumer awareness of the environmental impact of waste and a preference for eco-friendly products. Technological advancements in recycling processes, such as improved sorting and cleaning technologies, are also contributing to increased efficiency and cost-effectiveness, making recycling a more attractive proposition for businesses. Key players in the market, including Veolia, Ardagh Group, and Sibelco, are investing in innovative solutions and expanding their operations to meet the growing demand. The market is segmented based on various factors, including collection methods, recycling technologies, and end-use applications of recycled glass. While challenges remain, such as the high cost of collection and processing in certain regions and the inconsistent quality of recycled glass, the overall market outlook is positive, with a projected continued expansion driven by the global shift towards a circular economy.
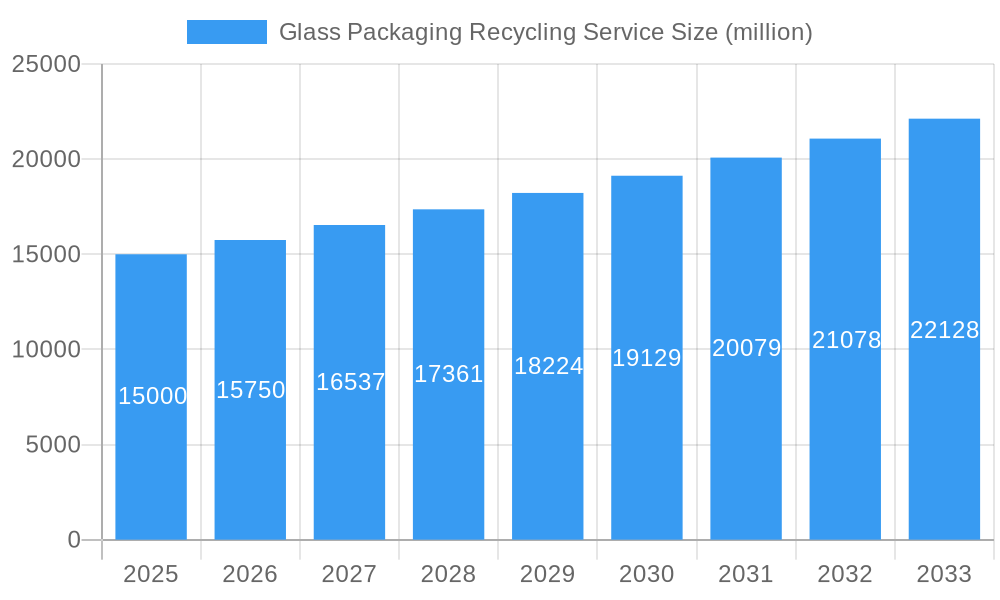
Glass Packaging Recycling Service Market Size (In Billion)

The market's growth trajectory is expected to remain strong throughout the forecast period (2025-2033). Regional variations exist, with developed economies in North America and Europe exhibiting higher recycling rates due to established infrastructure and stricter regulations. However, emerging economies in Asia-Pacific and Latin America present significant growth opportunities as these regions develop their recycling infrastructure and consumer awareness increases. The increasing adoption of extended producer responsibility (EPR) schemes is further pushing growth by holding producers accountable for managing the end-of-life of their products. Competition among recycling service providers is intense, necessitating continuous innovation and strategic partnerships to gain a competitive edge. The future of the glass packaging recycling service market lies in developing sustainable and economically viable solutions that encourage greater participation from consumers and businesses, leading to higher recycling rates and a reduced environmental footprint.
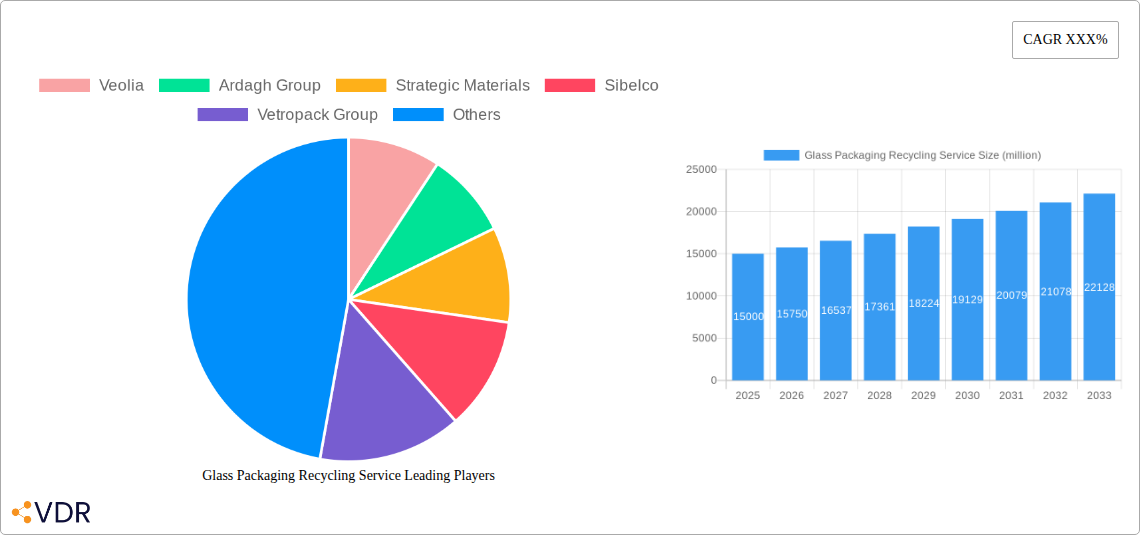
Glass Packaging Recycling Service Company Market Share
Glass Packaging Recycling Service Market Report: 2019-2033
This comprehensive report provides a detailed analysis of the global glass packaging recycling service market, encompassing market dynamics, growth trends, regional analysis, competitive landscape, and future outlook. The study period covers 2019-2033, with 2025 as the base and estimated year. This report is invaluable for industry professionals, investors, and stakeholders seeking to understand and capitalize on opportunities within this rapidly evolving sector. The report examines the parent market of recycling services and the child market of glass packaging recycling specifically.
Glass Packaging Recycling Service Market Dynamics & Structure
This section analyzes the market's competitive landscape, technological advancements, regulatory influences, and market trends from 2019-2024. The market exhibits moderate concentration, with key players holding significant market share. Technological innovations, such as automated sorting systems and enhanced recycling technologies, are driving efficiency and capacity. Stringent environmental regulations are pushing increased recycling rates globally.
- Market Concentration: The top 5 players account for approximately xx% of the global market in 2025 (estimated).
- Technological Innovation: Investment in AI-powered sorting and improved glass cullet processing is driving efficiency gains. Barriers to innovation include high initial capital costs and a lack of standardization across recycling facilities.
- Regulatory Frameworks: Government mandates and extended producer responsibility (EPR) schemes are key drivers of growth. Variations in regulations across regions create complexities for global operators.
- Competitive Substitutes: While alternative packaging materials exist, glass maintains a strong position due to its recyclability and inert nature.
- M&A Trends: Consolidation is expected to continue, with xx M&A deals projected between 2025 and 2033, driven by the need for scale and geographical expansion. The average deal value is estimated to be around xx million.
- End-User Demographics: Growth is fueled by increasing environmental awareness among consumers and a rising demand for sustainable packaging solutions.
Glass Packaging Recycling Service Growth Trends & Insights
The global glass packaging recycling service market experienced robust growth during the historical period (2019-2024) and is projected to maintain a healthy Compound Annual Growth Rate (CAGR) of xx% during the forecast period (2025-2033). Market size increased from xx million units in 2019 to xx million units in 2024, and is estimated to reach xx million units in 2025. This growth is attributed to several factors, including rising environmental consciousness, increasing government regulations promoting recycling, and technological advancements in recycling processes. Market penetration is steadily increasing, with xx% of glass packaging currently being recycled globally. Technological disruptions, particularly the adoption of advanced sorting technologies, are significantly improving the efficiency and cost-effectiveness of glass recycling. Consumer behavior shifts, influenced by ESG initiatives and sustainable consumption patterns, continue to boost demand for environmentally responsible recycling services.
Dominant Regions, Countries, or Segments in Glass Packaging Recycling Service
North America and Europe currently dominate the glass packaging recycling service market, holding a combined market share of approximately xx% in 2025 (estimated). Stringent environmental regulations, well-established recycling infrastructure, and high consumer awareness drive growth in these regions.
- North America: Strong regulatory frameworks and high per capita consumption of packaged goods fuel growth.
- Europe: Progressive environmental policies and a robust recycling infrastructure contribute significantly to market leadership.
- Asia-Pacific: Rapid economic growth and increasing urbanization are creating opportunities, though infrastructure development remains a challenge.
Market share dominance is determined by several factors: established infrastructure, favorable regulatory environments, robust consumer awareness regarding sustainable practices, and the presence of major recycling service providers.
Glass Packaging Recycling Service Product Landscape
The glass packaging recycling service market offers a range of services, from collection and sorting to processing and re-manufacturing. Innovations focus on improving efficiency through automated sorting systems, advanced material processing techniques, and the development of high-quality recycled glass cullet. These advancements enhance the quality and usability of recycled glass, expanding its applications beyond traditional glass containers. Unique selling propositions include faster turnaround times, increased recycling rates, and reduced environmental impact.
Key Drivers, Barriers & Challenges in Glass Packaging Recycling Service
Key Drivers: Stringent environmental regulations, increasing consumer demand for sustainable products, and technological advancements are the main drivers. Government incentives and investments in recycling infrastructure further propel market expansion.
Key Challenges: Fluctuating raw material prices, limitations in recycling infrastructure, especially in developing regions, and contamination issues in collected materials pose significant hurdles. Competition from other packaging materials and high transportation costs also contribute to challenges.
Emerging Opportunities in Glass Packaging Recycling Service
Untapped markets in developing economies, particularly in Asia and Africa, offer significant growth potential. Innovation in recycling technologies, particularly in the area of closed-loop recycling systems, presents promising opportunities. Evolving consumer preferences toward sustainable and ethically sourced products create further opportunities for environmentally responsible glass recycling services.
Growth Accelerators in the Glass Packaging Recycling Service Industry
Technological breakthroughs in automated sorting and processing significantly enhance efficiency and reduce costs, accelerating market growth. Strategic partnerships between recycling companies and producers stimulate innovation and improve supply chain management. Expanding into new markets and targeting niche applications, such as specialized glass recycling solutions, drive further expansion.
Key Players Shaping the Glass Packaging Recycling Service Market
- Veolia
- Ardagh Group
- Strategic Materials
- Sibelco
- Vetropack Group
- Visy
- Binder+Co
- Momentum Recycling
- Spring Pool Glass
- Glass Recycling UK
- Jado Recycling
- Glass Half Full
- Ripple Glass
- Rumpke
- GFL Environmental
- Renewi
- Shanghai Yanlongji
Notable Milestones in Glass Packaging Recycling Service Sector
- 2021: Introduction of a new AI-powered sorting system by Veolia, increasing recycling efficiency by xx%.
- 2022: Strategic partnership between Ardagh Group and a major beverage company to promote closed-loop glass recycling.
- 2023: Implementation of new EPR schemes in several European countries, boosting recycling rates.
- 2024: Significant investment in new glass recycling facilities in Asia.
In-Depth Glass Packaging Recycling Service Market Outlook
The glass packaging recycling service market is poised for continued growth, driven by increasing environmental awareness, technological advancements, and supportive government policies. Strategic investments in infrastructure, innovative technologies, and strategic partnerships will be key factors in shaping the market's future landscape. The market's potential lies in untapped markets, enhanced recycling technologies, and the potential for closed-loop systems, generating significant economic and environmental benefits.
Glass Packaging Recycling Service Segmentation
-
1. Application
- 1.1. Alcohol
- 1.2. Beverages
- 1.3. Others
-
2. Type
- 2.1. Disposable
- 2.2. Reusable
Glass Packaging Recycling Service Segmentation By Geography
-
1. North America
- 1.1. United States
- 1.2. Canada
- 1.3. Mexico
-
2. South America
- 2.1. Brazil
- 2.2. Argentina
- 2.3. Rest of South America
-
3. Europe
- 3.1. United Kingdom
- 3.2. Germany
- 3.3. France
- 3.4. Italy
- 3.5. Spain
- 3.6. Russia
- 3.7. Benelux
- 3.8. Nordics
- 3.9. Rest of Europe
-
4. Middle East & Africa
- 4.1. Turkey
- 4.2. Israel
- 4.3. GCC
- 4.4. North Africa
- 4.5. South Africa
- 4.6. Rest of Middle East & Africa
-
5. Asia Pacific
- 5.1. China
- 5.2. India
- 5.3. Japan
- 5.4. South Korea
- 5.5. ASEAN
- 5.6. Oceania
- 5.7. Rest of Asia Pacific

Glass Packaging Recycling Service Regional Market Share
Geographic Coverage of Glass Packaging Recycling Service
Glass Packaging Recycling Service REPORT HIGHLIGHTS
| Aspects | Details |
|---|---|
| Study Period | 2020-2034 |
| Base Year | 2025 |
| Estimated Year | 2026 |
| Forecast Period | 2026-2034 |
| Historical Period | 2020-2025 |
| Growth Rate | CAGR of 6.4% from 2020-2034 |
| Segmentation |
|
Table of Contents
- 1. Introduction
- 1.1. Research Scope
- 1.2. Market Segmentation
- 1.3. Research Methodology
- 1.4. Definitions and Assumptions
- 2. Executive Summary
- 2.1. Introduction
- 3. Market Dynamics
- 3.1. Introduction
- 3.2. Market Drivers
- 3.3. Market Restrains
- 3.4. Market Trends
- 4. Market Factor Analysis
- 4.1. Porters Five Forces
- 4.2. Supply/Value Chain
- 4.3. PESTEL analysis
- 4.4. Market Entropy
- 4.5. Patent/Trademark Analysis
- 5. Global Glass Packaging Recycling Service Analysis, Insights and Forecast, 2020-2032
- 5.1. Market Analysis, Insights and Forecast - by Application
- 5.1.1. Alcohol
- 5.1.2. Beverages
- 5.1.3. Others
- 5.2. Market Analysis, Insights and Forecast - by Type
- 5.2.1. Disposable
- 5.2.2. Reusable
- 5.3. Market Analysis, Insights and Forecast - by Region
- 5.3.1. North America
- 5.3.2. South America
- 5.3.3. Europe
- 5.3.4. Middle East & Africa
- 5.3.5. Asia Pacific
- 5.1. Market Analysis, Insights and Forecast - by Application
- 6. North America Glass Packaging Recycling Service Analysis, Insights and Forecast, 2020-2032
- 6.1. Market Analysis, Insights and Forecast - by Application
- 6.1.1. Alcohol
- 6.1.2. Beverages
- 6.1.3. Others
- 6.2. Market Analysis, Insights and Forecast - by Type
- 6.2.1. Disposable
- 6.2.2. Reusable
- 6.1. Market Analysis, Insights and Forecast - by Application
- 7. South America Glass Packaging Recycling Service Analysis, Insights and Forecast, 2020-2032
- 7.1. Market Analysis, Insights and Forecast - by Application
- 7.1.1. Alcohol
- 7.1.2. Beverages
- 7.1.3. Others
- 7.2. Market Analysis, Insights and Forecast - by Type
- 7.2.1. Disposable
- 7.2.2. Reusable
- 7.1. Market Analysis, Insights and Forecast - by Application
- 8. Europe Glass Packaging Recycling Service Analysis, Insights and Forecast, 2020-2032
- 8.1. Market Analysis, Insights and Forecast - by Application
- 8.1.1. Alcohol
- 8.1.2. Beverages
- 8.1.3. Others
- 8.2. Market Analysis, Insights and Forecast - by Type
- 8.2.1. Disposable
- 8.2.2. Reusable
- 8.1. Market Analysis, Insights and Forecast - by Application
- 9. Middle East & Africa Glass Packaging Recycling Service Analysis, Insights and Forecast, 2020-2032
- 9.1. Market Analysis, Insights and Forecast - by Application
- 9.1.1. Alcohol
- 9.1.2. Beverages
- 9.1.3. Others
- 9.2. Market Analysis, Insights and Forecast - by Type
- 9.2.1. Disposable
- 9.2.2. Reusable
- 9.1. Market Analysis, Insights and Forecast - by Application
- 10. Asia Pacific Glass Packaging Recycling Service Analysis, Insights and Forecast, 2020-2032
- 10.1. Market Analysis, Insights and Forecast - by Application
- 10.1.1. Alcohol
- 10.1.2. Beverages
- 10.1.3. Others
- 10.2. Market Analysis, Insights and Forecast - by Type
- 10.2.1. Disposable
- 10.2.2. Reusable
- 10.1. Market Analysis, Insights and Forecast - by Application
- 11. Competitive Analysis
- 11.1. Global Market Share Analysis 2025
- 11.2. Company Profiles
- 11.2.1 Veolia
- 11.2.1.1. Overview
- 11.2.1.2. Products
- 11.2.1.3. SWOT Analysis
- 11.2.1.4. Recent Developments
- 11.2.1.5. Financials (Based on Availability)
- 11.2.2 Ardagh Group
- 11.2.2.1. Overview
- 11.2.2.2. Products
- 11.2.2.3. SWOT Analysis
- 11.2.2.4. Recent Developments
- 11.2.2.5. Financials (Based on Availability)
- 11.2.3 Strategic Materials
- 11.2.3.1. Overview
- 11.2.3.2. Products
- 11.2.3.3. SWOT Analysis
- 11.2.3.4. Recent Developments
- 11.2.3.5. Financials (Based on Availability)
- 11.2.4 Sibelco
- 11.2.4.1. Overview
- 11.2.4.2. Products
- 11.2.4.3. SWOT Analysis
- 11.2.4.4. Recent Developments
- 11.2.4.5. Financials (Based on Availability)
- 11.2.5 Vetropack Group
- 11.2.5.1. Overview
- 11.2.5.2. Products
- 11.2.5.3. SWOT Analysis
- 11.2.5.4. Recent Developments
- 11.2.5.5. Financials (Based on Availability)
- 11.2.6 Visy
- 11.2.6.1. Overview
- 11.2.6.2. Products
- 11.2.6.3. SWOT Analysis
- 11.2.6.4. Recent Developments
- 11.2.6.5. Financials (Based on Availability)
- 11.2.7 Binder+Co
- 11.2.7.1. Overview
- 11.2.7.2. Products
- 11.2.7.3. SWOT Analysis
- 11.2.7.4. Recent Developments
- 11.2.7.5. Financials (Based on Availability)
- 11.2.8 Momentum Recycling
- 11.2.8.1. Overview
- 11.2.8.2. Products
- 11.2.8.3. SWOT Analysis
- 11.2.8.4. Recent Developments
- 11.2.8.5. Financials (Based on Availability)
- 11.2.9 Spring Pool Glass
- 11.2.9.1. Overview
- 11.2.9.2. Products
- 11.2.9.3. SWOT Analysis
- 11.2.9.4. Recent Developments
- 11.2.9.5. Financials (Based on Availability)
- 11.2.10 Glass Recycling UK
- 11.2.10.1. Overview
- 11.2.10.2. Products
- 11.2.10.3. SWOT Analysis
- 11.2.10.4. Recent Developments
- 11.2.10.5. Financials (Based on Availability)
- 11.2.11 Jado Recycling
- 11.2.11.1. Overview
- 11.2.11.2. Products
- 11.2.11.3. SWOT Analysis
- 11.2.11.4. Recent Developments
- 11.2.11.5. Financials (Based on Availability)
- 11.2.12 Glass Half Full
- 11.2.12.1. Overview
- 11.2.12.2. Products
- 11.2.12.3. SWOT Analysis
- 11.2.12.4. Recent Developments
- 11.2.12.5. Financials (Based on Availability)
- 11.2.13 Ripple Glass
- 11.2.13.1. Overview
- 11.2.13.2. Products
- 11.2.13.3. SWOT Analysis
- 11.2.13.4. Recent Developments
- 11.2.13.5. Financials (Based on Availability)
- 11.2.14 Rumpke
- 11.2.14.1. Overview
- 11.2.14.2. Products
- 11.2.14.3. SWOT Analysis
- 11.2.14.4. Recent Developments
- 11.2.14.5. Financials (Based on Availability)
- 11.2.15 GFL Environmental
- 11.2.15.1. Overview
- 11.2.15.2. Products
- 11.2.15.3. SWOT Analysis
- 11.2.15.4. Recent Developments
- 11.2.15.5. Financials (Based on Availability)
- 11.2.16 Renewi
- 11.2.16.1. Overview
- 11.2.16.2. Products
- 11.2.16.3. SWOT Analysis
- 11.2.16.4. Recent Developments
- 11.2.16.5. Financials (Based on Availability)
- 11.2.17 Shanghai Yanlongji
- 11.2.17.1. Overview
- 11.2.17.2. Products
- 11.2.17.3. SWOT Analysis
- 11.2.17.4. Recent Developments
- 11.2.17.5. Financials (Based on Availability)
- 11.2.1 Veolia
List of Figures
- Figure 1: Global Glass Packaging Recycling Service Revenue Breakdown (undefined, %) by Region 2025 & 2033
- Figure 2: North America Glass Packaging Recycling Service Revenue (undefined), by Application 2025 & 2033
- Figure 3: North America Glass Packaging Recycling Service Revenue Share (%), by Application 2025 & 2033
- Figure 4: North America Glass Packaging Recycling Service Revenue (undefined), by Type 2025 & 2033
- Figure 5: North America Glass Packaging Recycling Service Revenue Share (%), by Type 2025 & 2033
- Figure 6: North America Glass Packaging Recycling Service Revenue (undefined), by Country 2025 & 2033
- Figure 7: North America Glass Packaging Recycling Service Revenue Share (%), by Country 2025 & 2033
- Figure 8: South America Glass Packaging Recycling Service Revenue (undefined), by Application 2025 & 2033
- Figure 9: South America Glass Packaging Recycling Service Revenue Share (%), by Application 2025 & 2033
- Figure 10: South America Glass Packaging Recycling Service Revenue (undefined), by Type 2025 & 2033
- Figure 11: South America Glass Packaging Recycling Service Revenue Share (%), by Type 2025 & 2033
- Figure 12: South America Glass Packaging Recycling Service Revenue (undefined), by Country 2025 & 2033
- Figure 13: South America Glass Packaging Recycling Service Revenue Share (%), by Country 2025 & 2033
- Figure 14: Europe Glass Packaging Recycling Service Revenue (undefined), by Application 2025 & 2033
- Figure 15: Europe Glass Packaging Recycling Service Revenue Share (%), by Application 2025 & 2033
- Figure 16: Europe Glass Packaging Recycling Service Revenue (undefined), by Type 2025 & 2033
- Figure 17: Europe Glass Packaging Recycling Service Revenue Share (%), by Type 2025 & 2033
- Figure 18: Europe Glass Packaging Recycling Service Revenue (undefined), by Country 2025 & 2033
- Figure 19: Europe Glass Packaging Recycling Service Revenue Share (%), by Country 2025 & 2033
- Figure 20: Middle East & Africa Glass Packaging Recycling Service Revenue (undefined), by Application 2025 & 2033
- Figure 21: Middle East & Africa Glass Packaging Recycling Service Revenue Share (%), by Application 2025 & 2033
- Figure 22: Middle East & Africa Glass Packaging Recycling Service Revenue (undefined), by Type 2025 & 2033
- Figure 23: Middle East & Africa Glass Packaging Recycling Service Revenue Share (%), by Type 2025 & 2033
- Figure 24: Middle East & Africa Glass Packaging Recycling Service Revenue (undefined), by Country 2025 & 2033
- Figure 25: Middle East & Africa Glass Packaging Recycling Service Revenue Share (%), by Country 2025 & 2033
- Figure 26: Asia Pacific Glass Packaging Recycling Service Revenue (undefined), by Application 2025 & 2033
- Figure 27: Asia Pacific Glass Packaging Recycling Service Revenue Share (%), by Application 2025 & 2033
- Figure 28: Asia Pacific Glass Packaging Recycling Service Revenue (undefined), by Type 2025 & 2033
- Figure 29: Asia Pacific Glass Packaging Recycling Service Revenue Share (%), by Type 2025 & 2033
- Figure 30: Asia Pacific Glass Packaging Recycling Service Revenue (undefined), by Country 2025 & 2033
- Figure 31: Asia Pacific Glass Packaging Recycling Service Revenue Share (%), by Country 2025 & 2033
List of Tables
- Table 1: Global Glass Packaging Recycling Service Revenue undefined Forecast, by Application 2020 & 2033
- Table 2: Global Glass Packaging Recycling Service Revenue undefined Forecast, by Type 2020 & 2033
- Table 3: Global Glass Packaging Recycling Service Revenue undefined Forecast, by Region 2020 & 2033
- Table 4: Global Glass Packaging Recycling Service Revenue undefined Forecast, by Application 2020 & 2033
- Table 5: Global Glass Packaging Recycling Service Revenue undefined Forecast, by Type 2020 & 2033
- Table 6: Global Glass Packaging Recycling Service Revenue undefined Forecast, by Country 2020 & 2033
- Table 7: United States Glass Packaging Recycling Service Revenue (undefined) Forecast, by Application 2020 & 2033
- Table 8: Canada Glass Packaging Recycling Service Revenue (undefined) Forecast, by Application 2020 & 2033
- Table 9: Mexico Glass Packaging Recycling Service Revenue (undefined) Forecast, by Application 2020 & 2033
- Table 10: Global Glass Packaging Recycling Service Revenue undefined Forecast, by Application 2020 & 2033
- Table 11: Global Glass Packaging Recycling Service Revenue undefined Forecast, by Type 2020 & 2033
- Table 12: Global Glass Packaging Recycling Service Revenue undefined Forecast, by Country 2020 & 2033
- Table 13: Brazil Glass Packaging Recycling Service Revenue (undefined) Forecast, by Application 2020 & 2033
- Table 14: Argentina Glass Packaging Recycling Service Revenue (undefined) Forecast, by Application 2020 & 2033
- Table 15: Rest of South America Glass Packaging Recycling Service Revenue (undefined) Forecast, by Application 2020 & 2033
- Table 16: Global Glass Packaging Recycling Service Revenue undefined Forecast, by Application 2020 & 2033
- Table 17: Global Glass Packaging Recycling Service Revenue undefined Forecast, by Type 2020 & 2033
- Table 18: Global Glass Packaging Recycling Service Revenue undefined Forecast, by Country 2020 & 2033
- Table 19: United Kingdom Glass Packaging Recycling Service Revenue (undefined) Forecast, by Application 2020 & 2033
- Table 20: Germany Glass Packaging Recycling Service Revenue (undefined) Forecast, by Application 2020 & 2033
- Table 21: France Glass Packaging Recycling Service Revenue (undefined) Forecast, by Application 2020 & 2033
- Table 22: Italy Glass Packaging Recycling Service Revenue (undefined) Forecast, by Application 2020 & 2033
- Table 23: Spain Glass Packaging Recycling Service Revenue (undefined) Forecast, by Application 2020 & 2033
- Table 24: Russia Glass Packaging Recycling Service Revenue (undefined) Forecast, by Application 2020 & 2033
- Table 25: Benelux Glass Packaging Recycling Service Revenue (undefined) Forecast, by Application 2020 & 2033
- Table 26: Nordics Glass Packaging Recycling Service Revenue (undefined) Forecast, by Application 2020 & 2033
- Table 27: Rest of Europe Glass Packaging Recycling Service Revenue (undefined) Forecast, by Application 2020 & 2033
- Table 28: Global Glass Packaging Recycling Service Revenue undefined Forecast, by Application 2020 & 2033
- Table 29: Global Glass Packaging Recycling Service Revenue undefined Forecast, by Type 2020 & 2033
- Table 30: Global Glass Packaging Recycling Service Revenue undefined Forecast, by Country 2020 & 2033
- Table 31: Turkey Glass Packaging Recycling Service Revenue (undefined) Forecast, by Application 2020 & 2033
- Table 32: Israel Glass Packaging Recycling Service Revenue (undefined) Forecast, by Application 2020 & 2033
- Table 33: GCC Glass Packaging Recycling Service Revenue (undefined) Forecast, by Application 2020 & 2033
- Table 34: North Africa Glass Packaging Recycling Service Revenue (undefined) Forecast, by Application 2020 & 2033
- Table 35: South Africa Glass Packaging Recycling Service Revenue (undefined) Forecast, by Application 2020 & 2033
- Table 36: Rest of Middle East & Africa Glass Packaging Recycling Service Revenue (undefined) Forecast, by Application 2020 & 2033
- Table 37: Global Glass Packaging Recycling Service Revenue undefined Forecast, by Application 2020 & 2033
- Table 38: Global Glass Packaging Recycling Service Revenue undefined Forecast, by Type 2020 & 2033
- Table 39: Global Glass Packaging Recycling Service Revenue undefined Forecast, by Country 2020 & 2033
- Table 40: China Glass Packaging Recycling Service Revenue (undefined) Forecast, by Application 2020 & 2033
- Table 41: India Glass Packaging Recycling Service Revenue (undefined) Forecast, by Application 2020 & 2033
- Table 42: Japan Glass Packaging Recycling Service Revenue (undefined) Forecast, by Application 2020 & 2033
- Table 43: South Korea Glass Packaging Recycling Service Revenue (undefined) Forecast, by Application 2020 & 2033
- Table 44: ASEAN Glass Packaging Recycling Service Revenue (undefined) Forecast, by Application 2020 & 2033
- Table 45: Oceania Glass Packaging Recycling Service Revenue (undefined) Forecast, by Application 2020 & 2033
- Table 46: Rest of Asia Pacific Glass Packaging Recycling Service Revenue (undefined) Forecast, by Application 2020 & 2033
Frequently Asked Questions
1. What is the projected Compound Annual Growth Rate (CAGR) of the Glass Packaging Recycling Service?
The projected CAGR is approximately 6.4%.
2. Which companies are prominent players in the Glass Packaging Recycling Service?
Key companies in the market include Veolia, Ardagh Group, Strategic Materials, Sibelco, Vetropack Group, Visy, Binder+Co, Momentum Recycling, Spring Pool Glass, Glass Recycling UK, Jado Recycling, Glass Half Full, Ripple Glass, Rumpke, GFL Environmental, Renewi, Shanghai Yanlongji.
3. What are the main segments of the Glass Packaging Recycling Service?
The market segments include Application, Type.
4. Can you provide details about the market size?
The market size is estimated to be USD XXX N/A as of 2022.
5. What are some drivers contributing to market growth?
N/A
6. What are the notable trends driving market growth?
N/A
7. Are there any restraints impacting market growth?
N/A
8. Can you provide examples of recent developments in the market?
N/A
9. What pricing options are available for accessing the report?
Pricing options include single-user, multi-user, and enterprise licenses priced at USD 2900.00, USD 4350.00, and USD 5800.00 respectively.
10. Is the market size provided in terms of value or volume?
The market size is provided in terms of value, measured in N/A.
11. Are there any specific market keywords associated with the report?
Yes, the market keyword associated with the report is "Glass Packaging Recycling Service," which aids in identifying and referencing the specific market segment covered.
12. How do I determine which pricing option suits my needs best?
The pricing options vary based on user requirements and access needs. Individual users may opt for single-user licenses, while businesses requiring broader access may choose multi-user or enterprise licenses for cost-effective access to the report.
13. Are there any additional resources or data provided in the Glass Packaging Recycling Service report?
While the report offers comprehensive insights, it's advisable to review the specific contents or supplementary materials provided to ascertain if additional resources or data are available.
14. How can I stay updated on further developments or reports in the Glass Packaging Recycling Service?
To stay informed about further developments, trends, and reports in the Glass Packaging Recycling Service, consider subscribing to industry newsletters, following relevant companies and organizations, or regularly checking reputable industry news sources and publications.
Methodology
Step 1 - Identification of Relevant Samples Size from Population Database


Step 2 - Approaches for Defining Global Market Size (Value, Volume* & Price*)

Note*: In applicable scenarios
Step 3 - Data Sources
Primary Research
- Web Analytics
- Survey Reports
- Research Institute
- Latest Research Reports
- Opinion Leaders
Secondary Research
- Annual Reports
- White Paper
- Latest Press Release
- Industry Association
- Paid Database
- Investor Presentations

Step 4 - Data Triangulation
Involves using different sources of information in order to increase the validity of a study
These sources are likely to be stakeholders in a program - participants, other researchers, program staff, other community members, and so on.
Then we put all data in single framework & apply various statistical tools to find out the dynamic on the market.
During the analysis stage, feedback from the stakeholder groups would be compared to determine areas of agreement as well as areas of divergence