

Key Insights
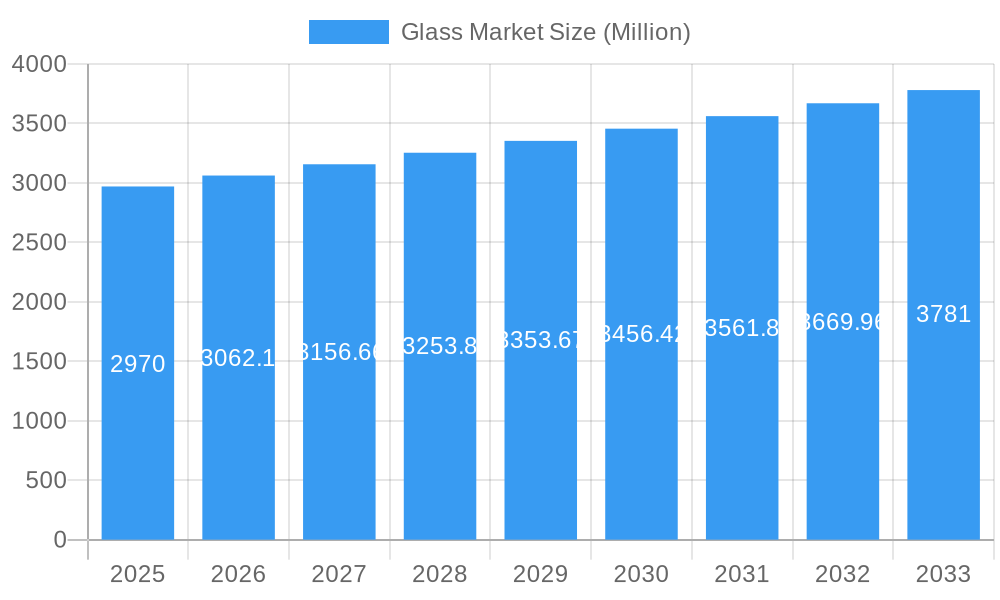
The global glass market, valued at $2.97 billion in 2025, is projected to experience robust growth, exceeding a 3% CAGR from 2025 to 2033. This expansion is fueled by several key drivers. The burgeoning construction and infrastructure sectors, particularly in rapidly developing economies in Asia-Pacific, significantly contribute to the demand for architectural and building glass. Simultaneously, the escalating adoption of renewable energy technologies, such as solar panels, is boosting the demand for specialized glass types like borosilicate glass. Advancements in display technologies for electronics and the automotive industry further fuel market growth, requiring high-quality, specialized glasses. The growing popularity of ophthalmic lenses and medical equipment incorporating glass components also contributes to market expansion. However, the market faces challenges, including fluctuating raw material prices (like silica sand and soda ash) and environmental concerns associated with glass production. Competition among established players and the emergence of new entrants further shapes the market dynamics. Segment-wise, borosilicate glass and soda-lime glass dominate, but insulated and decorative glass segments are poised for significant growth, driven by aesthetic preferences and energy-efficiency requirements in building design. Geographically, North America and Europe currently hold substantial market shares; however, the Asia-Pacific region is expected to witness the most significant growth in the coming years, driven by rapid industrialization and urbanization.
Glass Market Market Size (In Billion)
The competitive landscape is characterized by a mix of global giants like Corning Incorporated, Saint-Gobain, and AGC Inc., alongside regional players. These companies are constantly innovating to cater to diverse market needs, focusing on product diversification, technological advancements, and sustainable manufacturing practices. Strategic partnerships and mergers and acquisitions are also common strategies employed to enhance market presence and technological capabilities. Future market growth will depend on continuous innovation in glass compositions, improved manufacturing processes to reduce environmental impact, and catering to specific application requirements across various industries. The market segmentation offers opportunities for specialized manufacturers, focusing on niches like high-performance glass for solar applications or advanced optical glass for telecommunications.
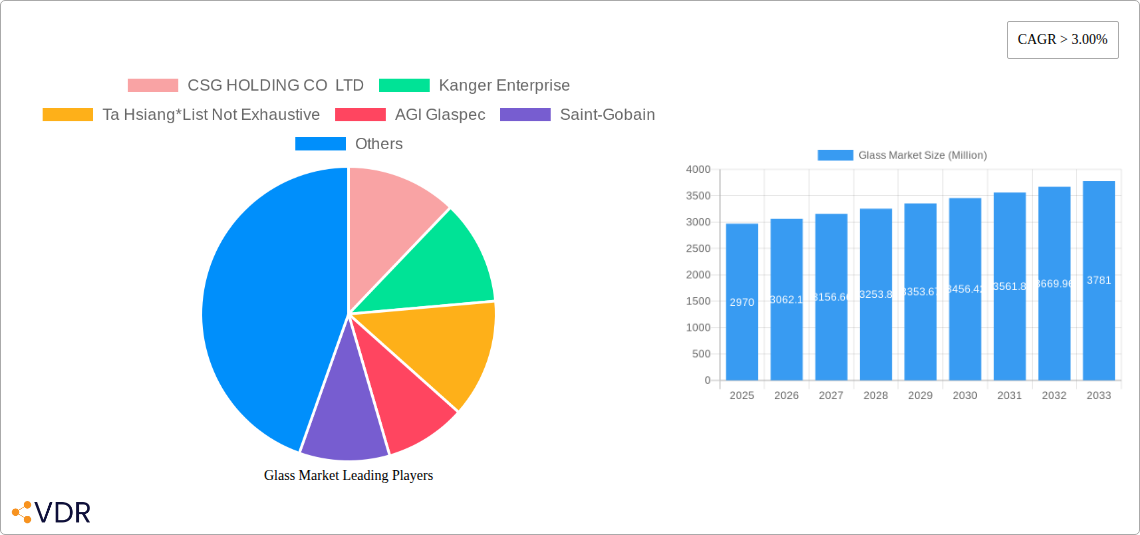
Glass Market Company Market Share
Glass Market: A Comprehensive Market Analysis (2019-2033)
This in-depth report provides a comprehensive analysis of the global glass market, encompassing market dynamics, growth trends, regional dominance, product landscape, key players, and future outlook. The study period covers 2019-2033, with 2025 as the base year and forecast period spanning 2025-2033. The report segments the market by type (Borosilicate Glass, Soda-Lime Glass, Other Types) and application (Lighting, Ophthalmic Lenses, Display Screens, Telecommunication, Architecture, Medical Equipments, Renewable Energy, Other Applications), offering granular insights for informed decision-making. The total market size is projected to reach xx Million units by 2033.
Glass Market Dynamics & Structure
The global glass market is characterized by a moderately concentrated structure with a few major players holding significant market share. Technological innovation, particularly in specialized glass types like borosilicate and insulated glass, is a key driver, alongside stringent regulatory frameworks concerning safety and environmental impact. Competitive pressures from substitute materials like plastics are also present, albeit limited in certain high-performance applications. The end-user demographics are diverse, spanning construction, automotive, electronics, and healthcare sectors. M&A activity has been relatively moderate in recent years, with a total deal volume of approximately xx deals in the past five years, resulting in a xx% market share consolidation among the top players.
- Market Concentration: Moderately concentrated, with top 5 players holding xx% market share (2024).
- Technological Innovation: Focus on energy-efficient glass, self-cleaning glass, and advanced coatings.
- Regulatory Landscape: Stringent safety and environmental regulations impacting production and disposal.
- Competitive Substitutes: Plastics and alternative materials posing challenges in specific segments.
- M&A Activity: xx deals in the past five years, leading to xx% market share consolidation.
Glass Market Growth Trends & Insights
The global glass market has demonstrated robust and consistent growth throughout the historical period (2019-2024), propelled by a confluence of escalating demand from pivotal sectors such as construction, consumer electronics, and the rapidly expanding renewable energy industry. The market achieved an impressive size of approximately **[Insert Specific Market Size Value] Million units in 2024**, showcasing a Compound Annual Growth Rate (CAGR) of **[Insert Specific CAGR Value]%** during this timeframe. This upward trajectory is significantly influenced by continuous technological advancements, particularly in sophisticated display technologies and the development of highly energy-efficient building materials, which are acting as powerful catalysts for market expansion. Furthermore, evolving consumer preferences towards environmentally sustainable and energy-efficient products are actively contributing to the sustained surge in demand. Projections for the forecast period (2025-2033) indicate a continuation of this growth momentum, fueled by accelerating urbanization trends, rising disposable incomes across emerging economies, and ongoing technological innovations that are creating new applications and enhancing existing ones.
- Estimated Market Size (2024): [Insert Specific Market Size Value] Million units
- Historical CAGR (2019-2024): [Insert Specific CAGR Value]%
- Market Penetration (2024): Significant penetration observed in developing regions, estimated at [Insert Specific Penetration Value]%.
- Key Growth Drivers: Sustained technological advancements, rapid urbanization, increasing disposable incomes, and a strong emphasis on sustainable and energy-efficient building practices.
Dominant Regions, Countries, or Segments in Glass Market
The **Asia-Pacific region** stands as the undisputed leader in the global glass market, capturing an estimated **[Insert Specific Market Share Value]%** of the total market share in 2024. This dominance is intrinsically linked to the region's rapid infrastructure development, a burgeoning construction sector, and a thriving electronics industry. Within this powerhouse region, **China and India** are prominent countries driving significant market activity. Analyzing the product landscape, **soda-lime glass** continues to command the largest market share, primarily due to its inherent cost-effectiveness and its extensive range of applications across various industries. When considering end-use applications, the **construction and architecture sectors** represent the primary engine of market growth, closely followed by the increasingly vital **electronics and automotive industries**.
- Leading Global Region: Asia-Pacific (estimated [Insert Specific Market Share Value]% market share in 2024)
- Key Dominant Countries: China and India
- Most Prevalent Glass Type: Soda-Lime Glass
- Primary Application Sectors: Construction and Architecture, closely followed by Electronics and Automotive.
- Underlying Growth Catalysts: Extensive infrastructure development initiatives, rapid urbanization, robust industrial expansion, and supportive government policies.
Glass Market Product Landscape
The glass market presents a rich and varied product portfolio, encompassing specialized materials like borosilicate glass, renowned for its exceptional thermal shock resistance and suitability for high-temperature applications, alongside the ubiquitous soda-lime glass, a versatile choice for a wide array of general-purpose uses. The market also features advanced solutions such as insulated glass units (IGUs), crucial for energy efficiency in buildings, and a growing segment of decorative glass that enhances aesthetic appeal. Current technological advancements are sharply focused on delivering enhanced energy efficiency through superior thermal insulation, increased durability for longer product lifespans, and refined aesthetic qualities that meet evolving design trends. Key unique selling propositions that are differentiating products include the development of self-cleaning glass surfaces, enhanced light transmission capabilities for optimized illumination, and the integration of advanced coatings designed for superior solar control and UV protection.
Key Drivers, Barriers & Challenges in Glass Market
Key Drivers:
- Increasing demand from construction & infrastructure projects.
- Technological advancements in glass production & applications.
- Growing adoption of energy-efficient glass in buildings and vehicles.
- Expansion of electronics and renewable energy sectors.
Key Challenges:
- Fluctuations in raw material prices (e.g., silica sand, soda ash).
- High energy consumption in glass manufacturing leading to increased production costs.
- Stringent environmental regulations impacting waste management.
- Intense competition from substitute materials.
Emerging Opportunities in Glass Market
- Growing demand for specialized glasses in medical devices and pharmaceuticals.
- Expansion into new applications like flexible displays and wearable electronics.
- Development of smart glass technologies with integrated functionalities.
- Focus on sustainable and eco-friendly glass manufacturing processes.
Growth Accelerators in the Glass Market Industry
Technological breakthroughs in glass production and processing are key growth accelerators. Strategic partnerships between glass manufacturers and technology companies are creating innovative applications. Market expansion strategies focusing on emerging economies are driving significant growth.
Key Players Shaping the Glass Market Market
- CSG HOLDING CO LTD
- Kanger Enterprise
- Ta Hsiang
- AGI Glaspec
- Saint-Gobain
- DWK Life Sciences
- Cardinal Glass Industries Inc
- Fuyao Glass Industry
- Sichuan Shubo (Group) Co Ltd
- Nippon Electric Glass Co Ltd
- AGC Inc
- Gerresheimer AG
- Lino
- Corning Incorporated
- SCHOTT AG
Notable Milestones in Glass Market Sector
- January 2022: AGI Glaspec, a prominent player in India, significantly expanded its operational footprint and product offerings by inaugurating its specialty glass division. This strategic move involved a substantial investment of USD 4000 million, reinforcing its presence and capabilities within the dynamic Asia-Pacific market.
- [Insert Year]: [Insert Company Name] launched [Insert Product/Innovation], featuring [Briefly describe key features and benefits, e.g., enhanced energy efficiency, improved safety, or novel aesthetic properties], further driving innovation in the [Specify segment, e.g., architectural glass, display glass] sector.
- [Insert Year]: A new manufacturing facility dedicated to [Specify type of glass, e.g., solar glass, automotive glass] was opened by [Insert Company Name] in [Insert Location], aiming to meet the growing demand from [Specify end-use industry].
In-Depth Glass Market Market Outlook
The future of the glass market looks promising, driven by technological innovations, increasing demand from various end-use sectors, and strategic investments by key players. Opportunities exist in specialized glass segments, sustainable manufacturing processes, and emerging applications. Companies focusing on innovation and strategic partnerships are well-positioned for significant growth in the coming years.
Glass Market Segmentation
-
1. Type
- 1.1. Borosilicate Glass
- 1.2. Soda-Lime Glass
- 1.3. Other Ty
-
2. Applications
- 2.1. Lighting
- 2.2. Ophthamalic Lenses
- 2.3. Display Screens
- 2.4. Telecommunication
- 2.5. Architecture
- 2.6. Medical Equipments
- 2.7. Renewable Energy
- 2.8. Other Ap
Glass Market Segmentation By Geography
-
1. Asia Pacific
- 1.1. China
- 1.2. India
- 1.3. Japan
- 1.4. South Korea
- 1.5. Malaysia
- 1.6. Thailand
- 1.7. Indonesia
- 1.8. Vietnam
- 1.9. Rest of Asia Pacific
-
2. North America
- 2.1. United States
- 2.2. Canada
- 2.3. Mexico
-
3. Europe
- 3.1. Germany
- 3.2. United Kingdom
- 3.3. Italy
- 3.4. France
- 3.5. Spain
- 3.6. NORDIC
- 3.7. Turkey
- 3.8. Russia
- 3.9. Rest of Europe
-
4. South America
- 4.1. Brazil
- 4.2. Argentina
- 4.3. Colombia
- 4.4. Rest of South America
-
5. Middle East and Africa
- 5.1. Saudi Arabia
- 5.2. South Africa
- 5.3. Nigeria
- 5.4. Qatar
- 5.5. Egypt
- 5.6. UAE
- 5.7. Rest of Middle East and Africa
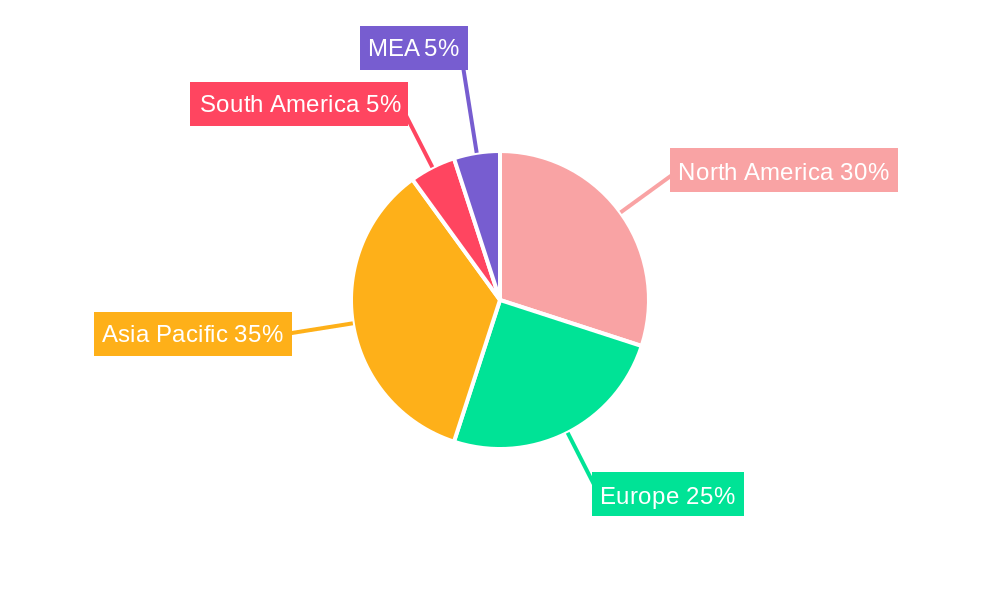
Glass Market Regional Market Share
Geographic Coverage of Glass Market
Glass Market REPORT HIGHLIGHTS
| Aspects | Details |
|---|---|
| Study Period | 2020-2034 |
| Base Year | 2025 |
| Estimated Year | 2026 |
| Forecast Period | 2026-2034 |
| Historical Period | 2020-2025 |
| Growth Rate | CAGR of > 3.00% from 2020-2034 |
| Segmentation |
|
Table of Contents
- 1. Introduction
- 1.1. Research Scope
- 1.2. Market Segmentation
- 1.3. Research Objective
- 1.4. Definitions and Assumptions
- 2. Executive Summary
- 2.1. Market Snapshot
- 3. Market Dynamics
- 3.1. Market Drivers
- 3.2. Market Restrains
- 3.3. Market Trends
- 3.4. Market Opportunities
- 4. Market Factor Analysis
- 4.1. Porters Five Forces
- 4.1.1. Bargaining Power of Suppliers
- 4.1.2. Bargaining Power of Buyers
- 4.1.3. Threat of New Entrants
- 4.1.4. Threat of Substitutes
- 4.1.5. Competitive Rivalry
- 4.2. PESTEL analysis
- 4.3. BCG Analysis
- 4.3.1. Stars (High Growth, High Market Share)
- 4.3.2. Cash Cows (Low Growth, High Market Share)
- 4.3.3. Question Mark (High Growth, Low Market Share)
- 4.3.4. Dogs (Low Growth, Low Market Share)
- 4.4. Ansoff Matrix Analysis
- 4.5. Supply Chain Analysis
- 4.6. Regulatory Landscape
- 4.7. Current Market Potential and Opportunity Assessment (TAM–SAM–SOM Framework)
- 4.8. VDR Analyst Note
- 4.1. Porters Five Forces
- 5. Market Analysis, Insights and Forecast 2021-2033
- 5.1. Market Analysis, Insights and Forecast - by Type
- 5.1.1. Borosilicate Glass
- 5.1.2. Soda-Lime Glass
- 5.1.3. Other Ty
- 5.2. Market Analysis, Insights and Forecast - by Applications
- 5.2.1. Lighting
- 5.2.2. Ophthamalic Lenses
- 5.2.3. Display Screens
- 5.2.4. Telecommunication
- 5.2.5. Architecture
- 5.2.6. Medical Equipments
- 5.2.7. Renewable Energy
- 5.2.8. Other Ap
- 5.3. Market Analysis, Insights and Forecast - by Region
- 5.3.1. Asia Pacific
- 5.3.2. North America
- 5.3.3. Europe
- 5.3.4. South America
- 5.3.5. Middle East and Africa
- 5.1. Market Analysis, Insights and Forecast - by Type
- 6. Global Glass Market Analysis, Insights and Forecast, 2021-2033
- 6.1. Market Analysis, Insights and Forecast - by Type
- 6.1.1. Borosilicate Glass
- 6.1.2. Soda-Lime Glass
- 6.1.3. Other Ty
- 6.2. Market Analysis, Insights and Forecast - by Applications
- 6.2.1. Lighting
- 6.2.2. Ophthamalic Lenses
- 6.2.3. Display Screens
- 6.2.4. Telecommunication
- 6.2.5. Architecture
- 6.2.6. Medical Equipments
- 6.2.7. Renewable Energy
- 6.2.8. Other Ap
- 6.1. Market Analysis, Insights and Forecast - by Type
- 7. Asia Pacific Glass Market Analysis, Insights and Forecast, 2021-2033
- 7.1. Market Analysis, Insights and Forecast - by Type
- 7.1.1. Borosilicate Glass
- 7.1.2. Soda-Lime Glass
- 7.1.3. Other Ty
- 7.2. Market Analysis, Insights and Forecast - by Applications
- 7.2.1. Lighting
- 7.2.2. Ophthamalic Lenses
- 7.2.3. Display Screens
- 7.2.4. Telecommunication
- 7.2.5. Architecture
- 7.2.6. Medical Equipments
- 7.2.7. Renewable Energy
- 7.2.8. Other Ap
- 7.1. Market Analysis, Insights and Forecast - by Type
- 8. North America Glass Market Analysis, Insights and Forecast, 2021-2033
- 8.1. Market Analysis, Insights and Forecast - by Type
- 8.1.1. Borosilicate Glass
- 8.1.2. Soda-Lime Glass
- 8.1.3. Other Ty
- 8.2. Market Analysis, Insights and Forecast - by Applications
- 8.2.1. Lighting
- 8.2.2. Ophthamalic Lenses
- 8.2.3. Display Screens
- 8.2.4. Telecommunication
- 8.2.5. Architecture
- 8.2.6. Medical Equipments
- 8.2.7. Renewable Energy
- 8.2.8. Other Ap
- 8.1. Market Analysis, Insights and Forecast - by Type
- 9. Europe Glass Market Analysis, Insights and Forecast, 2021-2033
- 9.1. Market Analysis, Insights and Forecast - by Type
- 9.1.1. Borosilicate Glass
- 9.1.2. Soda-Lime Glass
- 9.1.3. Other Ty
- 9.2. Market Analysis, Insights and Forecast - by Applications
- 9.2.1. Lighting
- 9.2.2. Ophthamalic Lenses
- 9.2.3. Display Screens
- 9.2.4. Telecommunication
- 9.2.5. Architecture
- 9.2.6. Medical Equipments
- 9.2.7. Renewable Energy
- 9.2.8. Other Ap
- 9.1. Market Analysis, Insights and Forecast - by Type
- 10. South America Glass Market Analysis, Insights and Forecast, 2021-2033
- 10.1. Market Analysis, Insights and Forecast - by Type
- 10.1.1. Borosilicate Glass
- 10.1.2. Soda-Lime Glass
- 10.1.3. Other Ty
- 10.2. Market Analysis, Insights and Forecast - by Applications
- 10.2.1. Lighting
- 10.2.2. Ophthamalic Lenses
- 10.2.3. Display Screens
- 10.2.4. Telecommunication
- 10.2.5. Architecture
- 10.2.6. Medical Equipments
- 10.2.7. Renewable Energy
- 10.2.8. Other Ap
- 10.1. Market Analysis, Insights and Forecast - by Type
- 11. Middle East and Africa Glass Market Analysis, Insights and Forecast, 2021-2033
- 11.1. Market Analysis, Insights and Forecast - by Type
- 11.1.1. Borosilicate Glass
- 11.1.2. Soda-Lime Glass
- 11.1.3. Other Ty
- 11.2. Market Analysis, Insights and Forecast - by Applications
- 11.2.1. Lighting
- 11.2.2. Ophthamalic Lenses
- 11.2.3. Display Screens
- 11.2.4. Telecommunication
- 11.2.5. Architecture
- 11.2.6. Medical Equipments
- 11.2.7. Renewable Energy
- 11.2.8. Other Ap
- 11.1. Market Analysis, Insights and Forecast - by Type
- 12. Competitive Analysis
- 12.1. Company Profiles
- 12.1.1 CSG HOLDING CO LTD
- 12.1.1.1. Company Overview
- 12.1.1.2. Products
- 12.1.1.3. Company Financials
- 12.1.1.4. SWOT Analysis
- 12.1.2 Kanger Enterprise
- 12.1.2.1. Company Overview
- 12.1.2.2. Products
- 12.1.2.3. Company Financials
- 12.1.2.4. SWOT Analysis
- 12.1.3 Ta Hsiang*List Not Exhaustive
- 12.1.3.1. Company Overview
- 12.1.3.2. Products
- 12.1.3.3. Company Financials
- 12.1.3.4. SWOT Analysis
- 12.1.4 AGI Glaspec
- 12.1.4.1. Company Overview
- 12.1.4.2. Products
- 12.1.4.3. Company Financials
- 12.1.4.4. SWOT Analysis
- 12.1.5 Saint-Gobain
- 12.1.5.1. Company Overview
- 12.1.5.2. Products
- 12.1.5.3. Company Financials
- 12.1.5.4. SWOT Analysis
- 12.1.6 DWK Life Sciences
- 12.1.6.1. Company Overview
- 12.1.6.2. Products
- 12.1.6.3. Company Financials
- 12.1.6.4. SWOT Analysis
- 12.1.7 Cardinal Glass Industries Inc
- 12.1.7.1. Company Overview
- 12.1.7.2. Products
- 12.1.7.3. Company Financials
- 12.1.7.4. SWOT Analysis
- 12.1.8 Fuyao Glass Industry
- 12.1.8.1. Company Overview
- 12.1.8.2. Products
- 12.1.8.3. Company Financials
- 12.1.8.4. SWOT Analysis
- 12.1.9 Sichuan Shubo (Group) Co Ltd
- 12.1.9.1. Company Overview
- 12.1.9.2. Products
- 12.1.9.3. Company Financials
- 12.1.9.4. SWOT Analysis
- 12.1.10 Nippon Electric Glass Co Ltd
- 12.1.10.1. Company Overview
- 12.1.10.2. Products
- 12.1.10.3. Company Financials
- 12.1.10.4. SWOT Analysis
- 12.1.11 AGC Inc
- 12.1.11.1. Company Overview
- 12.1.11.2. Products
- 12.1.11.3. Company Financials
- 12.1.11.4. SWOT Analysis
- 12.1.12 Gerresheimer AG
- 12.1.12.1. Company Overview
- 12.1.12.2. Products
- 12.1.12.3. Company Financials
- 12.1.12.4. SWOT Analysis
- 12.1.13 Lino
- 12.1.13.1. Company Overview
- 12.1.13.2. Products
- 12.1.13.3. Company Financials
- 12.1.13.4. SWOT Analysis
- 12.1.14 Corning Incorporated
- 12.1.14.1. Company Overview
- 12.1.14.2. Products
- 12.1.14.3. Company Financials
- 12.1.14.4. SWOT Analysis
- 12.1.15 SCHOTT AG
- 12.1.15.1. Company Overview
- 12.1.15.2. Products
- 12.1.15.3. Company Financials
- 12.1.15.4. SWOT Analysis
- 12.1.1 CSG HOLDING CO LTD
- 12.2. Market Entropy
- 12.2.1 Company's Key Areas Served
- 12.2.2 Recent Developments
- 12.3. Company Market Share Analysis 2025
- 12.3.1 Top 5 Companies Market Share Analysis
- 12.3.2 Top 3 Companies Market Share Analysis
- 12.4. List of Potential Customers
- 13. Research Methodology
List of Figures
- Figure 1: Global Glass Market Revenue Breakdown (Million, %) by Region 2025 & 2033
- Figure 2: Asia Pacific Glass Market Revenue (Million), by Type 2025 & 2033
- Figure 3: Asia Pacific Glass Market Revenue Share (%), by Type 2025 & 2033
- Figure 4: Asia Pacific Glass Market Revenue (Million), by Applications 2025 & 2033
- Figure 5: Asia Pacific Glass Market Revenue Share (%), by Applications 2025 & 2033
- Figure 6: Asia Pacific Glass Market Revenue (Million), by Country 2025 & 2033
- Figure 7: Asia Pacific Glass Market Revenue Share (%), by Country 2025 & 2033
- Figure 8: North America Glass Market Revenue (Million), by Type 2025 & 2033
- Figure 9: North America Glass Market Revenue Share (%), by Type 2025 & 2033
- Figure 10: North America Glass Market Revenue (Million), by Applications 2025 & 2033
- Figure 11: North America Glass Market Revenue Share (%), by Applications 2025 & 2033
- Figure 12: North America Glass Market Revenue (Million), by Country 2025 & 2033
- Figure 13: North America Glass Market Revenue Share (%), by Country 2025 & 2033
- Figure 14: Europe Glass Market Revenue (Million), by Type 2025 & 2033
- Figure 15: Europe Glass Market Revenue Share (%), by Type 2025 & 2033
- Figure 16: Europe Glass Market Revenue (Million), by Applications 2025 & 2033
- Figure 17: Europe Glass Market Revenue Share (%), by Applications 2025 & 2033
- Figure 18: Europe Glass Market Revenue (Million), by Country 2025 & 2033
- Figure 19: Europe Glass Market Revenue Share (%), by Country 2025 & 2033
- Figure 20: South America Glass Market Revenue (Million), by Type 2025 & 2033
- Figure 21: South America Glass Market Revenue Share (%), by Type 2025 & 2033
- Figure 22: South America Glass Market Revenue (Million), by Applications 2025 & 2033
- Figure 23: South America Glass Market Revenue Share (%), by Applications 2025 & 2033
- Figure 24: South America Glass Market Revenue (Million), by Country 2025 & 2033
- Figure 25: South America Glass Market Revenue Share (%), by Country 2025 & 2033
- Figure 26: Middle East and Africa Glass Market Revenue (Million), by Type 2025 & 2033
- Figure 27: Middle East and Africa Glass Market Revenue Share (%), by Type 2025 & 2033
- Figure 28: Middle East and Africa Glass Market Revenue (Million), by Applications 2025 & 2033
- Figure 29: Middle East and Africa Glass Market Revenue Share (%), by Applications 2025 & 2033
- Figure 30: Middle East and Africa Glass Market Revenue (Million), by Country 2025 & 2033
- Figure 31: Middle East and Africa Glass Market Revenue Share (%), by Country 2025 & 2033
List of Tables
- Table 1: Global Glass Market Revenue Million Forecast, by Type 2020 & 2033
- Table 2: Global Glass Market Revenue Million Forecast, by Applications 2020 & 2033
- Table 3: Global Glass Market Revenue Million Forecast, by Region 2020 & 2033
- Table 4: Global Glass Market Revenue Million Forecast, by Type 2020 & 2033
- Table 5: Global Glass Market Revenue Million Forecast, by Applications 2020 & 2033
- Table 6: Global Glass Market Revenue Million Forecast, by Country 2020 & 2033
- Table 7: China Glass Market Revenue (Million) Forecast, by Application 2020 & 2033
- Table 8: India Glass Market Revenue (Million) Forecast, by Application 2020 & 2033
- Table 9: Japan Glass Market Revenue (Million) Forecast, by Application 2020 & 2033
- Table 10: South Korea Glass Market Revenue (Million) Forecast, by Application 2020 & 2033
- Table 11: Malaysia Glass Market Revenue (Million) Forecast, by Application 2020 & 2033
- Table 12: Thailand Glass Market Revenue (Million) Forecast, by Application 2020 & 2033
- Table 13: Indonesia Glass Market Revenue (Million) Forecast, by Application 2020 & 2033
- Table 14: Vietnam Glass Market Revenue (Million) Forecast, by Application 2020 & 2033
- Table 15: Rest of Asia Pacific Glass Market Revenue (Million) Forecast, by Application 2020 & 2033
- Table 16: Global Glass Market Revenue Million Forecast, by Type 2020 & 2033
- Table 17: Global Glass Market Revenue Million Forecast, by Applications 2020 & 2033
- Table 18: Global Glass Market Revenue Million Forecast, by Country 2020 & 2033
- Table 19: United States Glass Market Revenue (Million) Forecast, by Application 2020 & 2033
- Table 20: Canada Glass Market Revenue (Million) Forecast, by Application 2020 & 2033
- Table 21: Mexico Glass Market Revenue (Million) Forecast, by Application 2020 & 2033
- Table 22: Global Glass Market Revenue Million Forecast, by Type 2020 & 2033
- Table 23: Global Glass Market Revenue Million Forecast, by Applications 2020 & 2033
- Table 24: Global Glass Market Revenue Million Forecast, by Country 2020 & 2033
- Table 25: Germany Glass Market Revenue (Million) Forecast, by Application 2020 & 2033
- Table 26: United Kingdom Glass Market Revenue (Million) Forecast, by Application 2020 & 2033
- Table 27: Italy Glass Market Revenue (Million) Forecast, by Application 2020 & 2033
- Table 28: France Glass Market Revenue (Million) Forecast, by Application 2020 & 2033
- Table 29: Spain Glass Market Revenue (Million) Forecast, by Application 2020 & 2033
- Table 30: NORDIC Glass Market Revenue (Million) Forecast, by Application 2020 & 2033
- Table 31: Turkey Glass Market Revenue (Million) Forecast, by Application 2020 & 2033
- Table 32: Russia Glass Market Revenue (Million) Forecast, by Application 2020 & 2033
- Table 33: Rest of Europe Glass Market Revenue (Million) Forecast, by Application 2020 & 2033
- Table 34: Global Glass Market Revenue Million Forecast, by Type 2020 & 2033
- Table 35: Global Glass Market Revenue Million Forecast, by Applications 2020 & 2033
- Table 36: Global Glass Market Revenue Million Forecast, by Country 2020 & 2033
- Table 37: Brazil Glass Market Revenue (Million) Forecast, by Application 2020 & 2033
- Table 38: Argentina Glass Market Revenue (Million) Forecast, by Application 2020 & 2033
- Table 39: Colombia Glass Market Revenue (Million) Forecast, by Application 2020 & 2033
- Table 40: Rest of South America Glass Market Revenue (Million) Forecast, by Application 2020 & 2033
- Table 41: Global Glass Market Revenue Million Forecast, by Type 2020 & 2033
- Table 42: Global Glass Market Revenue Million Forecast, by Applications 2020 & 2033
- Table 43: Global Glass Market Revenue Million Forecast, by Country 2020 & 2033
- Table 44: Saudi Arabia Glass Market Revenue (Million) Forecast, by Application 2020 & 2033
- Table 45: South Africa Glass Market Revenue (Million) Forecast, by Application 2020 & 2033
- Table 46: Nigeria Glass Market Revenue (Million) Forecast, by Application 2020 & 2033
- Table 47: Qatar Glass Market Revenue (Million) Forecast, by Application 2020 & 2033
- Table 48: Egypt Glass Market Revenue (Million) Forecast, by Application 2020 & 2033
- Table 49: UAE Glass Market Revenue (Million) Forecast, by Application 2020 & 2033
- Table 50: Rest of Middle East and Africa Glass Market Revenue (Million) Forecast, by Application 2020 & 2033
Frequently Asked Questions
1. What is the projected Compound Annual Growth Rate (CAGR) of the Glass Market?
The projected CAGR is approximately > 3.00%.
2. Which companies are prominent players in the Glass Market?
Key companies in the market include CSG HOLDING CO LTD, Kanger Enterprise, Ta Hsiang*List Not Exhaustive, AGI Glaspec, Saint-Gobain, DWK Life Sciences, Cardinal Glass Industries Inc, Fuyao Glass Industry, Sichuan Shubo (Group) Co Ltd, Nippon Electric Glass Co Ltd, AGC Inc, Gerresheimer AG, Lino, Corning Incorporated, SCHOTT AG.
3. What are the main segments of the Glass Market?
The market segments include Type, Applications.
4. Can you provide details about the market size?
The market size is estimated to be USD 2.97 Million as of 2022.
5. What are some drivers contributing to market growth?
Rising Demand for Solar Glass in the Renewable Energy and Construction Sector; Increasing Developments in Healthcare Sector; Other Drivers.
6. What are the notable trends driving market growth?
Increasing Emphasis on Utilizing Solar Glass Architecture Construction Application.
7. Are there any restraints impacting market growth?
Stringent environmental regulation regarding air and water pollution standards; Other Restraints.
8. Can you provide examples of recent developments in the market?
January 2022: AGI Glasspec of India inaugurated its specialty glass division with an investment of USD 4000 million. The investment will help the company to expand its specialty glass market in the Asia-Pacific region.
9. What pricing options are available for accessing the report?
Pricing options include single-user, multi-user, and enterprise licenses priced at USD 4750, USD 5250, and USD 8750 respectively.
10. Is the market size provided in terms of value or volume?
The market size is provided in terms of value, measured in Million.
11. Are there any specific market keywords associated with the report?
Yes, the market keyword associated with the report is "Glass Market," which aids in identifying and referencing the specific market segment covered.
12. How do I determine which pricing option suits my needs best?
The pricing options vary based on user requirements and access needs. Individual users may opt for single-user licenses, while businesses requiring broader access may choose multi-user or enterprise licenses for cost-effective access to the report.
13. Are there any additional resources or data provided in the Glass Market report?
While the report offers comprehensive insights, it's advisable to review the specific contents or supplementary materials provided to ascertain if additional resources or data are available.
14. How can I stay updated on further developments or reports in the Glass Market?
To stay informed about further developments, trends, and reports in the Glass Market, consider subscribing to industry newsletters, following relevant companies and organizations, or regularly checking reputable industry news sources and publications.
Methodology
Step 1 - Identification of Relevant Samples Size from Population Database


Step 2 - Approaches for Defining Global Market Size (Value, Volume* & Price*)

Note*: In applicable scenarios
Step 3 - Data Sources
Primary Research
- Web Analytics
- Survey Reports
- Research Institute
- Latest Research Reports
- Opinion Leaders
Secondary Research
- Annual Reports
- White Paper
- Latest Press Release
- Industry Association
- Paid Database
- Investor Presentations

Step 4 - Data Triangulation
Involves using different sources of information in order to increase the validity of a study
These sources are likely to be stakeholders in a program - participants, other researchers, program staff, other community members, and so on.
Then we put all data in single framework & apply various statistical tools to find out the dynamic on the market.
During the analysis stage, feedback from the stakeholder groups would be compared to determine areas of agreement as well as areas of divergence