

Key Insights
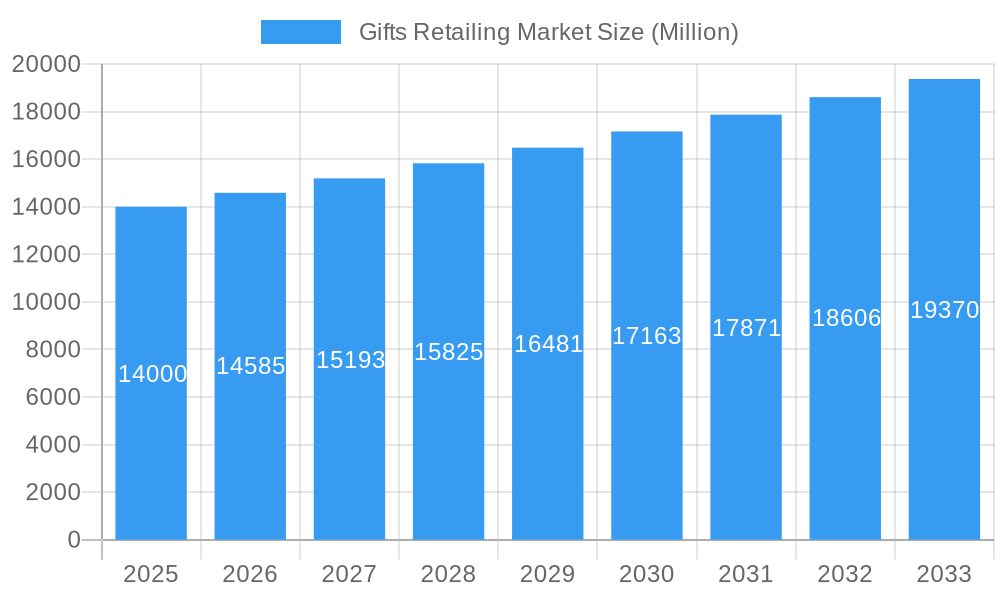
The global gifts retailing market, valued at approximately $14 billion in 2025, is projected to experience robust growth, exhibiting a compound annual growth rate (CAGR) of 4.12% from 2025 to 2033. This growth is fueled by several key factors. The increasing prevalence of gifting occasions, encompassing birthdays, holidays, anniversaries, and corporate events, consistently drives demand. Furthermore, the rise of e-commerce platforms has significantly expanded market accessibility, allowing consumers to conveniently browse and purchase gifts from a wider selection of retailers, both large and small. The growing popularity of personalized and experiential gifts, catering to individual preferences and creating memorable experiences, further contributes to market expansion. Strong competition exists among established players such as Hallmark Cards, Disney, and Amazon, alongside smaller, specialized gift retailers and online marketplaces, driving innovation and product diversification. The market is also segmented by product type (e.g., personalized gifts, luxury gifts, eco-friendly gifts), price point, and distribution channel (online vs. brick-and-mortar), reflecting diverse consumer preferences and purchasing behaviors.
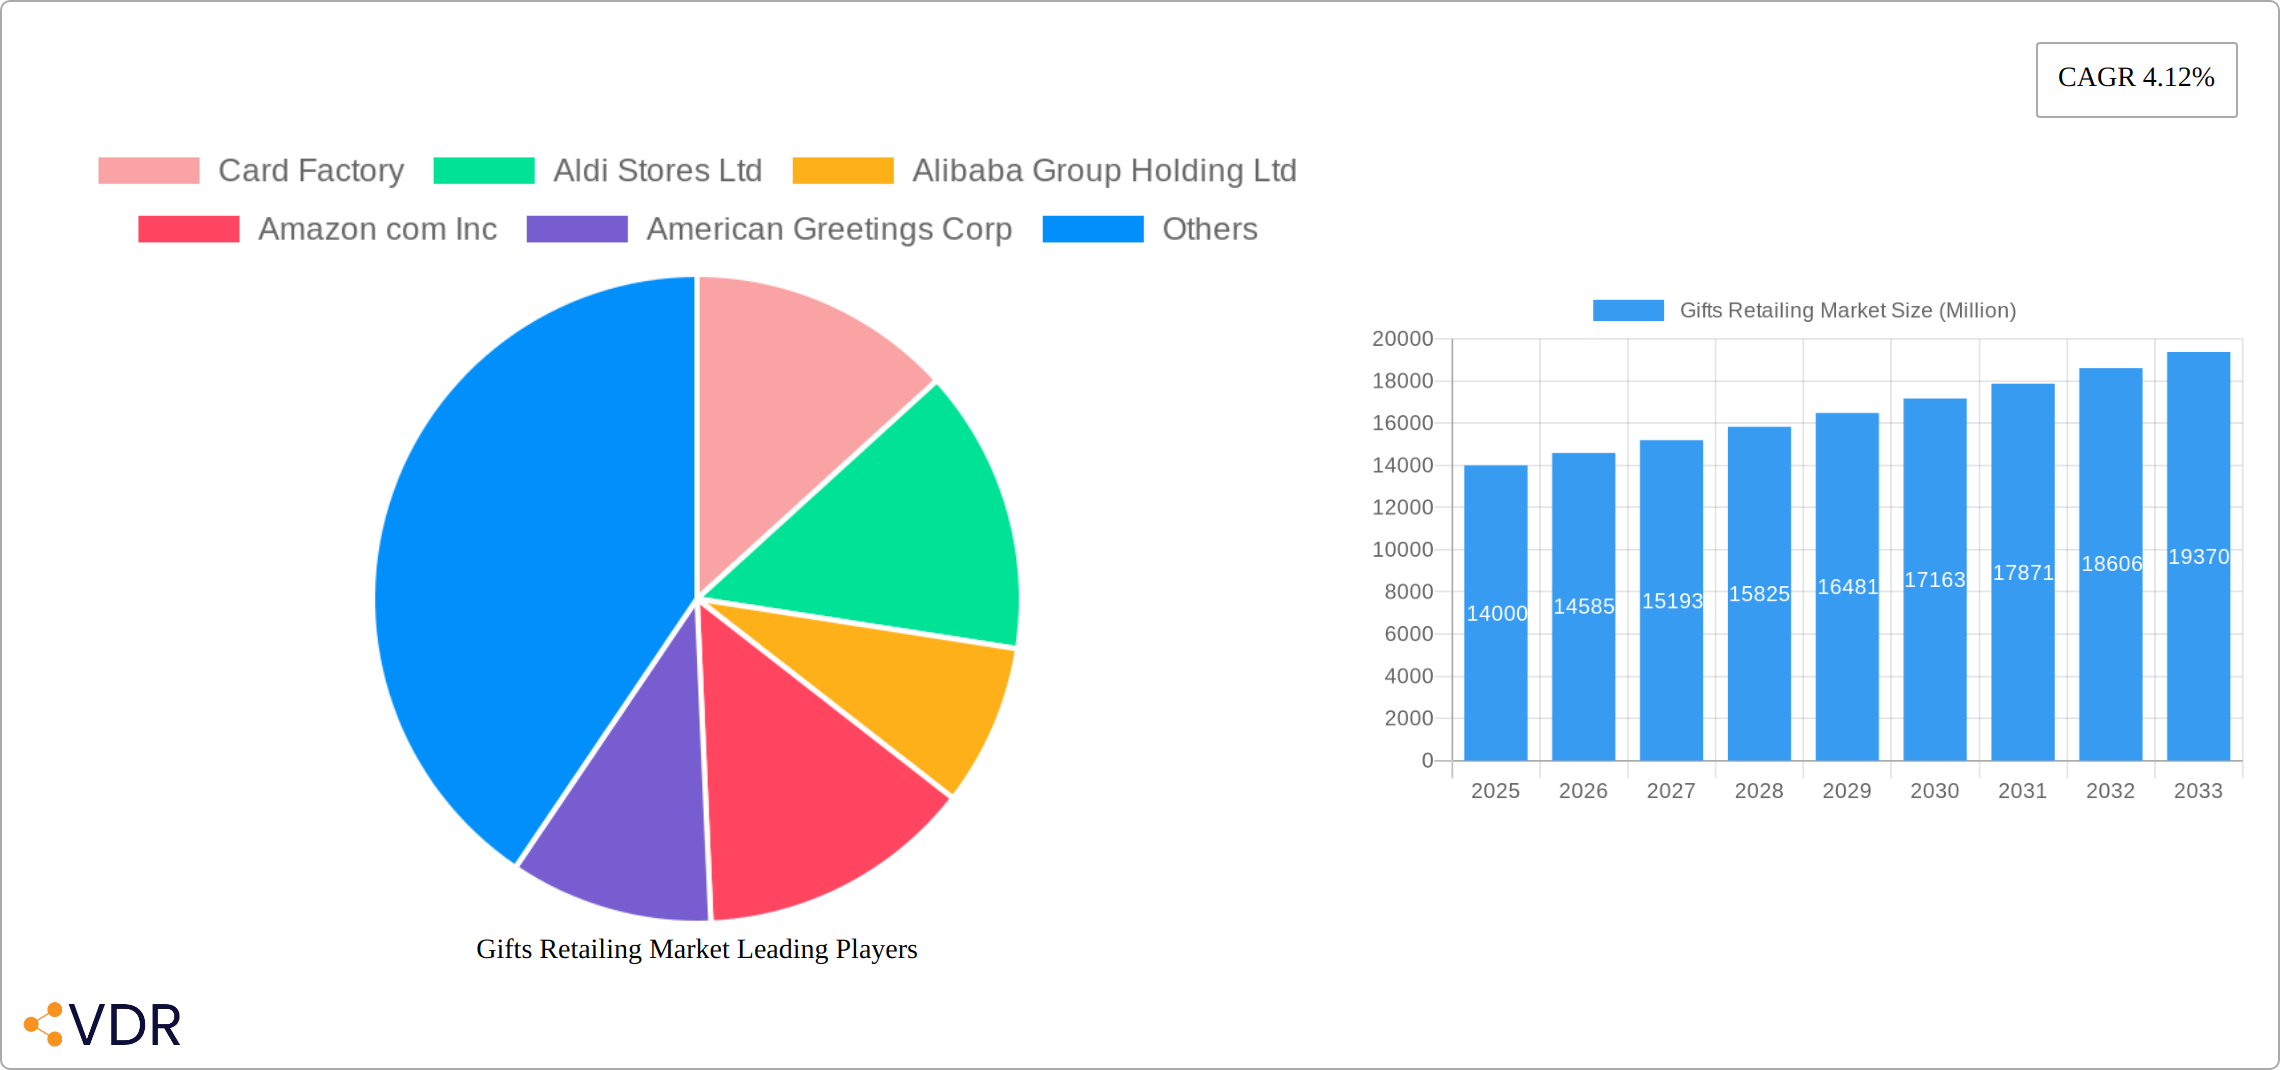
Gifts Retailing Market Market Size (In Billion)
Despite the positive outlook, the market faces certain challenges. Fluctuations in consumer spending due to economic downturns or inflation can impact gift purchases, particularly for non-essential items. Increased competition and the need to maintain strong brand loyalty present ongoing challenges for established players. Moreover, maintaining sustainable sourcing and ethical production practices are increasingly crucial considerations for gift retailers aiming to resonate with environmentally and socially conscious consumers. The successful companies are those adapting to changing consumer preferences through diversification, personalization, and robust omnichannel strategies, incorporating both online and offline sales channels. The market's continued growth hinges on effectively addressing these challenges and capitalizing on emerging trends.
Gifts Retailing Market Company Market Share
This comprehensive report provides an in-depth analysis of the global Gifts Retailing Market, encompassing the parent market of Retail and the child market of Gift Retailing. It covers the period from 2019 to 2033, with a focus on the forecast period 2025-2033, utilizing 2025 as the base year and estimated year. The report offers invaluable insights for industry professionals, investors, and strategists seeking to navigate this dynamic market. The total market size is projected to reach xx Million units by 2033.
Gifts Retailing Market Dynamics & Structure
The Gifts Retailing Market is characterized by a moderately concentrated structure, with key players such as Hallmark Cards Inc, Amazon com Inc, and The Walt Disney Co holding significant market shares. Technological innovation, particularly in e-commerce and personalized gifting, is a major driver of market growth. However, regulatory frameworks concerning product safety and consumer protection influence market dynamics. Competitive substitutes, such as experiential gifts and digital gift cards, present challenges. The end-user demographic is diverse, ranging from individuals to corporations, influencing purchasing patterns and preferences. M&A activity in the sector is relatively moderate, with xx deals recorded in the historical period (2019-2024), representing an average of xx deals per year.
- Market Concentration: Moderately concentrated, with top 5 players holding xx% market share (2024).
- Technological Innovation: E-commerce platforms, personalized gift creation tools, and augmented reality experiences are key drivers.
- Regulatory Framework: Compliance with product safety standards and consumer protection laws is crucial.
- Competitive Substitutes: Experiential gifts, digital gift cards, and subscription boxes pose competition.
- End-User Demographics: Diverse, including individuals, corporations, and organizations, leading to varied purchasing behaviors.
- M&A Trends: Moderate activity observed in the historical period, with an average of xx deals per year. Innovation barriers include high R&D costs and maintaining supply chain stability across different geographies.
Gifts Retailing Market Growth Trends & Insights
The Gifts Retailing Market experienced robust growth between 2019 and 2024, demonstrating a significant Compound Annual Growth Rate (CAGR) of xx%. This expansion is fueled by several key factors: a rise in disposable incomes across emerging economies, increased consumer spending driven by gifting occasions, and the burgeoning popularity of online gift-shopping platforms. The market's trajectory is further shaped by technological advancements. Personalized gifting options, AI-powered recommendation engines, and sophisticated e-commerce platforms have profoundly impacted consumer behavior, boosting engagement and purchase frequency. The online gifting channel penetration rate reached xx% in 2024 and is projected to achieve xx% by 2033, indicating substantial future growth potential. This expansion is also driven by changing consumer preferences towards unique and experiential gifts, creating opportunities for specialized retailers and online marketplaces.
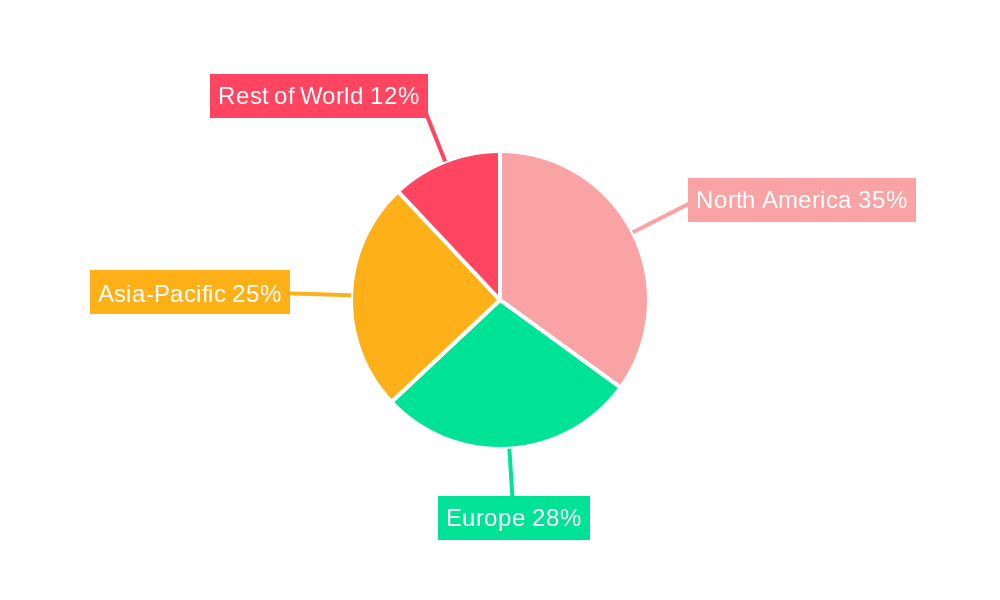
Dominant Regions, Countries, or Segments in Gifts Retailing Market
North America currently dominates the Gifts Retailing Market, accounting for xx% of the global market share in 2024. This dominance is largely driven by factors such as high consumer spending power, developed e-commerce infrastructure, and a strong culture of gift-giving. Other regions, particularly Europe and Asia-Pacific, are also experiencing significant growth, fueled by rising disposable incomes and increasing online penetration.
Key Drivers in North America:
- High consumer spending power.
- Well-established e-commerce infrastructure.
- Strong gifting culture.
Growth Potential in Asia-Pacific:
- Rapidly expanding middle class.
- Increasing online shopping adoption.
- Growing preference for personalized gifts.
The market segment of personalized gifts is projected to experience the fastest growth, with a CAGR of xx% during the forecast period. This is attributed to the rising demand for unique and customized gift options amongst consumers.
Gifts Retailing Market Product Landscape
The Gifts Retailing Market showcases a diverse product range, encompassing traditional options like greeting cards and gift baskets alongside innovative offerings such as personalized items and experiential gifts. Recent product innovations reflect ongoing technological advancements. Customized digital gifts, subscription boxes tailored to specific interests (e.g., pet gifts, hobby supplies, beauty products), and eco-friendly gift options are gaining significant traction. These innovations leverage technologies like 3D printing and AI-driven personalization, enhancing product appeal and creating unique selling propositions for retailers. Key performance indicators (KPIs) such as customer satisfaction scores, return rates, and average order value are crucial in assessing product success and guiding future product development strategies. Understanding these metrics allows businesses to identify best-selling items, optimize inventory, and personalize marketing efforts for improved conversion rates.
Key Drivers, Barriers & Challenges in Gifts Retailing Market
Key Drivers: Rising disposable incomes, changing consumer preferences favoring personalized and experiential gifts, advancements in e-commerce and digital technologies, and increasing adoption of online gifting platforms are key drivers. Government initiatives promoting local artisans and businesses also stimulate market growth.
Key Challenges & Restraints: Intense competition from both established players and new entrants, economic downturns impacting consumer spending, supply chain disruptions ( xx% increase in shipping costs in 2022), and regulatory changes relating to product safety and e-commerce practices pose challenges.
Emerging Opportunities in Gifts Retailing Market
Untapped markets in developing economies, the growing popularity of subscription-based gifting services, and increasing demand for sustainable and eco-friendly gifts represent significant opportunities. Innovative applications of AR/VR technologies in the gifting experience and personalized gift recommendations powered by AI could further enhance market growth. The focus on personalization will continue to be an important trend.
Growth Accelerators in the Gifts Retailing Market Industry
Technological breakthroughs in personalized gifting, strategic partnerships between retailers and gift creators, and expansion into new international markets are driving long-term growth. The increasing adoption of omnichannel strategies, combining both online and offline retail channels, will further enhance market reach and customer engagement.
Key Players Shaping the Gifts Retailing Market Market
- Card Factory
- Aldi Stores Ltd
- Alibaba Group Holding Ltd
- Amazon com Inc
- American Greetings Corp
- Spencer Gifts LLC
- The Walt Disney Co
- Hallmark Cards Inc
- My Pet Gift Box Ltd
- Shutterfly Inc
- Macys Inc
- List Not Exhaustive
Notable Milestones in Gifts Retailing Market Sector
- May 2023: Card Factory announced ambitious international expansion plans, targeting seven new markets through a strategic partnership with Liwa Trading Enterprises. This signifies a significant investment in global market share and growth.
- April 2023: Hallmark extended its lucrative licensing agreement with Peanuts for another five years, ensuring continued production of popular Peanuts-branded products. This demonstrates the enduring appeal of classic characters and the sustained demand for licensed merchandise within the gifting sector.
- [Add another milestone here with date and brief description. Example: October 2022: Amazon launched a new personalized gift recommendation engine, resulting in a 15% increase in gift sales during the holiday season.]
In-Depth Gifts Retailing Market Market Outlook
The Gifts Retailing Market is poised for continued growth, driven by evolving consumer preferences, technological innovations, and strategic market expansions. The focus on personalization, sustainability, and omnichannel strategies will shape future market dynamics. Strategic partnerships and investments in technology will be crucial for companies seeking to capitalize on the growing market potential. The long-term outlook remains positive, with significant opportunities for both established players and new entrants.
Gifts Retailing Market Segmentation
-
1. Product
- 1.1. Souvenirs and novelty items
- 1.2. Seasonal decorations
- 1.3. Greeting cards
- 1.4. Giftware
- 1.5. Other Gift items
-
2. Distribution channel
- 2.1. Offline
- 2.2. Online
Gifts Retailing Market Segmentation By Geography
-
1. North America
- 1.1. United States
- 1.2. Canada
- 1.3. Rest of North America
-
2. Europe
- 2.1. UK
- 2.2. Germany
- 2.3. France
- 2.4. Italy
- 2.5. Netherlands
- 2.6. Rest of Europe
-
3. Asia Pacific
- 3.1. China
- 3.2. India
- 3.3. Japan
- 3.4. South Korea
- 3.5. Indonesia
- 3.6. Malaysia
- 3.7. Rest of Asia Pacific
- 4. Middle East
-
5. UAE
- 5.1. Saudi Arabia
- 5.2. Israel
- 5.3. South Africa
- 5.4. Rest of Middle East and Africa
-
6. Latin America
- 6.1. Argentina
- 6.2. Brazil
- 6.3. Mexico
- 6.4. Rest of Latin America
Gifts Retailing Market Regional Market Share
Geographic Coverage of Gifts Retailing Market
Gifts Retailing Market REPORT HIGHLIGHTS
| Aspects | Details |
|---|---|
| Study Period | 2020-2034 |
| Base Year | 2025 |
| Estimated Year | 2026 |
| Forecast Period | 2026-2034 |
| Historical Period | 2020-2025 |
| Growth Rate | CAGR of 4.12% from 2020-2034 |
| Segmentation |
|
Table of Contents
- 1. Introduction
- 1.1. Research Scope
- 1.2. Market Segmentation
- 1.3. Research Objective
- 1.4. Definitions and Assumptions
- 2. Executive Summary
- 2.1. Market Snapshot
- 3. Market Dynamics
- 3.1. Market Drivers
- 3.2. Market Restrains
- 3.3. Market Trends
- 3.4. Market Opportunities
- 4. Market Factor Analysis
- 4.1. Porters Five Forces
- 4.1.1. Bargaining Power of Suppliers
- 4.1.2. Bargaining Power of Buyers
- 4.1.3. Threat of New Entrants
- 4.1.4. Threat of Substitutes
- 4.1.5. Competitive Rivalry
- 4.2. PESTEL analysis
- 4.3. BCG Analysis
- 4.3.1. Stars (High Growth, High Market Share)
- 4.3.2. Cash Cows (Low Growth, High Market Share)
- 4.3.3. Question Mark (High Growth, Low Market Share)
- 4.3.4. Dogs (Low Growth, Low Market Share)
- 4.4. Ansoff Matrix Analysis
- 4.5. Supply Chain Analysis
- 4.6. Regulatory Landscape
- 4.7. Current Market Potential and Opportunity Assessment (TAM–SAM–SOM Framework)
- 4.8. VDR Analyst Note
- 4.1. Porters Five Forces
- 5. Market Analysis, Insights and Forecast 2021-2033
- 5.1. Market Analysis, Insights and Forecast - by Product
- 5.1.1. Souvenirs and novelty items
- 5.1.2. Seasonal decorations
- 5.1.3. Greeting cards
- 5.1.4. Giftware
- 5.1.5. Other Gift items
- 5.2. Market Analysis, Insights and Forecast - by Distribution channel
- 5.2.1. Offline
- 5.2.2. Online
- 5.3. Market Analysis, Insights and Forecast - by Region
- 5.3.1. North America
- 5.3.2. Europe
- 5.3.3. Asia Pacific
- 5.3.4. Middle East
- 5.3.5. UAE
- 5.3.6. Latin America
- 5.1. Market Analysis, Insights and Forecast - by Product
- 6. Global Gifts Retailing Market Analysis, Insights and Forecast, 2021-2033
- 6.1. Market Analysis, Insights and Forecast - by Product
- 6.1.1. Souvenirs and novelty items
- 6.1.2. Seasonal decorations
- 6.1.3. Greeting cards
- 6.1.4. Giftware
- 6.1.5. Other Gift items
- 6.2. Market Analysis, Insights and Forecast - by Distribution channel
- 6.2.1. Offline
- 6.2.2. Online
- 6.1. Market Analysis, Insights and Forecast - by Product
- 7. North America Gifts Retailing Market Analysis, Insights and Forecast, 2021-2033
- 7.1. Market Analysis, Insights and Forecast - by Product
- 7.1.1. Souvenirs and novelty items
- 7.1.2. Seasonal decorations
- 7.1.3. Greeting cards
- 7.1.4. Giftware
- 7.1.5. Other Gift items
- 7.2. Market Analysis, Insights and Forecast - by Distribution channel
- 7.2.1. Offline
- 7.2.2. Online
- 7.1. Market Analysis, Insights and Forecast - by Product
- 8. Europe Gifts Retailing Market Analysis, Insights and Forecast, 2021-2033
- 8.1. Market Analysis, Insights and Forecast - by Product
- 8.1.1. Souvenirs and novelty items
- 8.1.2. Seasonal decorations
- 8.1.3. Greeting cards
- 8.1.4. Giftware
- 8.1.5. Other Gift items
- 8.2. Market Analysis, Insights and Forecast - by Distribution channel
- 8.2.1. Offline
- 8.2.2. Online
- 8.1. Market Analysis, Insights and Forecast - by Product
- 9. Asia Pacific Gifts Retailing Market Analysis, Insights and Forecast, 2021-2033
- 9.1. Market Analysis, Insights and Forecast - by Product
- 9.1.1. Souvenirs and novelty items
- 9.1.2. Seasonal decorations
- 9.1.3. Greeting cards
- 9.1.4. Giftware
- 9.1.5. Other Gift items
- 9.2. Market Analysis, Insights and Forecast - by Distribution channel
- 9.2.1. Offline
- 9.2.2. Online
- 9.1. Market Analysis, Insights and Forecast - by Product
- 10. Middle East Gifts Retailing Market Analysis, Insights and Forecast, 2021-2033
- 10.1. Market Analysis, Insights and Forecast - by Product
- 10.1.1. Souvenirs and novelty items
- 10.1.2. Seasonal decorations
- 10.1.3. Greeting cards
- 10.1.4. Giftware
- 10.1.5. Other Gift items
- 10.2. Market Analysis, Insights and Forecast - by Distribution channel
- 10.2.1. Offline
- 10.2.2. Online
- 10.1. Market Analysis, Insights and Forecast - by Product
- 11. UAE Gifts Retailing Market Analysis, Insights and Forecast, 2021-2033
- 11.1. Market Analysis, Insights and Forecast - by Product
- 11.1.1. Souvenirs and novelty items
- 11.1.2. Seasonal decorations
- 11.1.3. Greeting cards
- 11.1.4. Giftware
- 11.1.5. Other Gift items
- 11.2. Market Analysis, Insights and Forecast - by Distribution channel
- 11.2.1. Offline
- 11.2.2. Online
- 11.1. Market Analysis, Insights and Forecast - by Product
- 12. Latin America Gifts Retailing Market Analysis, Insights and Forecast, 2021-2033
- 12.1. Market Analysis, Insights and Forecast - by Product
- 12.1.1. Souvenirs and novelty items
- 12.1.2. Seasonal decorations
- 12.1.3. Greeting cards
- 12.1.4. Giftware
- 12.1.5. Other Gift items
- 12.2. Market Analysis, Insights and Forecast - by Distribution channel
- 12.2.1. Offline
- 12.2.2. Online
- 12.1. Market Analysis, Insights and Forecast - by Product
- 13. Competitive Analysis
- 13.1. Company Profiles
- 13.1.1 Card Factory
- 13.1.1.1. Company Overview
- 13.1.1.2. Products
- 13.1.1.3. Company Financials
- 13.1.1.4. SWOT Analysis
- 13.1.2 Aldi Stores Ltd
- 13.1.2.1. Company Overview
- 13.1.2.2. Products
- 13.1.2.3. Company Financials
- 13.1.2.4. SWOT Analysis
- 13.1.3 Alibaba Group Holding Ltd
- 13.1.3.1. Company Overview
- 13.1.3.2. Products
- 13.1.3.3. Company Financials
- 13.1.3.4. SWOT Analysis
- 13.1.4 Amazon com Inc
- 13.1.4.1. Company Overview
- 13.1.4.2. Products
- 13.1.4.3. Company Financials
- 13.1.4.4. SWOT Analysis
- 13.1.5 American Greetings Corp
- 13.1.5.1. Company Overview
- 13.1.5.2. Products
- 13.1.5.3. Company Financials
- 13.1.5.4. SWOT Analysis
- 13.1.6 Spencer Gifts LLC
- 13.1.6.1. Company Overview
- 13.1.6.2. Products
- 13.1.6.3. Company Financials
- 13.1.6.4. SWOT Analysis
- 13.1.7 The Walt Disney Co
- 13.1.7.1. Company Overview
- 13.1.7.2. Products
- 13.1.7.3. Company Financials
- 13.1.7.4. SWOT Analysis
- 13.1.8 Hallmark Cards Inc
- 13.1.8.1. Company Overview
- 13.1.8.2. Products
- 13.1.8.3. Company Financials
- 13.1.8.4. SWOT Analysis
- 13.1.9 My Pet Gift Box Ltd
- 13.1.9.1. Company Overview
- 13.1.9.2. Products
- 13.1.9.3. Company Financials
- 13.1.9.4. SWOT Analysis
- 13.1.10 Shutterfly Inc
- 13.1.10.1. Company Overview
- 13.1.10.2. Products
- 13.1.10.3. Company Financials
- 13.1.10.4. SWOT Analysis
- 13.1.11 Macys Inc**List Not Exhaustive
- 13.1.11.1. Company Overview
- 13.1.11.2. Products
- 13.1.11.3. Company Financials
- 13.1.11.4. SWOT Analysis
- 13.1.1 Card Factory
- 13.2. Market Entropy
- 13.2.1 Company's Key Areas Served
- 13.2.2 Recent Developments
- 13.3. Company Market Share Analysis 2025
- 13.3.1 Top 5 Companies Market Share Analysis
- 13.3.2 Top 3 Companies Market Share Analysis
- 13.4. List of Potential Customers
- 14. Research Methodology
List of Figures
- Figure 1: Global Gifts Retailing Market Revenue Breakdown (Million, %) by Region 2025 & 2033
- Figure 2: Global Gifts Retailing Market Volume Breakdown (Billion, %) by Region 2025 & 2033
- Figure 3: North America Gifts Retailing Market Revenue (Million), by Product 2025 & 2033
- Figure 4: North America Gifts Retailing Market Volume (Billion), by Product 2025 & 2033
- Figure 5: North America Gifts Retailing Market Revenue Share (%), by Product 2025 & 2033
- Figure 6: North America Gifts Retailing Market Volume Share (%), by Product 2025 & 2033
- Figure 7: North America Gifts Retailing Market Revenue (Million), by Distribution channel 2025 & 2033
- Figure 8: North America Gifts Retailing Market Volume (Billion), by Distribution channel 2025 & 2033
- Figure 9: North America Gifts Retailing Market Revenue Share (%), by Distribution channel 2025 & 2033
- Figure 10: North America Gifts Retailing Market Volume Share (%), by Distribution channel 2025 & 2033
- Figure 11: North America Gifts Retailing Market Revenue (Million), by Country 2025 & 2033
- Figure 12: North America Gifts Retailing Market Volume (Billion), by Country 2025 & 2033
- Figure 13: North America Gifts Retailing Market Revenue Share (%), by Country 2025 & 2033
- Figure 14: North America Gifts Retailing Market Volume Share (%), by Country 2025 & 2033
- Figure 15: Europe Gifts Retailing Market Revenue (Million), by Product 2025 & 2033
- Figure 16: Europe Gifts Retailing Market Volume (Billion), by Product 2025 & 2033
- Figure 17: Europe Gifts Retailing Market Revenue Share (%), by Product 2025 & 2033
- Figure 18: Europe Gifts Retailing Market Volume Share (%), by Product 2025 & 2033
- Figure 19: Europe Gifts Retailing Market Revenue (Million), by Distribution channel 2025 & 2033
- Figure 20: Europe Gifts Retailing Market Volume (Billion), by Distribution channel 2025 & 2033
- Figure 21: Europe Gifts Retailing Market Revenue Share (%), by Distribution channel 2025 & 2033
- Figure 22: Europe Gifts Retailing Market Volume Share (%), by Distribution channel 2025 & 2033
- Figure 23: Europe Gifts Retailing Market Revenue (Million), by Country 2025 & 2033
- Figure 24: Europe Gifts Retailing Market Volume (Billion), by Country 2025 & 2033
- Figure 25: Europe Gifts Retailing Market Revenue Share (%), by Country 2025 & 2033
- Figure 26: Europe Gifts Retailing Market Volume Share (%), by Country 2025 & 2033
- Figure 27: Asia Pacific Gifts Retailing Market Revenue (Million), by Product 2025 & 2033
- Figure 28: Asia Pacific Gifts Retailing Market Volume (Billion), by Product 2025 & 2033
- Figure 29: Asia Pacific Gifts Retailing Market Revenue Share (%), by Product 2025 & 2033
- Figure 30: Asia Pacific Gifts Retailing Market Volume Share (%), by Product 2025 & 2033
- Figure 31: Asia Pacific Gifts Retailing Market Revenue (Million), by Distribution channel 2025 & 2033
- Figure 32: Asia Pacific Gifts Retailing Market Volume (Billion), by Distribution channel 2025 & 2033
- Figure 33: Asia Pacific Gifts Retailing Market Revenue Share (%), by Distribution channel 2025 & 2033
- Figure 34: Asia Pacific Gifts Retailing Market Volume Share (%), by Distribution channel 2025 & 2033
- Figure 35: Asia Pacific Gifts Retailing Market Revenue (Million), by Country 2025 & 2033
- Figure 36: Asia Pacific Gifts Retailing Market Volume (Billion), by Country 2025 & 2033
- Figure 37: Asia Pacific Gifts Retailing Market Revenue Share (%), by Country 2025 & 2033
- Figure 38: Asia Pacific Gifts Retailing Market Volume Share (%), by Country 2025 & 2033
- Figure 39: Middle East Gifts Retailing Market Revenue (Million), by Product 2025 & 2033
- Figure 40: Middle East Gifts Retailing Market Volume (Billion), by Product 2025 & 2033
- Figure 41: Middle East Gifts Retailing Market Revenue Share (%), by Product 2025 & 2033
- Figure 42: Middle East Gifts Retailing Market Volume Share (%), by Product 2025 & 2033
- Figure 43: Middle East Gifts Retailing Market Revenue (Million), by Distribution channel 2025 & 2033
- Figure 44: Middle East Gifts Retailing Market Volume (Billion), by Distribution channel 2025 & 2033
- Figure 45: Middle East Gifts Retailing Market Revenue Share (%), by Distribution channel 2025 & 2033
- Figure 46: Middle East Gifts Retailing Market Volume Share (%), by Distribution channel 2025 & 2033
- Figure 47: Middle East Gifts Retailing Market Revenue (Million), by Country 2025 & 2033
- Figure 48: Middle East Gifts Retailing Market Volume (Billion), by Country 2025 & 2033
- Figure 49: Middle East Gifts Retailing Market Revenue Share (%), by Country 2025 & 2033
- Figure 50: Middle East Gifts Retailing Market Volume Share (%), by Country 2025 & 2033
- Figure 51: UAE Gifts Retailing Market Revenue (Million), by Product 2025 & 2033
- Figure 52: UAE Gifts Retailing Market Volume (Billion), by Product 2025 & 2033
- Figure 53: UAE Gifts Retailing Market Revenue Share (%), by Product 2025 & 2033
- Figure 54: UAE Gifts Retailing Market Volume Share (%), by Product 2025 & 2033
- Figure 55: UAE Gifts Retailing Market Revenue (Million), by Distribution channel 2025 & 2033
- Figure 56: UAE Gifts Retailing Market Volume (Billion), by Distribution channel 2025 & 2033
- Figure 57: UAE Gifts Retailing Market Revenue Share (%), by Distribution channel 2025 & 2033
- Figure 58: UAE Gifts Retailing Market Volume Share (%), by Distribution channel 2025 & 2033
- Figure 59: UAE Gifts Retailing Market Revenue (Million), by Country 2025 & 2033
- Figure 60: UAE Gifts Retailing Market Volume (Billion), by Country 2025 & 2033
- Figure 61: UAE Gifts Retailing Market Revenue Share (%), by Country 2025 & 2033
- Figure 62: UAE Gifts Retailing Market Volume Share (%), by Country 2025 & 2033
- Figure 63: Latin America Gifts Retailing Market Revenue (Million), by Product 2025 & 2033
- Figure 64: Latin America Gifts Retailing Market Volume (Billion), by Product 2025 & 2033
- Figure 65: Latin America Gifts Retailing Market Revenue Share (%), by Product 2025 & 2033
- Figure 66: Latin America Gifts Retailing Market Volume Share (%), by Product 2025 & 2033
- Figure 67: Latin America Gifts Retailing Market Revenue (Million), by Distribution channel 2025 & 2033
- Figure 68: Latin America Gifts Retailing Market Volume (Billion), by Distribution channel 2025 & 2033
- Figure 69: Latin America Gifts Retailing Market Revenue Share (%), by Distribution channel 2025 & 2033
- Figure 70: Latin America Gifts Retailing Market Volume Share (%), by Distribution channel 2025 & 2033
- Figure 71: Latin America Gifts Retailing Market Revenue (Million), by Country 2025 & 2033
- Figure 72: Latin America Gifts Retailing Market Volume (Billion), by Country 2025 & 2033
- Figure 73: Latin America Gifts Retailing Market Revenue Share (%), by Country 2025 & 2033
- Figure 74: Latin America Gifts Retailing Market Volume Share (%), by Country 2025 & 2033
List of Tables
- Table 1: Global Gifts Retailing Market Revenue Million Forecast, by Product 2020 & 2033
- Table 2: Global Gifts Retailing Market Volume Billion Forecast, by Product 2020 & 2033
- Table 3: Global Gifts Retailing Market Revenue Million Forecast, by Distribution channel 2020 & 2033
- Table 4: Global Gifts Retailing Market Volume Billion Forecast, by Distribution channel 2020 & 2033
- Table 5: Global Gifts Retailing Market Revenue Million Forecast, by Region 2020 & 2033
- Table 6: Global Gifts Retailing Market Volume Billion Forecast, by Region 2020 & 2033
- Table 7: Global Gifts Retailing Market Revenue Million Forecast, by Product 2020 & 2033
- Table 8: Global Gifts Retailing Market Volume Billion Forecast, by Product 2020 & 2033
- Table 9: Global Gifts Retailing Market Revenue Million Forecast, by Distribution channel 2020 & 2033
- Table 10: Global Gifts Retailing Market Volume Billion Forecast, by Distribution channel 2020 & 2033
- Table 11: Global Gifts Retailing Market Revenue Million Forecast, by Country 2020 & 2033
- Table 12: Global Gifts Retailing Market Volume Billion Forecast, by Country 2020 & 2033
- Table 13: United States Gifts Retailing Market Revenue (Million) Forecast, by Application 2020 & 2033
- Table 14: United States Gifts Retailing Market Volume (Billion) Forecast, by Application 2020 & 2033
- Table 15: Canada Gifts Retailing Market Revenue (Million) Forecast, by Application 2020 & 2033
- Table 16: Canada Gifts Retailing Market Volume (Billion) Forecast, by Application 2020 & 2033
- Table 17: Rest of North America Gifts Retailing Market Revenue (Million) Forecast, by Application 2020 & 2033
- Table 18: Rest of North America Gifts Retailing Market Volume (Billion) Forecast, by Application 2020 & 2033
- Table 19: Global Gifts Retailing Market Revenue Million Forecast, by Product 2020 & 2033
- Table 20: Global Gifts Retailing Market Volume Billion Forecast, by Product 2020 & 2033
- Table 21: Global Gifts Retailing Market Revenue Million Forecast, by Distribution channel 2020 & 2033
- Table 22: Global Gifts Retailing Market Volume Billion Forecast, by Distribution channel 2020 & 2033
- Table 23: Global Gifts Retailing Market Revenue Million Forecast, by Country 2020 & 2033
- Table 24: Global Gifts Retailing Market Volume Billion Forecast, by Country 2020 & 2033
- Table 25: UK Gifts Retailing Market Revenue (Million) Forecast, by Application 2020 & 2033
- Table 26: UK Gifts Retailing Market Volume (Billion) Forecast, by Application 2020 & 2033
- Table 27: Germany Gifts Retailing Market Revenue (Million) Forecast, by Application 2020 & 2033
- Table 28: Germany Gifts Retailing Market Volume (Billion) Forecast, by Application 2020 & 2033
- Table 29: France Gifts Retailing Market Revenue (Million) Forecast, by Application 2020 & 2033
- Table 30: France Gifts Retailing Market Volume (Billion) Forecast, by Application 2020 & 2033
- Table 31: Italy Gifts Retailing Market Revenue (Million) Forecast, by Application 2020 & 2033
- Table 32: Italy Gifts Retailing Market Volume (Billion) Forecast, by Application 2020 & 2033
- Table 33: Netherlands Gifts Retailing Market Revenue (Million) Forecast, by Application 2020 & 2033
- Table 34: Netherlands Gifts Retailing Market Volume (Billion) Forecast, by Application 2020 & 2033
- Table 35: Rest of Europe Gifts Retailing Market Revenue (Million) Forecast, by Application 2020 & 2033
- Table 36: Rest of Europe Gifts Retailing Market Volume (Billion) Forecast, by Application 2020 & 2033
- Table 37: Global Gifts Retailing Market Revenue Million Forecast, by Product 2020 & 2033
- Table 38: Global Gifts Retailing Market Volume Billion Forecast, by Product 2020 & 2033
- Table 39: Global Gifts Retailing Market Revenue Million Forecast, by Distribution channel 2020 & 2033
- Table 40: Global Gifts Retailing Market Volume Billion Forecast, by Distribution channel 2020 & 2033
- Table 41: Global Gifts Retailing Market Revenue Million Forecast, by Country 2020 & 2033
- Table 42: Global Gifts Retailing Market Volume Billion Forecast, by Country 2020 & 2033
- Table 43: China Gifts Retailing Market Revenue (Million) Forecast, by Application 2020 & 2033
- Table 44: China Gifts Retailing Market Volume (Billion) Forecast, by Application 2020 & 2033
- Table 45: India Gifts Retailing Market Revenue (Million) Forecast, by Application 2020 & 2033
- Table 46: India Gifts Retailing Market Volume (Billion) Forecast, by Application 2020 & 2033
- Table 47: Japan Gifts Retailing Market Revenue (Million) Forecast, by Application 2020 & 2033
- Table 48: Japan Gifts Retailing Market Volume (Billion) Forecast, by Application 2020 & 2033
- Table 49: South Korea Gifts Retailing Market Revenue (Million) Forecast, by Application 2020 & 2033
- Table 50: South Korea Gifts Retailing Market Volume (Billion) Forecast, by Application 2020 & 2033
- Table 51: Indonesia Gifts Retailing Market Revenue (Million) Forecast, by Application 2020 & 2033
- Table 52: Indonesia Gifts Retailing Market Volume (Billion) Forecast, by Application 2020 & 2033
- Table 53: Malaysia Gifts Retailing Market Revenue (Million) Forecast, by Application 2020 & 2033
- Table 54: Malaysia Gifts Retailing Market Volume (Billion) Forecast, by Application 2020 & 2033
- Table 55: Rest of Asia Pacific Gifts Retailing Market Revenue (Million) Forecast, by Application 2020 & 2033
- Table 56: Rest of Asia Pacific Gifts Retailing Market Volume (Billion) Forecast, by Application 2020 & 2033
- Table 57: Global Gifts Retailing Market Revenue Million Forecast, by Product 2020 & 2033
- Table 58: Global Gifts Retailing Market Volume Billion Forecast, by Product 2020 & 2033
- Table 59: Global Gifts Retailing Market Revenue Million Forecast, by Distribution channel 2020 & 2033
- Table 60: Global Gifts Retailing Market Volume Billion Forecast, by Distribution channel 2020 & 2033
- Table 61: Global Gifts Retailing Market Revenue Million Forecast, by Country 2020 & 2033
- Table 62: Global Gifts Retailing Market Volume Billion Forecast, by Country 2020 & 2033
- Table 63: Global Gifts Retailing Market Revenue Million Forecast, by Product 2020 & 2033
- Table 64: Global Gifts Retailing Market Volume Billion Forecast, by Product 2020 & 2033
- Table 65: Global Gifts Retailing Market Revenue Million Forecast, by Distribution channel 2020 & 2033
- Table 66: Global Gifts Retailing Market Volume Billion Forecast, by Distribution channel 2020 & 2033
- Table 67: Global Gifts Retailing Market Revenue Million Forecast, by Country 2020 & 2033
- Table 68: Global Gifts Retailing Market Volume Billion Forecast, by Country 2020 & 2033
- Table 69: Saudi Arabia Gifts Retailing Market Revenue (Million) Forecast, by Application 2020 & 2033
- Table 70: Saudi Arabia Gifts Retailing Market Volume (Billion) Forecast, by Application 2020 & 2033
- Table 71: Israel Gifts Retailing Market Revenue (Million) Forecast, by Application 2020 & 2033
- Table 72: Israel Gifts Retailing Market Volume (Billion) Forecast, by Application 2020 & 2033
- Table 73: South Africa Gifts Retailing Market Revenue (Million) Forecast, by Application 2020 & 2033
- Table 74: South Africa Gifts Retailing Market Volume (Billion) Forecast, by Application 2020 & 2033
- Table 75: Rest of Middle East and Africa Gifts Retailing Market Revenue (Million) Forecast, by Application 2020 & 2033
- Table 76: Rest of Middle East and Africa Gifts Retailing Market Volume (Billion) Forecast, by Application 2020 & 2033
- Table 77: Global Gifts Retailing Market Revenue Million Forecast, by Product 2020 & 2033
- Table 78: Global Gifts Retailing Market Volume Billion Forecast, by Product 2020 & 2033
- Table 79: Global Gifts Retailing Market Revenue Million Forecast, by Distribution channel 2020 & 2033
- Table 80: Global Gifts Retailing Market Volume Billion Forecast, by Distribution channel 2020 & 2033
- Table 81: Global Gifts Retailing Market Revenue Million Forecast, by Country 2020 & 2033
- Table 82: Global Gifts Retailing Market Volume Billion Forecast, by Country 2020 & 2033
- Table 83: Argentina Gifts Retailing Market Revenue (Million) Forecast, by Application 2020 & 2033
- Table 84: Argentina Gifts Retailing Market Volume (Billion) Forecast, by Application 2020 & 2033
- Table 85: Brazil Gifts Retailing Market Revenue (Million) Forecast, by Application 2020 & 2033
- Table 86: Brazil Gifts Retailing Market Volume (Billion) Forecast, by Application 2020 & 2033
- Table 87: Mexico Gifts Retailing Market Revenue (Million) Forecast, by Application 2020 & 2033
- Table 88: Mexico Gifts Retailing Market Volume (Billion) Forecast, by Application 2020 & 2033
- Table 89: Rest of Latin America Gifts Retailing Market Revenue (Million) Forecast, by Application 2020 & 2033
- Table 90: Rest of Latin America Gifts Retailing Market Volume (Billion) Forecast, by Application 2020 & 2033
Frequently Asked Questions
1. What is the projected Compound Annual Growth Rate (CAGR) of the Gifts Retailing Market?
The projected CAGR is approximately 4.12%.
2. Which companies are prominent players in the Gifts Retailing Market?
Key companies in the market include Card Factory, Aldi Stores Ltd, Alibaba Group Holding Ltd, Amazon com Inc, American Greetings Corp, Spencer Gifts LLC, The Walt Disney Co, Hallmark Cards Inc, My Pet Gift Box Ltd, Shutterfly Inc, Macys Inc**List Not Exhaustive.
3. What are the main segments of the Gifts Retailing Market?
The market segments include Product, Distribution channel.
4. Can you provide details about the market size?
The market size is estimated to be USD 14 Million as of 2022.
5. What are some drivers contributing to market growth?
Seasonal Occasions and Celebrations; E-commerce and Online Shopping.
6. What are the notable trends driving market growth?
Impact of Valentine's Day Gifts Purchasing in Gift Retailing Market.
7. Are there any restraints impacting market growth?
Seasonal Occasions and Celebrations; E-commerce and Online Shopping.
8. Can you provide examples of recent developments in the market?
May 2023: Card Factory is looking to expand in seven international markets. It has announced its partnership with Middle East-based Liwa Trading Enterprises, which will act as its exclusive franchise partner in the region.
9. What pricing options are available for accessing the report?
Pricing options include single-user, multi-user, and enterprise licenses priced at USD 4750, USD 5250, and USD 8750 respectively.
10. Is the market size provided in terms of value or volume?
The market size is provided in terms of value, measured in Million and volume, measured in Billion.
11. Are there any specific market keywords associated with the report?
Yes, the market keyword associated with the report is " Gifts Retailing Market," which aids in identifying and referencing the specific market segment covered.
12. How do I determine which pricing option suits my needs best?
The pricing options vary based on user requirements and access needs. Individual users may opt for single-user licenses, while businesses requiring broader access may choose multi-user or enterprise licenses for cost-effective access to the report.
13. Are there any additional resources or data provided in the Gifts Retailing Market report?
While the report offers comprehensive insights, it's advisable to review the specific contents or supplementary materials provided to ascertain if additional resources or data are available.
14. How can I stay updated on further developments or reports in the Gifts Retailing Market?
To stay informed about further developments, trends, and reports in the Gifts Retailing Market, consider subscribing to industry newsletters, following relevant companies and organizations, or regularly checking reputable industry news sources and publications.
Methodology
Step 1 - Identification of Relevant Samples Size from Population Database


Step 2 - Approaches for Defining Global Market Size (Value, Volume* & Price*)

Note*: In applicable scenarios
Step 3 - Data Sources
Primary Research
- Web Analytics
- Survey Reports
- Research Institute
- Latest Research Reports
- Opinion Leaders
Secondary Research
- Annual Reports
- White Paper
- Latest Press Release
- Industry Association
- Paid Database
- Investor Presentations

Step 4 - Data Triangulation
Involves using different sources of information in order to increase the validity of a study
These sources are likely to be stakeholders in a program - participants, other researchers, program staff, other community members, and so on.
Then we put all data in single framework & apply various statistical tools to find out the dynamic on the market.
During the analysis stage, feedback from the stakeholder groups would be compared to determine areas of agreement as well as areas of divergence