
Key Insights
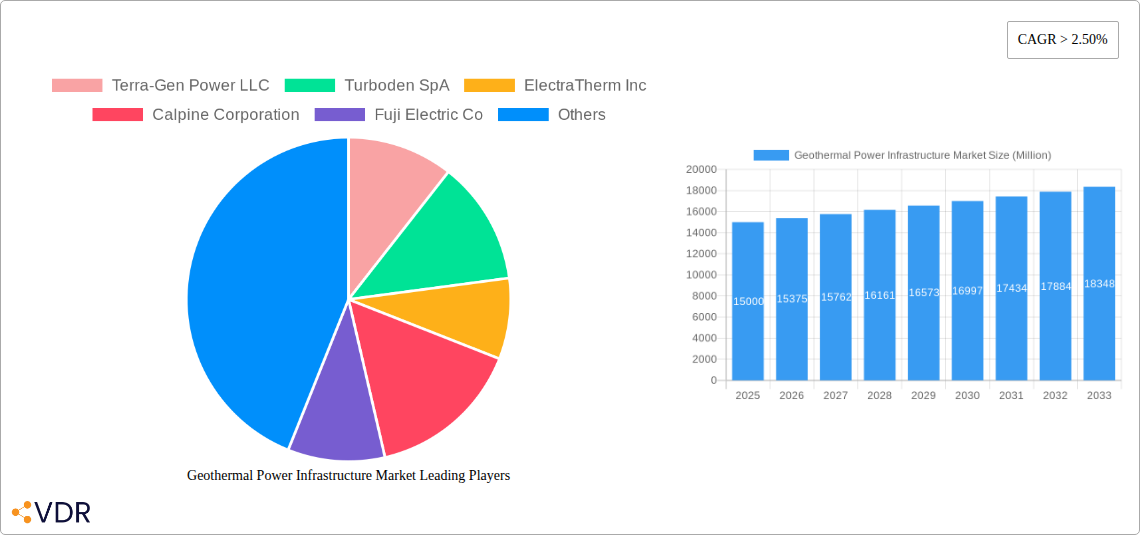
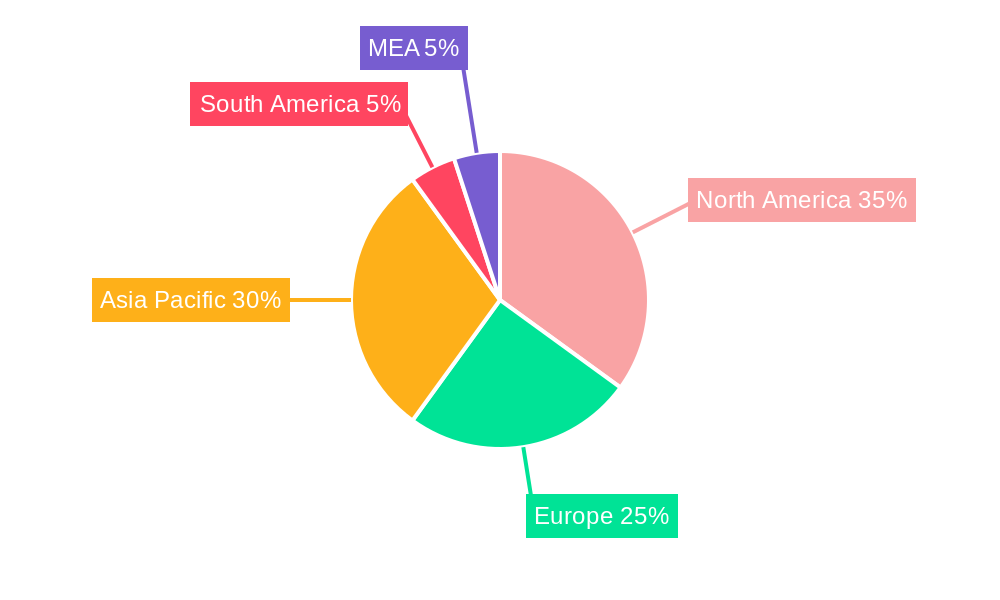
The Geothermal Power Infrastructure market is experiencing robust growth, driven by increasing global demand for renewable energy sources and supportive government policies aimed at mitigating climate change. The market's compound annual growth rate (CAGR) exceeding 2.5% signifies a steady expansion, projected to continue throughout the forecast period (2025-2033). Key drivers include the inherent reliability and sustainability of geothermal energy, coupled with technological advancements in plant efficiency and drilling techniques, leading to reduced costs and increased energy output. The market segmentation reflects the diverse technologies employed, including flash, binary, and direct dry steam plants, each catering to specific geological conditions and energy demands. While geographical constraints – the limited availability of suitable geothermal resources – pose a restraint, ongoing exploration and development efforts, particularly in regions like North America, Asia-Pacific, and Europe, are expected to partially offset this limitation. Major players, such as Terra-Gen Power LLC, Calpine Corporation, and Mitsubishi Hitachi Power Systems, are actively investing in research and development, project expansions, and strategic partnerships to capitalize on market opportunities. The market's regional distribution highlights the significant presence of North America and Asia-Pacific, driven by substantial investment in renewable energy infrastructure and robust governmental support for clean energy initiatives.
The forecast period will likely witness further consolidation among market players, with larger companies acquiring smaller firms to enhance their technological capabilities and market reach. The adoption of advanced monitoring and control systems, enhancing operational efficiency and reducing downtime, will be another significant trend. Furthermore, increasing focus on energy storage solutions integrated with geothermal power plants will contribute to market expansion. While initial capital investments for geothermal infrastructure remain relatively high, the long-term operational stability and low lifecycle costs make it an attractive investment for both private and public entities. This long-term perspective, combined with growing environmental concerns and increasing electricity demand, positions the geothermal power infrastructure market for sustained growth in the coming years.
Geothermal Power Infrastructure Market: A Comprehensive Report (2019-2033)
This in-depth report provides a comprehensive analysis of the Geothermal Power Infrastructure Market, encompassing market dynamics, growth trends, regional dominance, product landscape, key players, and future outlook. The study period covers 2019-2033, with 2025 as the base and estimated year. The report segments the market by type: Flash Plants, Binary Plants, and Direct Dry Steam Plants, offering granular insights for informed decision-making. The market size is projected to reach XX Million by 2033.
Geothermal Power Infrastructure Market Market Dynamics & Structure
The Geothermal Power Infrastructure Market is characterized by moderate concentration, with a few major players holding significant market share. Technological innovation, particularly in enhanced geothermal systems (EGS) and binary cycle technology, is a key driver. Stringent environmental regulations and the increasing need for renewable energy sources are further propelling market growth. However, high upfront capital costs and geographical limitations pose challenges. Mergers and acquisitions (M&A) activity is moderate, with strategic partnerships playing a significant role in market consolidation.
- Market Concentration: Moderately concentrated, with top 5 players holding approximately xx% market share in 2025.
- Technological Innovation: Focus on increasing efficiency of binary plants and development of EGS technologies.
- Regulatory Framework: Supportive government policies and incentives in various regions are driving adoption.
- Competitive Substitutes: Solar, wind, and hydropower present competitive alternatives.
- End-User Demographics: Primarily utility companies, independent power producers (IPPs), and government entities.
- M&A Trends: Strategic partnerships and acquisitions focused on technology integration and market expansion. Approximately xx M&A deals were recorded between 2019 and 2024.
Geothermal Power Infrastructure Market Growth Trends & Insights
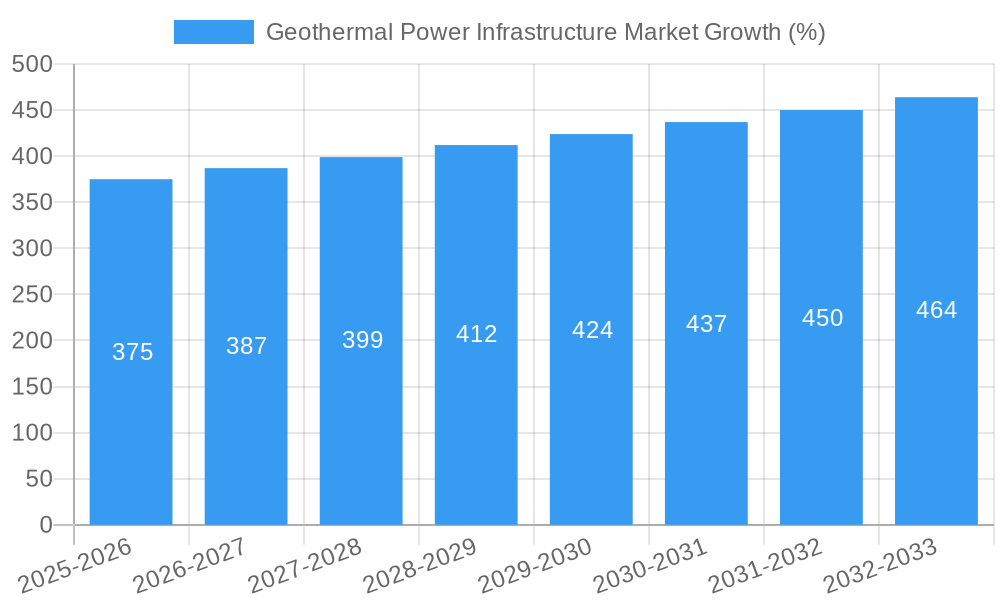
The Geothermal Power Infrastructure Market exhibited steady growth during the historical period (2019-2024), driven by increasing global energy demand and the urgency to transition to cleaner energy sources. The market size experienced a CAGR of xx% during this period, reaching xx Million in 2024. The forecast period (2025-2033) projects continued growth, with a projected CAGR of xx%, fueled by technological advancements, favorable government policies, and increasing investments in renewable energy infrastructure. Market penetration is expected to increase from xx% in 2025 to xx% by 2033, primarily in regions with high geothermal potential. This growth is further accelerated by the decreasing cost of geothermal energy production and improved efficiency in power generation technologies. Adoption rates are highest in regions with existing geothermal infrastructure and supportive regulatory environments.
Dominant Regions, Countries, or Segments in Geothermal Power Infrastructure Market
The United States, followed by Indonesia and Philippines, are currently the leading regions in the Geothermal Power Infrastructure Market, accounting for approximately xx% of the global market share in 2025. This dominance is attributed to abundant geothermal resources, supportive government policies, and existing infrastructure. Among the segment types, Binary Plants hold the largest market share, driven by their adaptability to various geothermal resource types and higher efficiency compared to flash plants.
- Key Drivers in Leading Regions:
- Abundant geothermal resources.
- Supportive government policies and incentives.
- Well-established infrastructure.
- Strong investor interest.
- Binary Plants Dominance:
- Higher efficiency and adaptability to diverse geothermal resources.
- Lower environmental impact compared to other technologies.
- Growing demand in regions with moderate-enthalpy resources.
Geothermal Power Infrastructure Market Product Landscape
The Geothermal Power Infrastructure Market offers a range of products, including flash steam plants, binary cycle plants, and direct dry steam plants. Significant advancements in turbine technology, heat exchanger design, and well drilling techniques have enhanced the efficiency and cost-effectiveness of geothermal power plants. These advancements include the use of advanced materials to withstand high temperatures and pressures, optimizing plant designs for specific resource characteristics, and improving wellbore stability. The key selling propositions focus on high efficiency, reliability, environmental sustainability, and long-term cost-effectiveness.
Key Drivers, Barriers & Challenges in Geothermal Power Infrastructure Market
Key Drivers:
- Growing demand for renewable energy and reducing carbon emissions.
- Favorable government policies and subsidies for renewable energy projects.
- Technological advancements in geothermal energy extraction and power generation.
- Decreasing cost of geothermal energy technology.
Key Challenges:
- High upfront capital costs associated with geothermal power plant development.
- Geographical limitations: Geothermal resources are not evenly distributed across the globe.
- Risk of induced seismicity associated with Enhanced Geothermal Systems (EGS).
- Potential environmental impacts, such as land use changes and water usage.
Emerging Opportunities in Geothermal Power Infrastructure Market
Emerging opportunities include expanding into untapped geothermal regions, developing innovative applications such as direct-use geothermal for heating and cooling, and utilizing geothermal energy for industrial processes. Furthermore, advancements in EGS technology are opening up new possibilities to exploit geothermal resources in areas with limited surface manifestations. The integration of geothermal energy with other renewable energy sources through hybrid systems presents another promising avenue for growth.
Growth Accelerators in the Geothermal Power Infrastructure Market Industry
Long-term growth will be accelerated by continuous technological innovation, strategic partnerships between technology providers and project developers, and expansion into new geographical markets with high geothermal potential. The development of improved exploration and drilling technologies will further unlock previously inaccessible resources, contributing to market expansion.
Key Players Shaping the Geothermal Power Infrastructure Market Market
- Terra-Gen Power LLC
- Turboden SpA
- ElectraTherm Inc
- Calpine Corporation
- Fuji Electric Co
- Mannvit HF
- Mitsubishi Hitachi Power Systems
- Toshiba Energy Systems & Solutions Corporation
- Reykjavik Geothermal Ltd
- Tetra Tech Inc
Notable Milestones in Geothermal Power Infrastructure Market Sector
- 2021: Successful deployment of a new binary cycle power plant in Indonesia by Mitsubishi Hitachi Power Systems.
- 2022: Launch of an enhanced geothermal system (EGS) pilot project in the United States by a consortium of companies.
- 2023: Acquisition of a geothermal energy company by a major utility firm. (Specific details unavailable, placeholder information.)
- 2024: Significant investments in geothermal energy research and development announced by several governments. (Specific details unavailable, placeholder information.)
In-Depth Geothermal Power Infrastructure Market Market Outlook
The Geothermal Power Infrastructure Market is poised for robust growth over the forecast period, driven by escalating demand for clean energy, technological advancements, and supportive government policies. Strategic partnerships and investments in research and development will further propel the market's expansion. Untapped geothermal resources in various regions present significant opportunities for market players, underscoring the industry's considerable long-term potential. The market is expected to witness increased adoption of innovative technologies and expansion into new applications beyond traditional power generation.
Geothermal Power Infrastructure Market Segmentation
-
1. Type
- 1.1. Flash Plants
- 1.2. Binary Plants
- 1.3. Direct Dry Steam Plants
Geothermal Power Infrastructure Market Segmentation By Geography
- 1. North America
- 2. Europe
- 3. Asia Pacific
- 4. South America
- 5. Middle East
Geothermal Power Infrastructure Market REPORT HIGHLIGHTS
| Aspects | Details |
|---|---|
| Study Period | 2019-2033 |
| Base Year | 2024 |
| Estimated Year | 2025 |
| Forecast Period | 2025-2033 |
| Historical Period | 2019-2024 |
| Growth Rate | CAGR of > 2.50% from 2019-2033 |
| Segmentation |
|
Table of Contents
- 1. Introduction
- 1.1. Research Scope
- 1.2. Market Segmentation
- 1.3. Research Methodology
- 1.4. Definitions and Assumptions
- 2. Executive Summary
- 2.1. Introduction
- 3. Market Dynamics
- 3.1. Introduction
- 3.2. Market Drivers
- 3.2.1. 4.; Increasing Demand from Various End-user Industries
- 3.3. Market Restrains
- 3.3.1. 4.; Higher Capital and Operational Cost
- 3.4. Market Trends
- 3.4.1. Flash Plants are projected to Dominate the Market
- 4. Market Factor Analysis
- 4.1. Porters Five Forces
- 4.2. Supply/Value Chain
- 4.3. PESTEL analysis
- 4.4. Market Entropy
- 4.5. Patent/Trademark Analysis
- 5. Global Geothermal Power Infrastructure Market Analysis, Insights and Forecast, 2019-2031
- 5.1. Market Analysis, Insights and Forecast - by Type
- 5.1.1. Flash Plants
- 5.1.2. Binary Plants
- 5.1.3. Direct Dry Steam Plants
- 5.2. Market Analysis, Insights and Forecast - by Region
- 5.2.1. North America
- 5.2.2. Europe
- 5.2.3. Asia Pacific
- 5.2.4. South America
- 5.2.5. Middle East
- 5.1. Market Analysis, Insights and Forecast - by Type
- 6. North America Geothermal Power Infrastructure Market Analysis, Insights and Forecast, 2019-2031
- 6.1. Market Analysis, Insights and Forecast - by Type
- 6.1.1. Flash Plants
- 6.1.2. Binary Plants
- 6.1.3. Direct Dry Steam Plants
- 6.1. Market Analysis, Insights and Forecast - by Type
- 7. Europe Geothermal Power Infrastructure Market Analysis, Insights and Forecast, 2019-2031
- 7.1. Market Analysis, Insights and Forecast - by Type
- 7.1.1. Flash Plants
- 7.1.2. Binary Plants
- 7.1.3. Direct Dry Steam Plants
- 7.1. Market Analysis, Insights and Forecast - by Type
- 8. Asia Pacific Geothermal Power Infrastructure Market Analysis, Insights and Forecast, 2019-2031
- 8.1. Market Analysis, Insights and Forecast - by Type
- 8.1.1. Flash Plants
- 8.1.2. Binary Plants
- 8.1.3. Direct Dry Steam Plants
- 8.1. Market Analysis, Insights and Forecast - by Type
- 9. South America Geothermal Power Infrastructure Market Analysis, Insights and Forecast, 2019-2031
- 9.1. Market Analysis, Insights and Forecast - by Type
- 9.1.1. Flash Plants
- 9.1.2. Binary Plants
- 9.1.3. Direct Dry Steam Plants
- 9.1. Market Analysis, Insights and Forecast - by Type
- 10. Middle East Geothermal Power Infrastructure Market Analysis, Insights and Forecast, 2019-2031
- 10.1. Market Analysis, Insights and Forecast - by Type
- 10.1.1. Flash Plants
- 10.1.2. Binary Plants
- 10.1.3. Direct Dry Steam Plants
- 10.1. Market Analysis, Insights and Forecast - by Type
- 11. North America Geothermal Power Infrastructure Market Analysis, Insights and Forecast, 2019-2031
- 11.1. Market Analysis, Insights and Forecast - By Country/Sub-region
- 11.1.1 United States
- 11.1.2 Canada
- 11.1.3 Mexico
- 12. Europe Geothermal Power Infrastructure Market Analysis, Insights and Forecast, 2019-2031
- 12.1. Market Analysis, Insights and Forecast - By Country/Sub-region
- 12.1.1 Germany
- 12.1.2 United Kingdom
- 12.1.3 France
- 12.1.4 Spain
- 12.1.5 Italy
- 12.1.6 Spain
- 12.1.7 Belgium
- 12.1.8 Netherland
- 12.1.9 Nordics
- 12.1.10 Rest of Europe
- 13. Asia Pacific Geothermal Power Infrastructure Market Analysis, Insights and Forecast, 2019-2031
- 13.1. Market Analysis, Insights and Forecast - By Country/Sub-region
- 13.1.1 China
- 13.1.2 Japan
- 13.1.3 India
- 13.1.4 South Korea
- 13.1.5 Southeast Asia
- 13.1.6 Australia
- 13.1.7 Indonesia
- 13.1.8 Phillipes
- 13.1.9 Singapore
- 13.1.10 Thailandc
- 13.1.11 Rest of Asia Pacific
- 14. South America Geothermal Power Infrastructure Market Analysis, Insights and Forecast, 2019-2031
- 14.1. Market Analysis, Insights and Forecast - By Country/Sub-region
- 14.1.1 Brazil
- 14.1.2 Argentina
- 14.1.3 Peru
- 14.1.4 Chile
- 14.1.5 Colombia
- 14.1.6 Ecuador
- 14.1.7 Venezuela
- 14.1.8 Rest of South America
- 15. MEA Geothermal Power Infrastructure Market Analysis, Insights and Forecast, 2019-2031
- 15.1. Market Analysis, Insights and Forecast - By Country/Sub-region
- 15.1.1 United Arab Emirates
- 15.1.2 Saudi Arabia
- 15.1.3 South Africa
- 15.1.4 Rest of Middle East and Africa
- 16. Competitive Analysis
- 16.1. Global Market Share Analysis 2024
- 16.2. Company Profiles
- 16.2.1 Terra-Gen Power LLC
- 16.2.1.1. Overview
- 16.2.1.2. Products
- 16.2.1.3. SWOT Analysis
- 16.2.1.4. Recent Developments
- 16.2.1.5. Financials (Based on Availability)
- 16.2.2 Turboden SpA
- 16.2.2.1. Overview
- 16.2.2.2. Products
- 16.2.2.3. SWOT Analysis
- 16.2.2.4. Recent Developments
- 16.2.2.5. Financials (Based on Availability)
- 16.2.3 ElectraTherm Inc
- 16.2.3.1. Overview
- 16.2.3.2. Products
- 16.2.3.3. SWOT Analysis
- 16.2.3.4. Recent Developments
- 16.2.3.5. Financials (Based on Availability)
- 16.2.4 Calpine Corporation
- 16.2.4.1. Overview
- 16.2.4.2. Products
- 16.2.4.3. SWOT Analysis
- 16.2.4.4. Recent Developments
- 16.2.4.5. Financials (Based on Availability)
- 16.2.5 Fuji Electric Co
- 16.2.5.1. Overview
- 16.2.5.2. Products
- 16.2.5.3. SWOT Analysis
- 16.2.5.4. Recent Developments
- 16.2.5.5. Financials (Based on Availability)
- 16.2.6 Mannvit HF
- 16.2.6.1. Overview
- 16.2.6.2. Products
- 16.2.6.3. SWOT Analysis
- 16.2.6.4. Recent Developments
- 16.2.6.5. Financials (Based on Availability)
- 16.2.7 Mitsubishi Hitachi Power Systems
- 16.2.7.1. Overview
- 16.2.7.2. Products
- 16.2.7.3. SWOT Analysis
- 16.2.7.4. Recent Developments
- 16.2.7.5. Financials (Based on Availability)
- 16.2.8 Toshiba Energy Systems & Solutions Corporation
- 16.2.8.1. Overview
- 16.2.8.2. Products
- 16.2.8.3. SWOT Analysis
- 16.2.8.4. Recent Developments
- 16.2.8.5. Financials (Based on Availability)
- 16.2.9 Reykjavik Geothermal Ltd
- 16.2.9.1. Overview
- 16.2.9.2. Products
- 16.2.9.3. SWOT Analysis
- 16.2.9.4. Recent Developments
- 16.2.9.5. Financials (Based on Availability)
- 16.2.10 Tetra Tech Inc
- 16.2.10.1. Overview
- 16.2.10.2. Products
- 16.2.10.3. SWOT Analysis
- 16.2.10.4. Recent Developments
- 16.2.10.5. Financials (Based on Availability)
- 16.2.1 Terra-Gen Power LLC
List of Figures
- Figure 1: Global Geothermal Power Infrastructure Market Revenue Breakdown (Million, %) by Region 2024 & 2032
- Figure 2: North America Geothermal Power Infrastructure Market Revenue (Million), by Country 2024 & 2032
- Figure 3: North America Geothermal Power Infrastructure Market Revenue Share (%), by Country 2024 & 2032
- Figure 4: Europe Geothermal Power Infrastructure Market Revenue (Million), by Country 2024 & 2032
- Figure 5: Europe Geothermal Power Infrastructure Market Revenue Share (%), by Country 2024 & 2032
- Figure 6: Asia Pacific Geothermal Power Infrastructure Market Revenue (Million), by Country 2024 & 2032
- Figure 7: Asia Pacific Geothermal Power Infrastructure Market Revenue Share (%), by Country 2024 & 2032
- Figure 8: South America Geothermal Power Infrastructure Market Revenue (Million), by Country 2024 & 2032
- Figure 9: South America Geothermal Power Infrastructure Market Revenue Share (%), by Country 2024 & 2032
- Figure 10: MEA Geothermal Power Infrastructure Market Revenue (Million), by Country 2024 & 2032
- Figure 11: MEA Geothermal Power Infrastructure Market Revenue Share (%), by Country 2024 & 2032
- Figure 12: North America Geothermal Power Infrastructure Market Revenue (Million), by Type 2024 & 2032
- Figure 13: North America Geothermal Power Infrastructure Market Revenue Share (%), by Type 2024 & 2032
- Figure 14: North America Geothermal Power Infrastructure Market Revenue (Million), by Country 2024 & 2032
- Figure 15: North America Geothermal Power Infrastructure Market Revenue Share (%), by Country 2024 & 2032
- Figure 16: Europe Geothermal Power Infrastructure Market Revenue (Million), by Type 2024 & 2032
- Figure 17: Europe Geothermal Power Infrastructure Market Revenue Share (%), by Type 2024 & 2032
- Figure 18: Europe Geothermal Power Infrastructure Market Revenue (Million), by Country 2024 & 2032
- Figure 19: Europe Geothermal Power Infrastructure Market Revenue Share (%), by Country 2024 & 2032
- Figure 20: Asia Pacific Geothermal Power Infrastructure Market Revenue (Million), by Type 2024 & 2032
- Figure 21: Asia Pacific Geothermal Power Infrastructure Market Revenue Share (%), by Type 2024 & 2032
- Figure 22: Asia Pacific Geothermal Power Infrastructure Market Revenue (Million), by Country 2024 & 2032
- Figure 23: Asia Pacific Geothermal Power Infrastructure Market Revenue Share (%), by Country 2024 & 2032
- Figure 24: South America Geothermal Power Infrastructure Market Revenue (Million), by Type 2024 & 2032
- Figure 25: South America Geothermal Power Infrastructure Market Revenue Share (%), by Type 2024 & 2032
- Figure 26: South America Geothermal Power Infrastructure Market Revenue (Million), by Country 2024 & 2032
- Figure 27: South America Geothermal Power Infrastructure Market Revenue Share (%), by Country 2024 & 2032
- Figure 28: Middle East Geothermal Power Infrastructure Market Revenue (Million), by Type 2024 & 2032
- Figure 29: Middle East Geothermal Power Infrastructure Market Revenue Share (%), by Type 2024 & 2032
- Figure 30: Middle East Geothermal Power Infrastructure Market Revenue (Million), by Country 2024 & 2032
- Figure 31: Middle East Geothermal Power Infrastructure Market Revenue Share (%), by Country 2024 & 2032
List of Tables
- Table 1: Global Geothermal Power Infrastructure Market Revenue Million Forecast, by Region 2019 & 2032
- Table 2: Global Geothermal Power Infrastructure Market Revenue Million Forecast, by Type 2019 & 2032
- Table 3: Global Geothermal Power Infrastructure Market Revenue Million Forecast, by Region 2019 & 2032
- Table 4: Global Geothermal Power Infrastructure Market Revenue Million Forecast, by Country 2019 & 2032
- Table 5: United States Geothermal Power Infrastructure Market Revenue (Million) Forecast, by Application 2019 & 2032
- Table 6: Canada Geothermal Power Infrastructure Market Revenue (Million) Forecast, by Application 2019 & 2032
- Table 7: Mexico Geothermal Power Infrastructure Market Revenue (Million) Forecast, by Application 2019 & 2032
- Table 8: Global Geothermal Power Infrastructure Market Revenue Million Forecast, by Country 2019 & 2032
- Table 9: Germany Geothermal Power Infrastructure Market Revenue (Million) Forecast, by Application 2019 & 2032
- Table 10: United Kingdom Geothermal Power Infrastructure Market Revenue (Million) Forecast, by Application 2019 & 2032
- Table 11: France Geothermal Power Infrastructure Market Revenue (Million) Forecast, by Application 2019 & 2032
- Table 12: Spain Geothermal Power Infrastructure Market Revenue (Million) Forecast, by Application 2019 & 2032
- Table 13: Italy Geothermal Power Infrastructure Market Revenue (Million) Forecast, by Application 2019 & 2032
- Table 14: Spain Geothermal Power Infrastructure Market Revenue (Million) Forecast, by Application 2019 & 2032
- Table 15: Belgium Geothermal Power Infrastructure Market Revenue (Million) Forecast, by Application 2019 & 2032
- Table 16: Netherland Geothermal Power Infrastructure Market Revenue (Million) Forecast, by Application 2019 & 2032
- Table 17: Nordics Geothermal Power Infrastructure Market Revenue (Million) Forecast, by Application 2019 & 2032
- Table 18: Rest of Europe Geothermal Power Infrastructure Market Revenue (Million) Forecast, by Application 2019 & 2032
- Table 19: Global Geothermal Power Infrastructure Market Revenue Million Forecast, by Country 2019 & 2032
- Table 20: China Geothermal Power Infrastructure Market Revenue (Million) Forecast, by Application 2019 & 2032
- Table 21: Japan Geothermal Power Infrastructure Market Revenue (Million) Forecast, by Application 2019 & 2032
- Table 22: India Geothermal Power Infrastructure Market Revenue (Million) Forecast, by Application 2019 & 2032
- Table 23: South Korea Geothermal Power Infrastructure Market Revenue (Million) Forecast, by Application 2019 & 2032
- Table 24: Southeast Asia Geothermal Power Infrastructure Market Revenue (Million) Forecast, by Application 2019 & 2032
- Table 25: Australia Geothermal Power Infrastructure Market Revenue (Million) Forecast, by Application 2019 & 2032
- Table 26: Indonesia Geothermal Power Infrastructure Market Revenue (Million) Forecast, by Application 2019 & 2032
- Table 27: Phillipes Geothermal Power Infrastructure Market Revenue (Million) Forecast, by Application 2019 & 2032
- Table 28: Singapore Geothermal Power Infrastructure Market Revenue (Million) Forecast, by Application 2019 & 2032
- Table 29: Thailandc Geothermal Power Infrastructure Market Revenue (Million) Forecast, by Application 2019 & 2032
- Table 30: Rest of Asia Pacific Geothermal Power Infrastructure Market Revenue (Million) Forecast, by Application 2019 & 2032
- Table 31: Global Geothermal Power Infrastructure Market Revenue Million Forecast, by Country 2019 & 2032
- Table 32: Brazil Geothermal Power Infrastructure Market Revenue (Million) Forecast, by Application 2019 & 2032
- Table 33: Argentina Geothermal Power Infrastructure Market Revenue (Million) Forecast, by Application 2019 & 2032
- Table 34: Peru Geothermal Power Infrastructure Market Revenue (Million) Forecast, by Application 2019 & 2032
- Table 35: Chile Geothermal Power Infrastructure Market Revenue (Million) Forecast, by Application 2019 & 2032
- Table 36: Colombia Geothermal Power Infrastructure Market Revenue (Million) Forecast, by Application 2019 & 2032
- Table 37: Ecuador Geothermal Power Infrastructure Market Revenue (Million) Forecast, by Application 2019 & 2032
- Table 38: Venezuela Geothermal Power Infrastructure Market Revenue (Million) Forecast, by Application 2019 & 2032
- Table 39: Rest of South America Geothermal Power Infrastructure Market Revenue (Million) Forecast, by Application 2019 & 2032
- Table 40: Global Geothermal Power Infrastructure Market Revenue Million Forecast, by Country 2019 & 2032
- Table 41: United Arab Emirates Geothermal Power Infrastructure Market Revenue (Million) Forecast, by Application 2019 & 2032
- Table 42: Saudi Arabia Geothermal Power Infrastructure Market Revenue (Million) Forecast, by Application 2019 & 2032
- Table 43: South Africa Geothermal Power Infrastructure Market Revenue (Million) Forecast, by Application 2019 & 2032
- Table 44: Rest of Middle East and Africa Geothermal Power Infrastructure Market Revenue (Million) Forecast, by Application 2019 & 2032
- Table 45: Global Geothermal Power Infrastructure Market Revenue Million Forecast, by Type 2019 & 2032
- Table 46: Global Geothermal Power Infrastructure Market Revenue Million Forecast, by Country 2019 & 2032
- Table 47: Global Geothermal Power Infrastructure Market Revenue Million Forecast, by Type 2019 & 2032
- Table 48: Global Geothermal Power Infrastructure Market Revenue Million Forecast, by Country 2019 & 2032
- Table 49: Global Geothermal Power Infrastructure Market Revenue Million Forecast, by Type 2019 & 2032
- Table 50: Global Geothermal Power Infrastructure Market Revenue Million Forecast, by Country 2019 & 2032
- Table 51: Global Geothermal Power Infrastructure Market Revenue Million Forecast, by Type 2019 & 2032
- Table 52: Global Geothermal Power Infrastructure Market Revenue Million Forecast, by Country 2019 & 2032
- Table 53: Global Geothermal Power Infrastructure Market Revenue Million Forecast, by Type 2019 & 2032
- Table 54: Global Geothermal Power Infrastructure Market Revenue Million Forecast, by Country 2019 & 2032
Frequently Asked Questions
1. What is the projected Compound Annual Growth Rate (CAGR) of the Geothermal Power Infrastructure Market?
The projected CAGR is approximately > 2.50%.
2. Which companies are prominent players in the Geothermal Power Infrastructure Market?
Key companies in the market include Terra-Gen Power LLC, Turboden SpA, ElectraTherm Inc, Calpine Corporation, Fuji Electric Co, Mannvit HF, Mitsubishi Hitachi Power Systems, Toshiba Energy Systems & Solutions Corporation, Reykjavik Geothermal Ltd, Tetra Tech Inc.
3. What are the main segments of the Geothermal Power Infrastructure Market?
The market segments include Type.
4. Can you provide details about the market size?
The market size is estimated to be USD XX Million as of 2022.
5. What are some drivers contributing to market growth?
4.; Increasing Demand from Various End-user Industries.
6. What are the notable trends driving market growth?
Flash Plants are projected to Dominate the Market.
7. Are there any restraints impacting market growth?
4.; Higher Capital and Operational Cost.
8. Can you provide examples of recent developments in the market?
N/A
9. What pricing options are available for accessing the report?
Pricing options include single-user, multi-user, and enterprise licenses priced at USD 4750, USD 5250, and USD 8750 respectively.
10. Is the market size provided in terms of value or volume?
The market size is provided in terms of value, measured in Million.
11. Are there any specific market keywords associated with the report?
Yes, the market keyword associated with the report is "Geothermal Power Infrastructure Market," which aids in identifying and referencing the specific market segment covered.
12. How do I determine which pricing option suits my needs best?
The pricing options vary based on user requirements and access needs. Individual users may opt for single-user licenses, while businesses requiring broader access may choose multi-user or enterprise licenses for cost-effective access to the report.
13. Are there any additional resources or data provided in the Geothermal Power Infrastructure Market report?
While the report offers comprehensive insights, it's advisable to review the specific contents or supplementary materials provided to ascertain if additional resources or data are available.
14. How can I stay updated on further developments or reports in the Geothermal Power Infrastructure Market?
To stay informed about further developments, trends, and reports in the Geothermal Power Infrastructure Market, consider subscribing to industry newsletters, following relevant companies and organizations, or regularly checking reputable industry news sources and publications.
Methodology
Step 1 - Identification of Relevant Samples Size from Population Database


Step 2 - Approaches for Defining Global Market Size (Value, Volume* & Price*)

Note*: In applicable scenarios
Step 3 - Data Sources
Primary Research
- Web Analytics
- Survey Reports
- Research Institute
- Latest Research Reports
- Opinion Leaders
Secondary Research
- Annual Reports
- White Paper
- Latest Press Release
- Industry Association
- Paid Database
- Investor Presentations

Step 4 - Data Triangulation
Involves using different sources of information in order to increase the validity of a study
These sources are likely to be stakeholders in a program - participants, other researchers, program staff, other community members, and so on.
Then we put all data in single framework & apply various statistical tools to find out the dynamic on the market.
During the analysis stage, feedback from the stakeholder groups would be compared to determine areas of agreement as well as areas of divergence


