
Key Insights
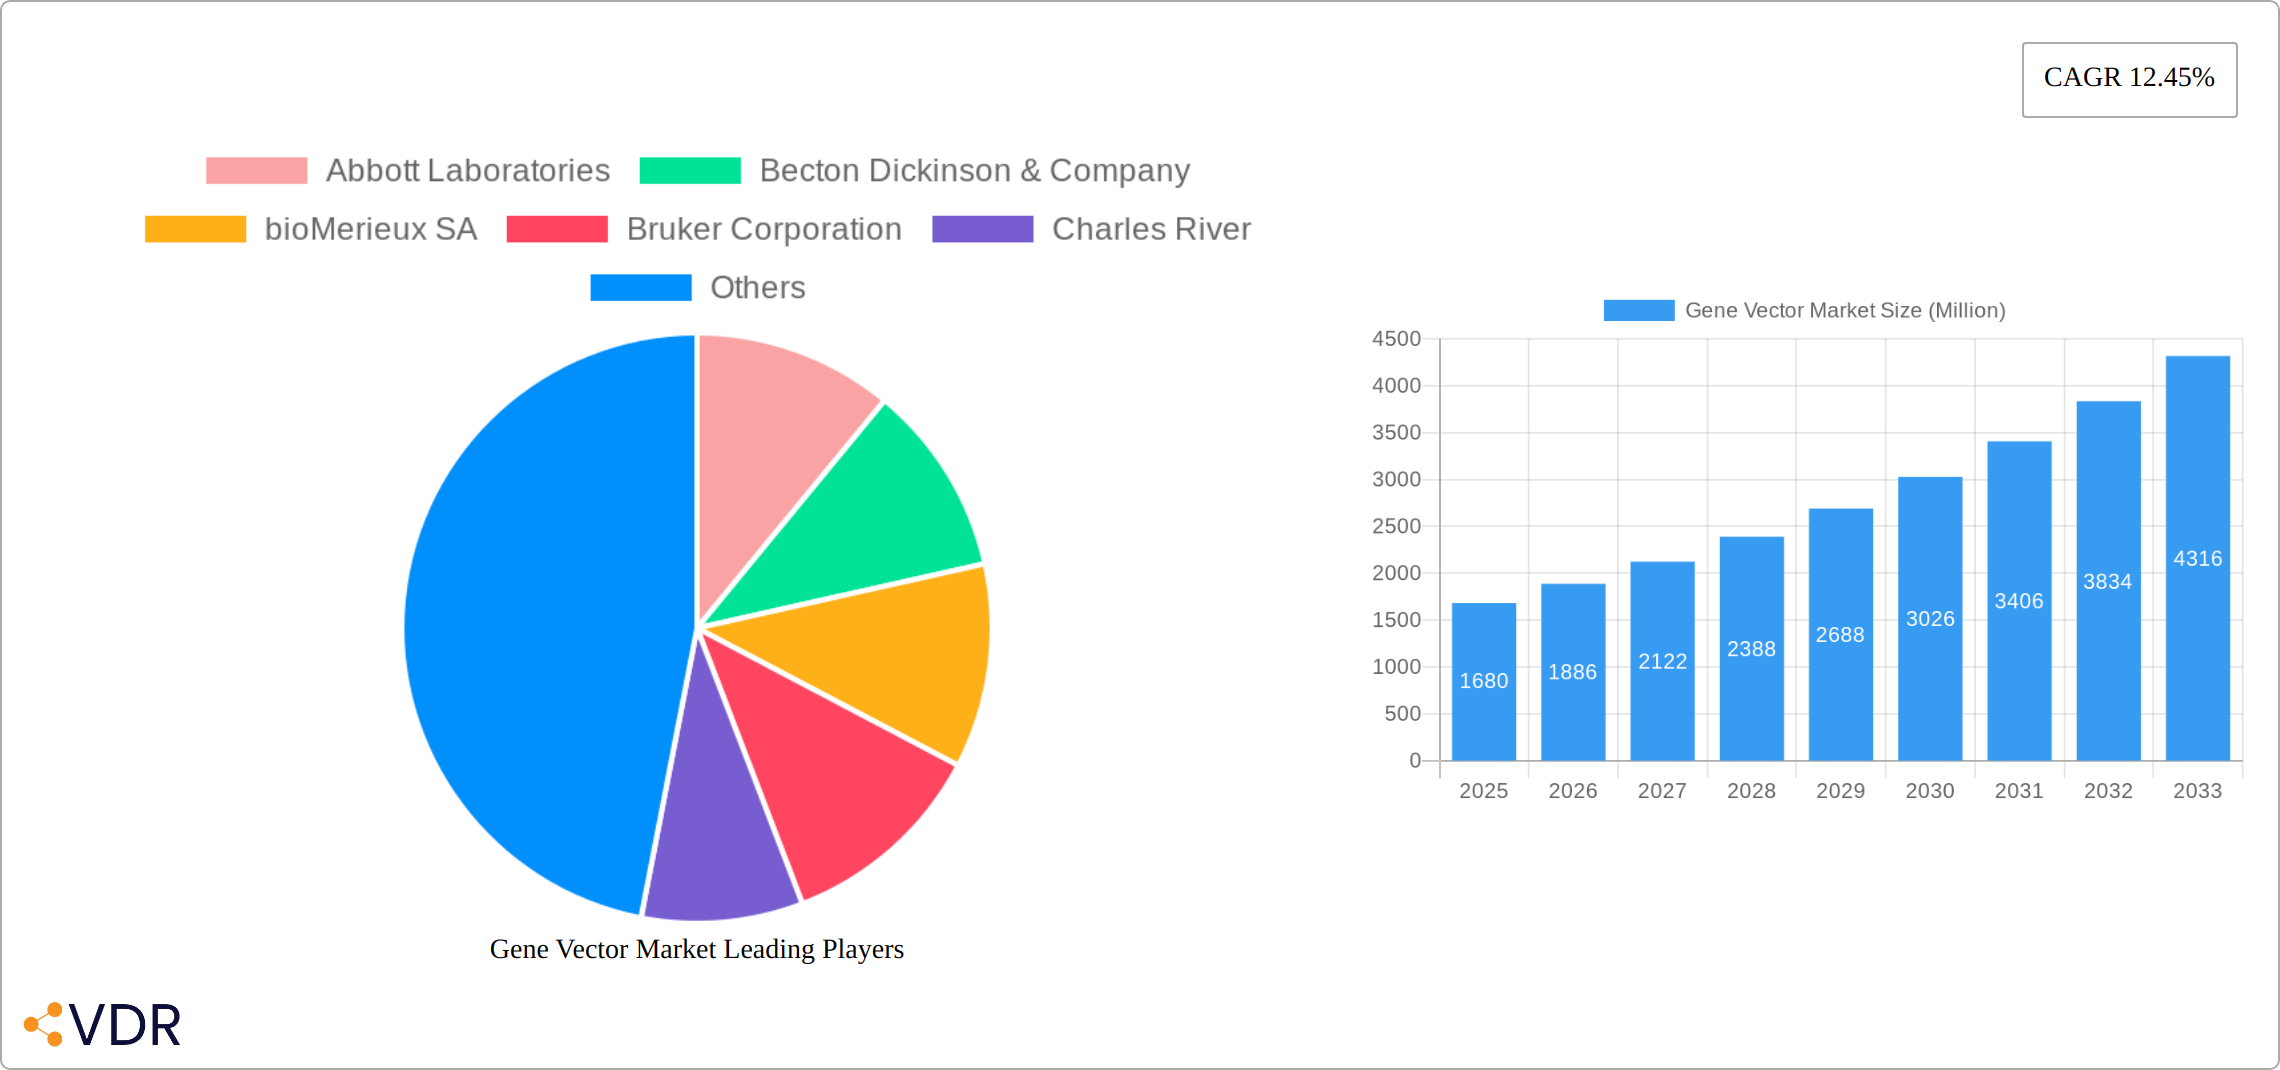
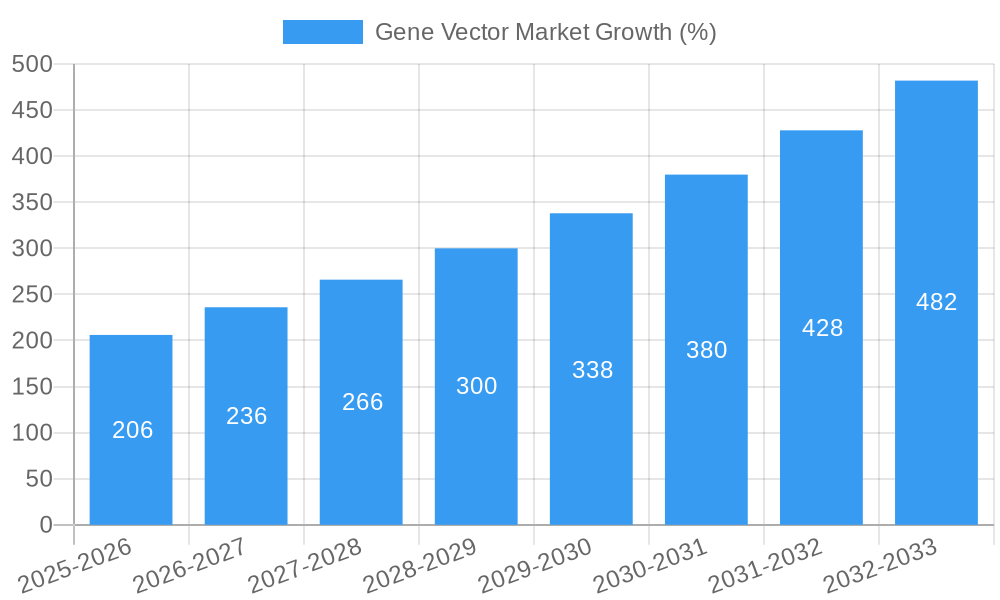
The global gene vector market, valued at $1.68 billion in 2025, is projected to experience robust growth, driven by the increasing prevalence of genetic disorders and the rising adoption of gene therapy as a treatment modality. The Compound Annual Growth Rate (CAGR) of 12.45% from 2025 to 2033 indicates a significant expansion of this market over the forecast period. Key drivers include advancements in gene editing technologies like CRISPR-Cas9, increasing investments in research and development by pharmaceutical and biotechnology companies, and the growing success of clinical trials demonstrating the efficacy and safety of gene therapies. The market is segmented by vector type (viral vectors such as adeno-associated viruses (AAVs), lentiviruses, and retroviruses, and non-viral vectors), therapeutic application (oncology, monogenic diseases, infectious diseases), and end-user (research institutions, hospitals and clinics, pharmaceutical companies). Competition within the market is intense, with key players like Abbott Laboratories, Becton Dickinson, and Thermo Fisher Scientific contributing significantly to innovation and market share. The market's expansion will be influenced by ongoing research to improve vector delivery systems, addressing safety concerns associated with certain vectors, and navigating the complex regulatory landscape surrounding gene therapies.
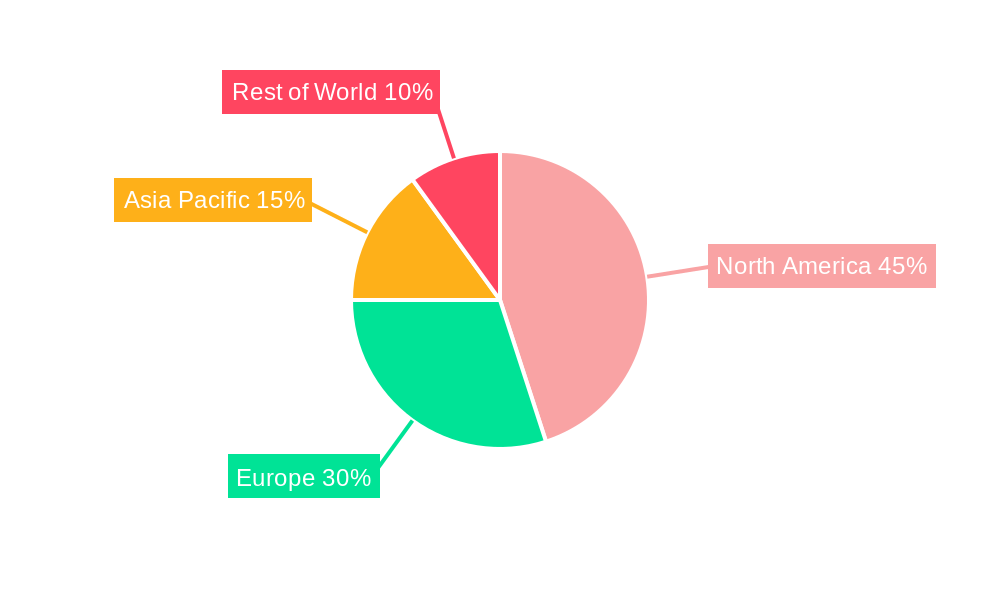
The continued growth of the gene vector market hinges on several factors, including the expansion of gene therapy applications beyond rare diseases into more common conditions, the development of personalized medicine approaches leveraging gene vectors, and the increasing affordability of these advanced therapies. Challenges remain, however, including the high cost of manufacturing gene vectors, potential immunogenicity issues, and the need for effective long-term monitoring of patients undergoing gene therapy. Nevertheless, ongoing technological advancements and the unwavering commitment of researchers and pharmaceutical companies suggest the gene vector market is poised for sustained and significant growth throughout the forecast period. The geographical distribution of market share is likely skewed towards North America and Europe initially due to higher levels of investment and regulatory approvals, but emerging markets in Asia-Pacific and Latin America are expected to witness substantial growth in the coming years.
Gene Vector Market: A Comprehensive Report (2019-2033)
This in-depth report provides a comprehensive analysis of the Gene Vector market, encompassing market dynamics, growth trends, regional analysis, product landscape, key players, and future outlook. The study period covers 2019-2033, with 2025 as the base and estimated year. The report utilizes both parent and child market segmentation to deliver granular insights and forecasts. The market is projected to reach xx Million by 2033, exhibiting a CAGR of xx% during the forecast period (2025-2033).
Gene Vector Market Market Dynamics & Structure
The Gene Vector market is characterized by a moderately concentrated landscape, with key players such as Abbott Laboratories, Becton Dickinson & Company, bioMerieux SA, Bruker Corporation, Charles River, Danaher Corporation, Merck KGaA, Sartorius Group, Shimadzu Corporation, and Thermo Fisher Scientific holding significant market share. However, the market is witnessing increased participation from smaller companies and startups, leading to heightened competition.
Market Structure:
- Market Concentration: Moderately concentrated, with the top 5 players accounting for approximately xx% of the market share in 2024.
- Technological Innovation: Rapid advancements in gene editing technologies (CRISPR, TALEN) are driving innovation in vector design and manufacturing.
- Regulatory Frameworks: Stringent regulatory approvals for gene therapy products create both opportunities and challenges for market players. The varying regulatory landscapes across different regions influence market growth rates.
- Competitive Product Substitutes: Emerging gene editing technologies and alternative delivery methods present potential competitive threats.
- End-User Demographics: The market is driven by increasing demand from research institutions, pharmaceutical companies, and biotechnology firms engaged in gene therapy development.
- M&A Trends: The past five years have witnessed xx M&A deals in the gene vector market, predominantly driven by the desire to expand product portfolios and access new technologies.
Gene Vector Market Growth Trends & Insights
The Gene Vector market has experienced significant growth over the historical period (2019-2024), driven primarily by the burgeoning field of gene therapy and increasing investments in research and development. The market is segmented based on vector type (viral vectors – adeno-associated virus (AAV), lentivirus, retrovirus; non-viral vectors – liposomes, nanoparticles), application (oncology, infectious diseases, genetic disorders), and end-user. The adoption rate of gene vectors in clinical trials has increased significantly, indicating strong future market growth. Technological disruptions, such as advancements in targeted delivery systems and improved vector safety profiles, are further accelerating market growth. Consumer behavior shifts towards personalized medicine are bolstering demand for gene therapy products.
- Market Size: The global Gene Vector market size was valued at xx Million in 2024 and is projected to reach xx Million by 2033.
- CAGR: The market is expected to witness a CAGR of xx% during the forecast period (2025-2033).
- Market Penetration: Market penetration is increasing, driven by the approval and launch of new gene therapy products and increasing awareness of the benefits of gene therapy.
Dominant Regions, Countries, or Segments in Gene Vector Market
North America currently dominates the Gene Vector market, driven by robust R&D investment, early adoption of advanced technologies, and favorable regulatory frameworks. Europe follows as a significant market, while the Asia-Pacific region is experiencing rapid growth due to increasing healthcare expenditure and government initiatives to promote the development of gene therapy.
Key Drivers:
- North America: High R&D investments, strong regulatory support, and a large pool of skilled professionals.
- Europe: Significant government funding for gene therapy research and a growing number of clinical trials.
- Asia-Pacific: Rising healthcare spending, increasing prevalence of genetic disorders, and growing awareness of gene therapy.
Gene Vector Market Product Landscape
The Gene Vector market offers a diverse range of products, encompassing various viral and non-viral vectors designed for specific applications. Innovations focus on enhancing vector safety, efficacy, and targeted delivery. Key performance metrics include transduction efficiency, immunogenicity, and production yield. Unique selling propositions are built around improved specificity, reduced toxicity, and enhanced manufacturing processes. Technological advancements involve improved vector design, incorporating targeting ligands, and developing novel manufacturing platforms.
Key Drivers, Barriers & Challenges in Gene Vector Market
Key Drivers:
- Increasing prevalence of genetic disorders.
- Rising investments in gene therapy R&D.
- Technological advancements in gene editing and vector design.
- Favorable regulatory frameworks in certain regions.
Challenges and Restraints:
- High cost of gene therapy treatments.
- Potential safety concerns associated with gene vectors.
- Stringent regulatory requirements for approval.
- Limited production capacity and scalability challenges.
- Competition from alternative treatment modalities.
Emerging Opportunities in Gene Vector Market
Emerging opportunities include the development of novel gene vectors with enhanced capabilities, expanding applications into new therapeutic areas (e.g., cardiovascular diseases), and exploring personalized medicine approaches using gene vectors. Untapped markets in emerging economies present significant growth potential. The development of gene editing tools with increased precision opens new avenues for gene therapy.
Growth Accelerators in the Gene Vector Market Industry
Technological breakthroughs in gene editing and vector design, strategic partnerships between pharmaceutical companies and biotechnology firms, and the expansion of gene therapy clinical trials are key growth accelerators. Increased investment in manufacturing facilities and improved manufacturing processes also contribute to market expansion.
Key Players Shaping the Gene Vector Market Market
- Abbott Laboratories
- Becton Dickinson & Company
- bioMerieux SA
- Bruker Corporation
- Charles River
- Danaher Corporation
- Merck KGaA
- Sartorius Group
- Shimadzu Corporation
- Thermo Fisher Scientific
- *List Not Exhaustive
Notable Milestones in Gene Vector Market Sector
- April 2024: Ring Therapeutics successfully delivered a viral gene to the retinas of mice using its Anellogy platform, demonstrating the potential of anellovirus-based vectors.
- November 2023: Genezen secured USD 18.5 million in funding to accelerate retroviral, lentiviral, and AAV vector manufacturing.
In-Depth Gene Vector Market Market Outlook
The Gene Vector market is poised for significant growth over the next decade, driven by continuous technological advancements, expanding therapeutic applications, and increasing market acceptance of gene therapy. Strategic partnerships and collaborations among industry players will further propel market expansion. Focus on improving vector safety, efficacy, and affordability will be crucial for realizing the full potential of this rapidly growing sector.
Gene Vector Market Segmentation
-
1. Product Type
- 1.1. Consumables
-
1.2. Instruments
- 1.2.1. Automated Identification & Testing Systems
- 1.2.2. Biolumin
- 1.2.3. Mass Spectrometers
- 1.2.4. Others
- 1.3. Reagents & Kits
-
2. Method
- 2.1. Cellular Component-based Testing
- 2.2. Nucleic Acid-based Testing
- 2.3. Others
-
3. End User
- 3.1. Clinical Laboratories
- 3.2. Food & Beverage Industry
- 3.3. Healthcare Facilities
- 3.4. Life Science Research & Development Facilities
- 3.5. Other End Users
Gene Vector Market Segmentation By Geography
-
1. North America
- 1.1. United States
- 1.2. Canada
- 1.3. Mexico
-
2. Europe
- 2.1. Germany
- 2.2. United Kingdom
- 2.3. France
- 2.4. Italy
- 2.5. Spain
- 2.6. Rest of Europe
-
3. Asia Pacific
- 3.1. China
- 3.2. Japan
- 3.3. India
- 3.4. Australia
- 3.5. South Korea
- 3.6. Rest of Asia Pacific
-
4. Middle East and Africa
- 4.1. GCC
- 4.2. South Africa
- 4.3. Rest of Middle East and Africa
-
5. South America
- 5.1. Brazil
- 5.2. Argentina
- 5.3. Rest of South America
Gene Vector Market REPORT HIGHLIGHTS
| Aspects | Details |
|---|---|
| Study Period | 2019-2033 |
| Base Year | 2024 |
| Estimated Year | 2025 |
| Forecast Period | 2025-2033 |
| Historical Period | 2019-2024 |
| Growth Rate | CAGR of 12.45% from 2019-2033 |
| Segmentation |
|
Table of Contents
- 1. Introduction
- 1.1. Research Scope
- 1.2. Market Segmentation
- 1.3. Research Methodology
- 1.4. Definitions and Assumptions
- 2. Executive Summary
- 2.1. Introduction
- 3. Market Dynamics
- 3.1. Introduction
- 3.2. Market Drivers
- 3.2.1. Rising Number of Infectious Diseases; Increasing Adoption by Food & Beverage Industry; Growing Government Initiatives
- 3.3. Market Restrains
- 3.3.1. Rising Number of Infectious Diseases; Increasing Adoption by Food & Beverage Industry; Growing Government Initiatives
- 3.4. Market Trends
- 3.4.1. The Segment for Cancer is Expected to Witness Substantial Growth Over the Forecast Period
- 4. Market Factor Analysis
- 4.1. Porters Five Forces
- 4.2. Supply/Value Chain
- 4.3. PESTEL analysis
- 4.4. Market Entropy
- 4.5. Patent/Trademark Analysis
- 5. Global Gene Vector Market Analysis, Insights and Forecast, 2019-2031
- 5.1. Market Analysis, Insights and Forecast - by Product Type
- 5.1.1. Consumables
- 5.1.2. Instruments
- 5.1.2.1. Automated Identification & Testing Systems
- 5.1.2.2. Biolumin
- 5.1.2.3. Mass Spectrometers
- 5.1.2.4. Others
- 5.1.3. Reagents & Kits
- 5.2. Market Analysis, Insights and Forecast - by Method
- 5.2.1. Cellular Component-based Testing
- 5.2.2. Nucleic Acid-based Testing
- 5.2.3. Others
- 5.3. Market Analysis, Insights and Forecast - by End User
- 5.3.1. Clinical Laboratories
- 5.3.2. Food & Beverage Industry
- 5.3.3. Healthcare Facilities
- 5.3.4. Life Science Research & Development Facilities
- 5.3.5. Other End Users
- 5.4. Market Analysis, Insights and Forecast - by Region
- 5.4.1. North America
- 5.4.2. Europe
- 5.4.3. Asia Pacific
- 5.4.4. Middle East and Africa
- 5.4.5. South America
- 5.1. Market Analysis, Insights and Forecast - by Product Type
- 6. North America Gene Vector Market Analysis, Insights and Forecast, 2019-2031
- 6.1. Market Analysis, Insights and Forecast - by Product Type
- 6.1.1. Consumables
- 6.1.2. Instruments
- 6.1.2.1. Automated Identification & Testing Systems
- 6.1.2.2. Biolumin
- 6.1.2.3. Mass Spectrometers
- 6.1.2.4. Others
- 6.1.3. Reagents & Kits
- 6.2. Market Analysis, Insights and Forecast - by Method
- 6.2.1. Cellular Component-based Testing
- 6.2.2. Nucleic Acid-based Testing
- 6.2.3. Others
- 6.3. Market Analysis, Insights and Forecast - by End User
- 6.3.1. Clinical Laboratories
- 6.3.2. Food & Beverage Industry
- 6.3.3. Healthcare Facilities
- 6.3.4. Life Science Research & Development Facilities
- 6.3.5. Other End Users
- 6.1. Market Analysis, Insights and Forecast - by Product Type
- 7. Europe Gene Vector Market Analysis, Insights and Forecast, 2019-2031
- 7.1. Market Analysis, Insights and Forecast - by Product Type
- 7.1.1. Consumables
- 7.1.2. Instruments
- 7.1.2.1. Automated Identification & Testing Systems
- 7.1.2.2. Biolumin
- 7.1.2.3. Mass Spectrometers
- 7.1.2.4. Others
- 7.1.3. Reagents & Kits
- 7.2. Market Analysis, Insights and Forecast - by Method
- 7.2.1. Cellular Component-based Testing
- 7.2.2. Nucleic Acid-based Testing
- 7.2.3. Others
- 7.3. Market Analysis, Insights and Forecast - by End User
- 7.3.1. Clinical Laboratories
- 7.3.2. Food & Beverage Industry
- 7.3.3. Healthcare Facilities
- 7.3.4. Life Science Research & Development Facilities
- 7.3.5. Other End Users
- 7.1. Market Analysis, Insights and Forecast - by Product Type
- 8. Asia Pacific Gene Vector Market Analysis, Insights and Forecast, 2019-2031
- 8.1. Market Analysis, Insights and Forecast - by Product Type
- 8.1.1. Consumables
- 8.1.2. Instruments
- 8.1.2.1. Automated Identification & Testing Systems
- 8.1.2.2. Biolumin
- 8.1.2.3. Mass Spectrometers
- 8.1.2.4. Others
- 8.1.3. Reagents & Kits
- 8.2. Market Analysis, Insights and Forecast - by Method
- 8.2.1. Cellular Component-based Testing
- 8.2.2. Nucleic Acid-based Testing
- 8.2.3. Others
- 8.3. Market Analysis, Insights and Forecast - by End User
- 8.3.1. Clinical Laboratories
- 8.3.2. Food & Beverage Industry
- 8.3.3. Healthcare Facilities
- 8.3.4. Life Science Research & Development Facilities
- 8.3.5. Other End Users
- 8.1. Market Analysis, Insights and Forecast - by Product Type
- 9. Middle East and Africa Gene Vector Market Analysis, Insights and Forecast, 2019-2031
- 9.1. Market Analysis, Insights and Forecast - by Product Type
- 9.1.1. Consumables
- 9.1.2. Instruments
- 9.1.2.1. Automated Identification & Testing Systems
- 9.1.2.2. Biolumin
- 9.1.2.3. Mass Spectrometers
- 9.1.2.4. Others
- 9.1.3. Reagents & Kits
- 9.2. Market Analysis, Insights and Forecast - by Method
- 9.2.1. Cellular Component-based Testing
- 9.2.2. Nucleic Acid-based Testing
- 9.2.3. Others
- 9.3. Market Analysis, Insights and Forecast - by End User
- 9.3.1. Clinical Laboratories
- 9.3.2. Food & Beverage Industry
- 9.3.3. Healthcare Facilities
- 9.3.4. Life Science Research & Development Facilities
- 9.3.5. Other End Users
- 9.1. Market Analysis, Insights and Forecast - by Product Type
- 10. South America Gene Vector Market Analysis, Insights and Forecast, 2019-2031
- 10.1. Market Analysis, Insights and Forecast - by Product Type
- 10.1.1. Consumables
- 10.1.2. Instruments
- 10.1.2.1. Automated Identification & Testing Systems
- 10.1.2.2. Biolumin
- 10.1.2.3. Mass Spectrometers
- 10.1.2.4. Others
- 10.1.3. Reagents & Kits
- 10.2. Market Analysis, Insights and Forecast - by Method
- 10.2.1. Cellular Component-based Testing
- 10.2.2. Nucleic Acid-based Testing
- 10.2.3. Others
- 10.3. Market Analysis, Insights and Forecast - by End User
- 10.3.1. Clinical Laboratories
- 10.3.2. Food & Beverage Industry
- 10.3.3. Healthcare Facilities
- 10.3.4. Life Science Research & Development Facilities
- 10.3.5. Other End Users
- 10.1. Market Analysis, Insights and Forecast - by Product Type
- 11. Competitive Analysis
- 11.1. Global Market Share Analysis 2024
- 11.2. Company Profiles
- 11.2.1 Abbott Laboratories
- 11.2.1.1. Overview
- 11.2.1.2. Products
- 11.2.1.3. SWOT Analysis
- 11.2.1.4. Recent Developments
- 11.2.1.5. Financials (Based on Availability)
- 11.2.2 Becton Dickinson & Company
- 11.2.2.1. Overview
- 11.2.2.2. Products
- 11.2.2.3. SWOT Analysis
- 11.2.2.4. Recent Developments
- 11.2.2.5. Financials (Based on Availability)
- 11.2.3 bioMerieux SA
- 11.2.3.1. Overview
- 11.2.3.2. Products
- 11.2.3.3. SWOT Analysis
- 11.2.3.4. Recent Developments
- 11.2.3.5. Financials (Based on Availability)
- 11.2.4 Bruker Corporation
- 11.2.4.1. Overview
- 11.2.4.2. Products
- 11.2.4.3. SWOT Analysis
- 11.2.4.4. Recent Developments
- 11.2.4.5. Financials (Based on Availability)
- 11.2.5 Charles River
- 11.2.5.1. Overview
- 11.2.5.2. Products
- 11.2.5.3. SWOT Analysis
- 11.2.5.4. Recent Developments
- 11.2.5.5. Financials (Based on Availability)
- 11.2.6 Danaher Corporation
- 11.2.6.1. Overview
- 11.2.6.2. Products
- 11.2.6.3. SWOT Analysis
- 11.2.6.4. Recent Developments
- 11.2.6.5. Financials (Based on Availability)
- 11.2.7 Merck KGaA
- 11.2.7.1. Overview
- 11.2.7.2. Products
- 11.2.7.3. SWOT Analysis
- 11.2.7.4. Recent Developments
- 11.2.7.5. Financials (Based on Availability)
- 11.2.8 Sartorius Group
- 11.2.8.1. Overview
- 11.2.8.2. Products
- 11.2.8.3. SWOT Analysis
- 11.2.8.4. Recent Developments
- 11.2.8.5. Financials (Based on Availability)
- 11.2.9 Shimadzu Corporation
- 11.2.9.1. Overview
- 11.2.9.2. Products
- 11.2.9.3. SWOT Analysis
- 11.2.9.4. Recent Developments
- 11.2.9.5. Financials (Based on Availability)
- 11.2.10 Thermo Fisher Scientific*List Not Exhaustive
- 11.2.10.1. Overview
- 11.2.10.2. Products
- 11.2.10.3. SWOT Analysis
- 11.2.10.4. Recent Developments
- 11.2.10.5. Financials (Based on Availability)
- 11.2.1 Abbott Laboratories
List of Figures
- Figure 1: Global Gene Vector Market Revenue Breakdown (Million, %) by Region 2024 & 2032
- Figure 2: Global Gene Vector Market Volume Breakdown (Billion, %) by Region 2024 & 2032
- Figure 3: North America Gene Vector Market Revenue (Million), by Product Type 2024 & 2032
- Figure 4: North America Gene Vector Market Volume (Billion), by Product Type 2024 & 2032
- Figure 5: North America Gene Vector Market Revenue Share (%), by Product Type 2024 & 2032
- Figure 6: North America Gene Vector Market Volume Share (%), by Product Type 2024 & 2032
- Figure 7: North America Gene Vector Market Revenue (Million), by Method 2024 & 2032
- Figure 8: North America Gene Vector Market Volume (Billion), by Method 2024 & 2032
- Figure 9: North America Gene Vector Market Revenue Share (%), by Method 2024 & 2032
- Figure 10: North America Gene Vector Market Volume Share (%), by Method 2024 & 2032
- Figure 11: North America Gene Vector Market Revenue (Million), by End User 2024 & 2032
- Figure 12: North America Gene Vector Market Volume (Billion), by End User 2024 & 2032
- Figure 13: North America Gene Vector Market Revenue Share (%), by End User 2024 & 2032
- Figure 14: North America Gene Vector Market Volume Share (%), by End User 2024 & 2032
- Figure 15: North America Gene Vector Market Revenue (Million), by Country 2024 & 2032
- Figure 16: North America Gene Vector Market Volume (Billion), by Country 2024 & 2032
- Figure 17: North America Gene Vector Market Revenue Share (%), by Country 2024 & 2032
- Figure 18: North America Gene Vector Market Volume Share (%), by Country 2024 & 2032
- Figure 19: Europe Gene Vector Market Revenue (Million), by Product Type 2024 & 2032
- Figure 20: Europe Gene Vector Market Volume (Billion), by Product Type 2024 & 2032
- Figure 21: Europe Gene Vector Market Revenue Share (%), by Product Type 2024 & 2032
- Figure 22: Europe Gene Vector Market Volume Share (%), by Product Type 2024 & 2032
- Figure 23: Europe Gene Vector Market Revenue (Million), by Method 2024 & 2032
- Figure 24: Europe Gene Vector Market Volume (Billion), by Method 2024 & 2032
- Figure 25: Europe Gene Vector Market Revenue Share (%), by Method 2024 & 2032
- Figure 26: Europe Gene Vector Market Volume Share (%), by Method 2024 & 2032
- Figure 27: Europe Gene Vector Market Revenue (Million), by End User 2024 & 2032
- Figure 28: Europe Gene Vector Market Volume (Billion), by End User 2024 & 2032
- Figure 29: Europe Gene Vector Market Revenue Share (%), by End User 2024 & 2032
- Figure 30: Europe Gene Vector Market Volume Share (%), by End User 2024 & 2032
- Figure 31: Europe Gene Vector Market Revenue (Million), by Country 2024 & 2032
- Figure 32: Europe Gene Vector Market Volume (Billion), by Country 2024 & 2032
- Figure 33: Europe Gene Vector Market Revenue Share (%), by Country 2024 & 2032
- Figure 34: Europe Gene Vector Market Volume Share (%), by Country 2024 & 2032
- Figure 35: Asia Pacific Gene Vector Market Revenue (Million), by Product Type 2024 & 2032
- Figure 36: Asia Pacific Gene Vector Market Volume (Billion), by Product Type 2024 & 2032
- Figure 37: Asia Pacific Gene Vector Market Revenue Share (%), by Product Type 2024 & 2032
- Figure 38: Asia Pacific Gene Vector Market Volume Share (%), by Product Type 2024 & 2032
- Figure 39: Asia Pacific Gene Vector Market Revenue (Million), by Method 2024 & 2032
- Figure 40: Asia Pacific Gene Vector Market Volume (Billion), by Method 2024 & 2032
- Figure 41: Asia Pacific Gene Vector Market Revenue Share (%), by Method 2024 & 2032
- Figure 42: Asia Pacific Gene Vector Market Volume Share (%), by Method 2024 & 2032
- Figure 43: Asia Pacific Gene Vector Market Revenue (Million), by End User 2024 & 2032
- Figure 44: Asia Pacific Gene Vector Market Volume (Billion), by End User 2024 & 2032
- Figure 45: Asia Pacific Gene Vector Market Revenue Share (%), by End User 2024 & 2032
- Figure 46: Asia Pacific Gene Vector Market Volume Share (%), by End User 2024 & 2032
- Figure 47: Asia Pacific Gene Vector Market Revenue (Million), by Country 2024 & 2032
- Figure 48: Asia Pacific Gene Vector Market Volume (Billion), by Country 2024 & 2032
- Figure 49: Asia Pacific Gene Vector Market Revenue Share (%), by Country 2024 & 2032
- Figure 50: Asia Pacific Gene Vector Market Volume Share (%), by Country 2024 & 2032
- Figure 51: Middle East and Africa Gene Vector Market Revenue (Million), by Product Type 2024 & 2032
- Figure 52: Middle East and Africa Gene Vector Market Volume (Billion), by Product Type 2024 & 2032
- Figure 53: Middle East and Africa Gene Vector Market Revenue Share (%), by Product Type 2024 & 2032
- Figure 54: Middle East and Africa Gene Vector Market Volume Share (%), by Product Type 2024 & 2032
- Figure 55: Middle East and Africa Gene Vector Market Revenue (Million), by Method 2024 & 2032
- Figure 56: Middle East and Africa Gene Vector Market Volume (Billion), by Method 2024 & 2032
- Figure 57: Middle East and Africa Gene Vector Market Revenue Share (%), by Method 2024 & 2032
- Figure 58: Middle East and Africa Gene Vector Market Volume Share (%), by Method 2024 & 2032
- Figure 59: Middle East and Africa Gene Vector Market Revenue (Million), by End User 2024 & 2032
- Figure 60: Middle East and Africa Gene Vector Market Volume (Billion), by End User 2024 & 2032
- Figure 61: Middle East and Africa Gene Vector Market Revenue Share (%), by End User 2024 & 2032
- Figure 62: Middle East and Africa Gene Vector Market Volume Share (%), by End User 2024 & 2032
- Figure 63: Middle East and Africa Gene Vector Market Revenue (Million), by Country 2024 & 2032
- Figure 64: Middle East and Africa Gene Vector Market Volume (Billion), by Country 2024 & 2032
- Figure 65: Middle East and Africa Gene Vector Market Revenue Share (%), by Country 2024 & 2032
- Figure 66: Middle East and Africa Gene Vector Market Volume Share (%), by Country 2024 & 2032
- Figure 67: South America Gene Vector Market Revenue (Million), by Product Type 2024 & 2032
- Figure 68: South America Gene Vector Market Volume (Billion), by Product Type 2024 & 2032
- Figure 69: South America Gene Vector Market Revenue Share (%), by Product Type 2024 & 2032
- Figure 70: South America Gene Vector Market Volume Share (%), by Product Type 2024 & 2032
- Figure 71: South America Gene Vector Market Revenue (Million), by Method 2024 & 2032
- Figure 72: South America Gene Vector Market Volume (Billion), by Method 2024 & 2032
- Figure 73: South America Gene Vector Market Revenue Share (%), by Method 2024 & 2032
- Figure 74: South America Gene Vector Market Volume Share (%), by Method 2024 & 2032
- Figure 75: South America Gene Vector Market Revenue (Million), by End User 2024 & 2032
- Figure 76: South America Gene Vector Market Volume (Billion), by End User 2024 & 2032
- Figure 77: South America Gene Vector Market Revenue Share (%), by End User 2024 & 2032
- Figure 78: South America Gene Vector Market Volume Share (%), by End User 2024 & 2032
- Figure 79: South America Gene Vector Market Revenue (Million), by Country 2024 & 2032
- Figure 80: South America Gene Vector Market Volume (Billion), by Country 2024 & 2032
- Figure 81: South America Gene Vector Market Revenue Share (%), by Country 2024 & 2032
- Figure 82: South America Gene Vector Market Volume Share (%), by Country 2024 & 2032
List of Tables
- Table 1: Global Gene Vector Market Revenue Million Forecast, by Region 2019 & 2032
- Table 2: Global Gene Vector Market Volume Billion Forecast, by Region 2019 & 2032
- Table 3: Global Gene Vector Market Revenue Million Forecast, by Product Type 2019 & 2032
- Table 4: Global Gene Vector Market Volume Billion Forecast, by Product Type 2019 & 2032
- Table 5: Global Gene Vector Market Revenue Million Forecast, by Method 2019 & 2032
- Table 6: Global Gene Vector Market Volume Billion Forecast, by Method 2019 & 2032
- Table 7: Global Gene Vector Market Revenue Million Forecast, by End User 2019 & 2032
- Table 8: Global Gene Vector Market Volume Billion Forecast, by End User 2019 & 2032
- Table 9: Global Gene Vector Market Revenue Million Forecast, by Region 2019 & 2032
- Table 10: Global Gene Vector Market Volume Billion Forecast, by Region 2019 & 2032
- Table 11: Global Gene Vector Market Revenue Million Forecast, by Product Type 2019 & 2032
- Table 12: Global Gene Vector Market Volume Billion Forecast, by Product Type 2019 & 2032
- Table 13: Global Gene Vector Market Revenue Million Forecast, by Method 2019 & 2032
- Table 14: Global Gene Vector Market Volume Billion Forecast, by Method 2019 & 2032
- Table 15: Global Gene Vector Market Revenue Million Forecast, by End User 2019 & 2032
- Table 16: Global Gene Vector Market Volume Billion Forecast, by End User 2019 & 2032
- Table 17: Global Gene Vector Market Revenue Million Forecast, by Country 2019 & 2032
- Table 18: Global Gene Vector Market Volume Billion Forecast, by Country 2019 & 2032
- Table 19: United States Gene Vector Market Revenue (Million) Forecast, by Application 2019 & 2032
- Table 20: United States Gene Vector Market Volume (Billion) Forecast, by Application 2019 & 2032
- Table 21: Canada Gene Vector Market Revenue (Million) Forecast, by Application 2019 & 2032
- Table 22: Canada Gene Vector Market Volume (Billion) Forecast, by Application 2019 & 2032
- Table 23: Mexico Gene Vector Market Revenue (Million) Forecast, by Application 2019 & 2032
- Table 24: Mexico Gene Vector Market Volume (Billion) Forecast, by Application 2019 & 2032
- Table 25: Global Gene Vector Market Revenue Million Forecast, by Product Type 2019 & 2032
- Table 26: Global Gene Vector Market Volume Billion Forecast, by Product Type 2019 & 2032
- Table 27: Global Gene Vector Market Revenue Million Forecast, by Method 2019 & 2032
- Table 28: Global Gene Vector Market Volume Billion Forecast, by Method 2019 & 2032
- Table 29: Global Gene Vector Market Revenue Million Forecast, by End User 2019 & 2032
- Table 30: Global Gene Vector Market Volume Billion Forecast, by End User 2019 & 2032
- Table 31: Global Gene Vector Market Revenue Million Forecast, by Country 2019 & 2032
- Table 32: Global Gene Vector Market Volume Billion Forecast, by Country 2019 & 2032
- Table 33: Germany Gene Vector Market Revenue (Million) Forecast, by Application 2019 & 2032
- Table 34: Germany Gene Vector Market Volume (Billion) Forecast, by Application 2019 & 2032
- Table 35: United Kingdom Gene Vector Market Revenue (Million) Forecast, by Application 2019 & 2032
- Table 36: United Kingdom Gene Vector Market Volume (Billion) Forecast, by Application 2019 & 2032
- Table 37: France Gene Vector Market Revenue (Million) Forecast, by Application 2019 & 2032
- Table 38: France Gene Vector Market Volume (Billion) Forecast, by Application 2019 & 2032
- Table 39: Italy Gene Vector Market Revenue (Million) Forecast, by Application 2019 & 2032
- Table 40: Italy Gene Vector Market Volume (Billion) Forecast, by Application 2019 & 2032
- Table 41: Spain Gene Vector Market Revenue (Million) Forecast, by Application 2019 & 2032
- Table 42: Spain Gene Vector Market Volume (Billion) Forecast, by Application 2019 & 2032
- Table 43: Rest of Europe Gene Vector Market Revenue (Million) Forecast, by Application 2019 & 2032
- Table 44: Rest of Europe Gene Vector Market Volume (Billion) Forecast, by Application 2019 & 2032
- Table 45: Global Gene Vector Market Revenue Million Forecast, by Product Type 2019 & 2032
- Table 46: Global Gene Vector Market Volume Billion Forecast, by Product Type 2019 & 2032
- Table 47: Global Gene Vector Market Revenue Million Forecast, by Method 2019 & 2032
- Table 48: Global Gene Vector Market Volume Billion Forecast, by Method 2019 & 2032
- Table 49: Global Gene Vector Market Revenue Million Forecast, by End User 2019 & 2032
- Table 50: Global Gene Vector Market Volume Billion Forecast, by End User 2019 & 2032
- Table 51: Global Gene Vector Market Revenue Million Forecast, by Country 2019 & 2032
- Table 52: Global Gene Vector Market Volume Billion Forecast, by Country 2019 & 2032
- Table 53: China Gene Vector Market Revenue (Million) Forecast, by Application 2019 & 2032
- Table 54: China Gene Vector Market Volume (Billion) Forecast, by Application 2019 & 2032
- Table 55: Japan Gene Vector Market Revenue (Million) Forecast, by Application 2019 & 2032
- Table 56: Japan Gene Vector Market Volume (Billion) Forecast, by Application 2019 & 2032
- Table 57: India Gene Vector Market Revenue (Million) Forecast, by Application 2019 & 2032
- Table 58: India Gene Vector Market Volume (Billion) Forecast, by Application 2019 & 2032
- Table 59: Australia Gene Vector Market Revenue (Million) Forecast, by Application 2019 & 2032
- Table 60: Australia Gene Vector Market Volume (Billion) Forecast, by Application 2019 & 2032
- Table 61: South Korea Gene Vector Market Revenue (Million) Forecast, by Application 2019 & 2032
- Table 62: South Korea Gene Vector Market Volume (Billion) Forecast, by Application 2019 & 2032
- Table 63: Rest of Asia Pacific Gene Vector Market Revenue (Million) Forecast, by Application 2019 & 2032
- Table 64: Rest of Asia Pacific Gene Vector Market Volume (Billion) Forecast, by Application 2019 & 2032
- Table 65: Global Gene Vector Market Revenue Million Forecast, by Product Type 2019 & 2032
- Table 66: Global Gene Vector Market Volume Billion Forecast, by Product Type 2019 & 2032
- Table 67: Global Gene Vector Market Revenue Million Forecast, by Method 2019 & 2032
- Table 68: Global Gene Vector Market Volume Billion Forecast, by Method 2019 & 2032
- Table 69: Global Gene Vector Market Revenue Million Forecast, by End User 2019 & 2032
- Table 70: Global Gene Vector Market Volume Billion Forecast, by End User 2019 & 2032
- Table 71: Global Gene Vector Market Revenue Million Forecast, by Country 2019 & 2032
- Table 72: Global Gene Vector Market Volume Billion Forecast, by Country 2019 & 2032
- Table 73: GCC Gene Vector Market Revenue (Million) Forecast, by Application 2019 & 2032
- Table 74: GCC Gene Vector Market Volume (Billion) Forecast, by Application 2019 & 2032
- Table 75: South Africa Gene Vector Market Revenue (Million) Forecast, by Application 2019 & 2032
- Table 76: South Africa Gene Vector Market Volume (Billion) Forecast, by Application 2019 & 2032
- Table 77: Rest of Middle East and Africa Gene Vector Market Revenue (Million) Forecast, by Application 2019 & 2032
- Table 78: Rest of Middle East and Africa Gene Vector Market Volume (Billion) Forecast, by Application 2019 & 2032
- Table 79: Global Gene Vector Market Revenue Million Forecast, by Product Type 2019 & 2032
- Table 80: Global Gene Vector Market Volume Billion Forecast, by Product Type 2019 & 2032
- Table 81: Global Gene Vector Market Revenue Million Forecast, by Method 2019 & 2032
- Table 82: Global Gene Vector Market Volume Billion Forecast, by Method 2019 & 2032
- Table 83: Global Gene Vector Market Revenue Million Forecast, by End User 2019 & 2032
- Table 84: Global Gene Vector Market Volume Billion Forecast, by End User 2019 & 2032
- Table 85: Global Gene Vector Market Revenue Million Forecast, by Country 2019 & 2032
- Table 86: Global Gene Vector Market Volume Billion Forecast, by Country 2019 & 2032
- Table 87: Brazil Gene Vector Market Revenue (Million) Forecast, by Application 2019 & 2032
- Table 88: Brazil Gene Vector Market Volume (Billion) Forecast, by Application 2019 & 2032
- Table 89: Argentina Gene Vector Market Revenue (Million) Forecast, by Application 2019 & 2032
- Table 90: Argentina Gene Vector Market Volume (Billion) Forecast, by Application 2019 & 2032
- Table 91: Rest of South America Gene Vector Market Revenue (Million) Forecast, by Application 2019 & 2032
- Table 92: Rest of South America Gene Vector Market Volume (Billion) Forecast, by Application 2019 & 2032
Frequently Asked Questions
1. What is the projected Compound Annual Growth Rate (CAGR) of the Gene Vector Market?
The projected CAGR is approximately 12.45%.
2. Which companies are prominent players in the Gene Vector Market?
Key companies in the market include Abbott Laboratories, Becton Dickinson & Company, bioMerieux SA, Bruker Corporation, Charles River, Danaher Corporation, Merck KGaA, Sartorius Group, Shimadzu Corporation, Thermo Fisher Scientific*List Not Exhaustive.
3. What are the main segments of the Gene Vector Market?
The market segments include Product Type, Method, End User.
4. Can you provide details about the market size?
The market size is estimated to be USD 1.68 Million as of 2022.
5. What are some drivers contributing to market growth?
Rising Number of Infectious Diseases; Increasing Adoption by Food & Beverage Industry; Growing Government Initiatives.
6. What are the notable trends driving market growth?
The Segment for Cancer is Expected to Witness Substantial Growth Over the Forecast Period.
7. Are there any restraints impacting market growth?
Rising Number of Infectious Diseases; Increasing Adoption by Food & Beverage Industry; Growing Government Initiatives.
8. Can you provide examples of recent developments in the market?
April 2024: Ring Therapeutics successfully delivered a viral gene to the retinas of mice. The viral gene vector was developed using the company's Anellogy platform and was based on the human anellovirus.
9. What pricing options are available for accessing the report?
Pricing options include single-user, multi-user, and enterprise licenses priced at USD 4750, USD 5250, and USD 8750 respectively.
10. Is the market size provided in terms of value or volume?
The market size is provided in terms of value, measured in Million and volume, measured in Billion.
11. Are there any specific market keywords associated with the report?
Yes, the market keyword associated with the report is "Gene Vector Market," which aids in identifying and referencing the specific market segment covered.
12. How do I determine which pricing option suits my needs best?
The pricing options vary based on user requirements and access needs. Individual users may opt for single-user licenses, while businesses requiring broader access may choose multi-user or enterprise licenses for cost-effective access to the report.
13. Are there any additional resources or data provided in the Gene Vector Market report?
While the report offers comprehensive insights, it's advisable to review the specific contents or supplementary materials provided to ascertain if additional resources or data are available.
14. How can I stay updated on further developments or reports in the Gene Vector Market?
To stay informed about further developments, trends, and reports in the Gene Vector Market, consider subscribing to industry newsletters, following relevant companies and organizations, or regularly checking reputable industry news sources and publications.
Methodology
Step 1 - Identification of Relevant Samples Size from Population Database


Step 2 - Approaches for Defining Global Market Size (Value, Volume* & Price*)

Note*: In applicable scenarios
Step 3 - Data Sources
Primary Research
- Web Analytics
- Survey Reports
- Research Institute
- Latest Research Reports
- Opinion Leaders
Secondary Research
- Annual Reports
- White Paper
- Latest Press Release
- Industry Association
- Paid Database
- Investor Presentations

Step 4 - Data Triangulation
Involves using different sources of information in order to increase the validity of a study
These sources are likely to be stakeholders in a program - participants, other researchers, program staff, other community members, and so on.
Then we put all data in single framework & apply various statistical tools to find out the dynamic on the market.
During the analysis stage, feedback from the stakeholder groups would be compared to determine areas of agreement as well as areas of divergence


