

Key Insights
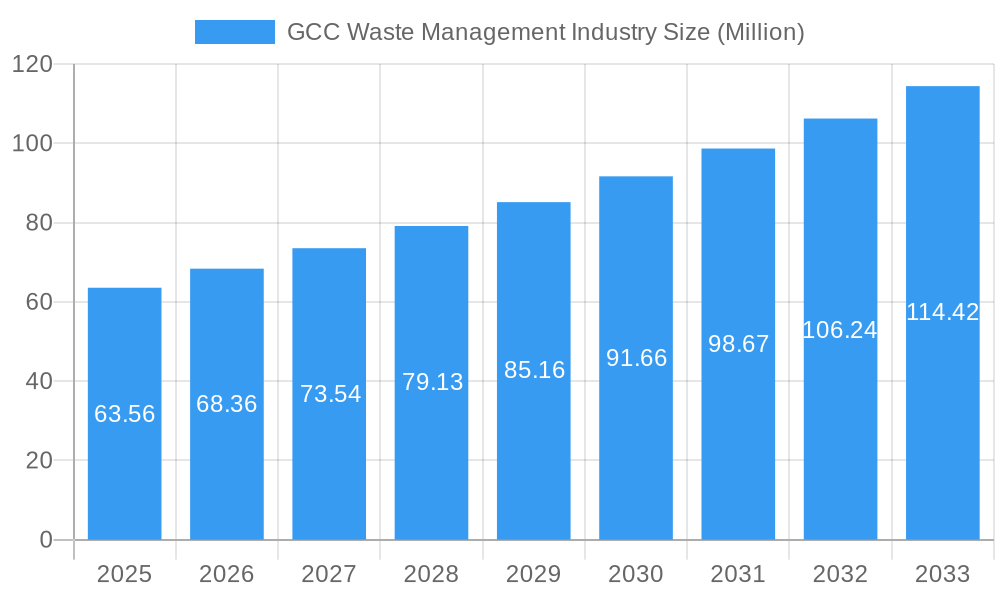
The GCC waste management market, valued at $63.56 million in 2025, is projected to experience robust growth, driven by increasing urbanization, stringent government regulations promoting sustainable waste disposal, and rising environmental awareness among citizens. The 7.38% CAGR from 2025 to 2033 signifies a significant expansion, fueled by the region's economic development and increasing generation of both municipal and industrial waste. Key drivers include the implementation of integrated waste management strategies, growing adoption of advanced technologies like waste-to-energy solutions, and increasing private sector investment in recycling and resource recovery initiatives. The market is segmented by waste type (municipal solid waste, industrial waste, hazardous waste, etc.), treatment methods (landfilling, incineration, recycling, composting), and service type (collection, processing, disposal). Competition is intense, with both international players like Suez, Veolia, and Averda, and local companies like Bee'ah and Dulsco, vying for market share. Challenges include the relatively low recycling rates compared to global averages and the need for greater public participation in waste segregation and responsible disposal. Furthermore, infrastructural limitations in some areas and the high cost of implementing advanced waste management technologies could potentially constrain growth.
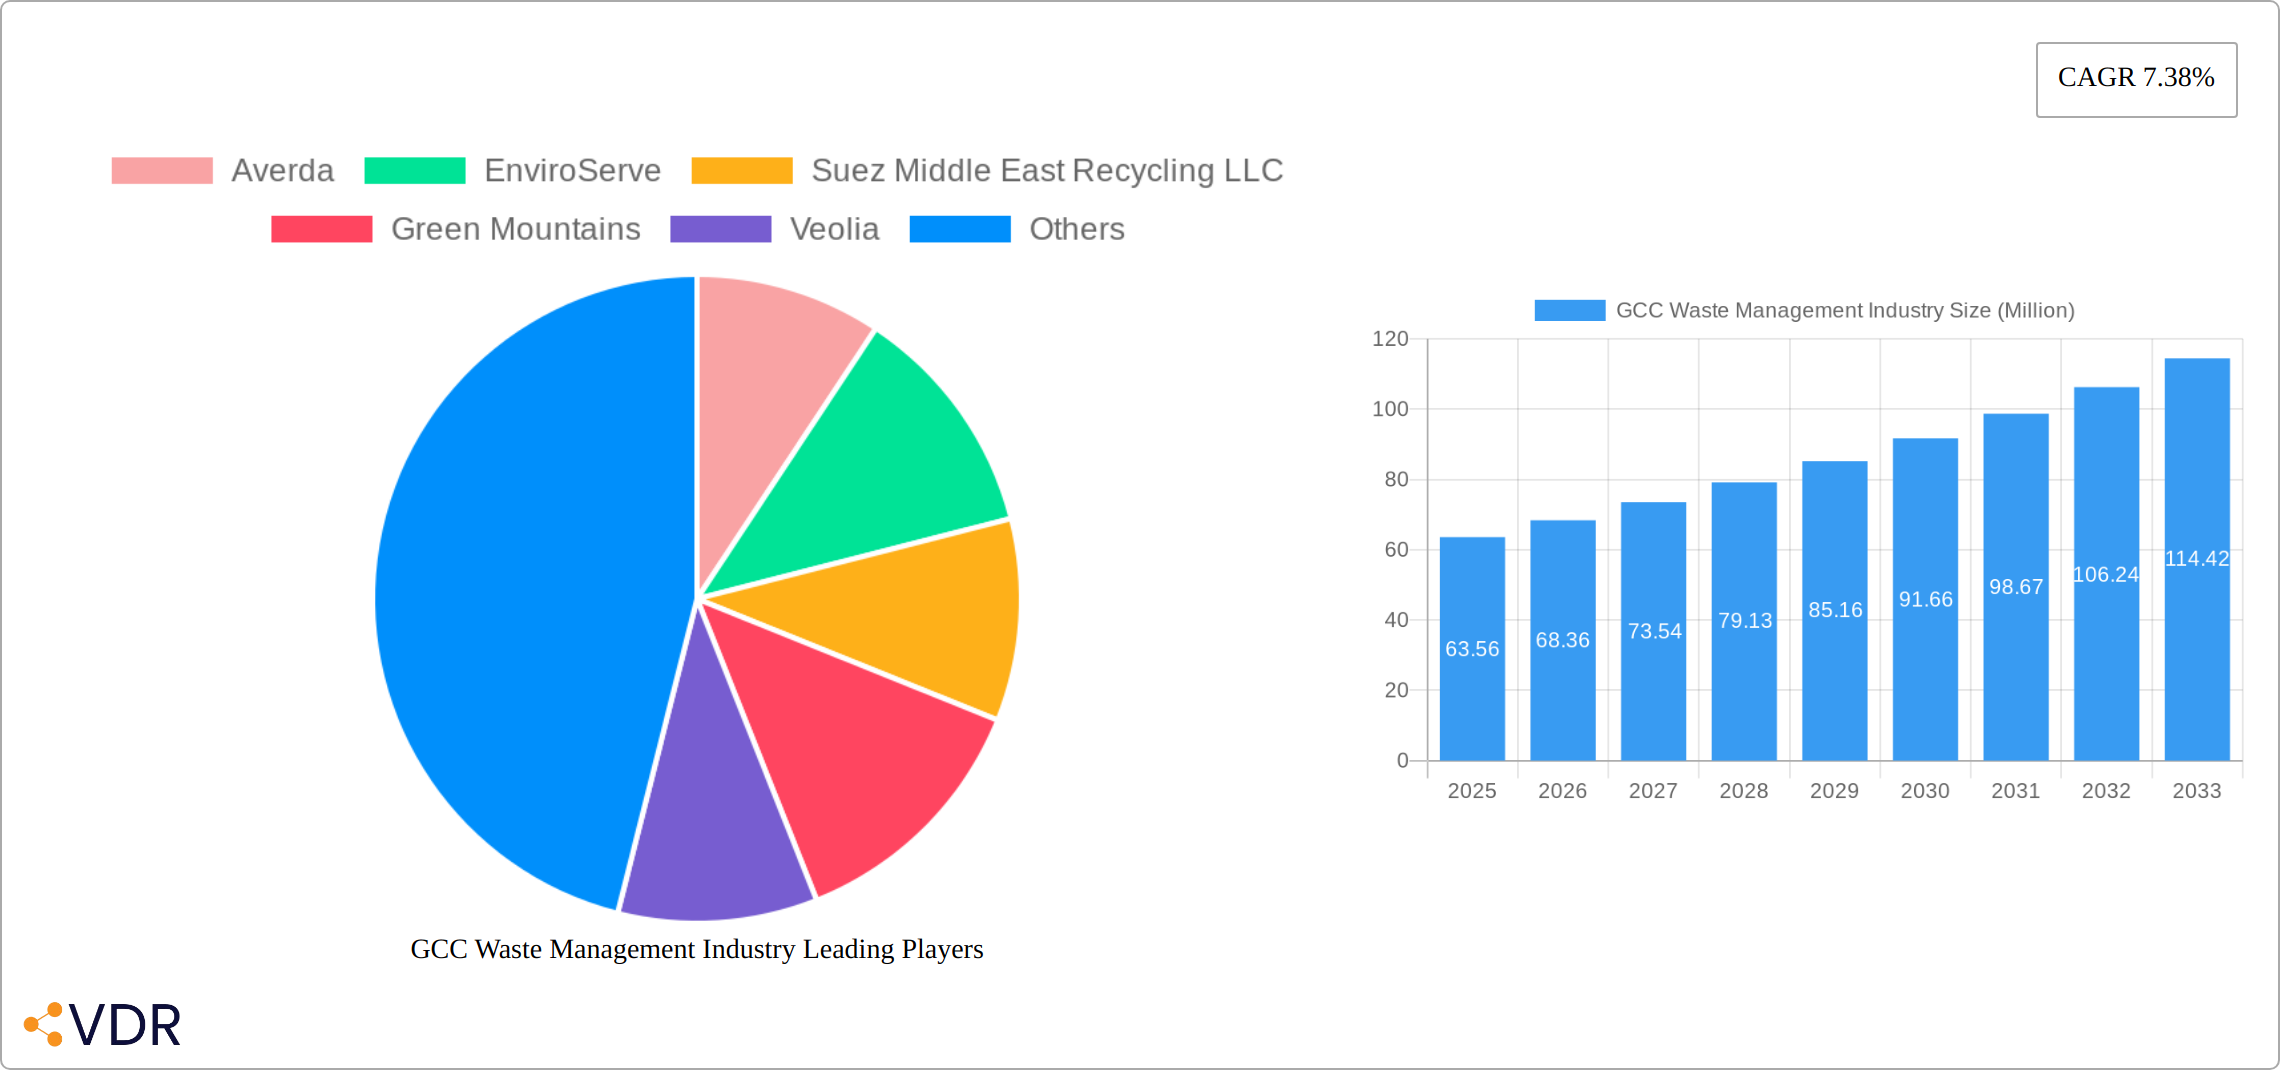
GCC Waste Management Industry Market Size (In Million)
The forecast period (2025-2033) will witness significant shifts as the region prioritizes sustainable waste management practices. Technological advancements in waste-to-energy conversion and smart waste management systems will play a crucial role. Growth will vary across GCC nations, with countries investing heavily in infrastructure and regulatory frameworks likely experiencing faster growth rates. The success of the market will hinge on continued government support, public awareness campaigns emphasizing recycling and waste reduction, and the adoption of innovative technologies to optimize resource utilization and minimize environmental impact. Opportunities exist for companies offering specialized waste management services, particularly in the areas of e-waste recycling and hazardous waste management.
GCC Waste Management Industry Company Market Share
GCC Waste Management Industry: A Comprehensive Market Report (2019-2033)
This comprehensive report provides an in-depth analysis of the GCC waste management industry, encompassing market dynamics, growth trends, key players, and future outlook. The study period covers 2019-2033, with 2025 as the base and estimated year. The report leverages extensive primary and secondary research to deliver actionable insights for industry professionals, investors, and stakeholders. The parent market is the broader Middle East and North Africa (MENA) region's waste management sector, while the child market focuses specifically on the six GCC nations (Bahrain, Kuwait, Oman, Qatar, Saudi Arabia, and the UAE). The total market size in 2025 is estimated at XX Million.
GCC Waste Management Industry Market Dynamics & Structure
The GCC waste management market is characterized by a moderately concentrated landscape with a mix of international and local players. Market concentration is influenced by government contracts and the scale of operations required for large-scale waste management projects. Technological innovation is driven by the need to improve efficiency, reduce environmental impact, and meet increasingly stringent regulatory requirements.
- Market Concentration: The top 5 players hold an estimated XX% market share in 2025.
- Technological Innovation: Focus on AI-powered waste sorting, advanced recycling technologies, and sustainable waste-to-energy solutions.
- Regulatory Framework: Stringent environmental regulations and government initiatives promoting sustainable waste management are key drivers.
- Competitive Product Substitutes: Limited direct substitutes but increasing competition from companies offering integrated waste management services.
- End-User Demographics: Growing urbanization and population density drive demand, particularly in densely populated urban centers.
- M&A Trends: Consolidation is expected to continue, with larger players acquiring smaller companies to expand their geographical reach and service offerings. An estimated XX M&A deals occurred between 2019 and 2024.
GCC Waste Management Industry Growth Trends & Insights
The GCC waste management market is experiencing robust and dynamic growth, fueled by a confluence of factors including rapid urbanization, escalating environmental consciousness, and increasingly supportive governmental policies. The market size is on a trajectory for significant expansion, with projections indicating it will reach an estimated XX Million by 2033. This translates to a healthy Compound Annual Growth Rate (CAGR) of XX% during the forecast period (2025-2033). Technological innovations are proving to be significant catalysts, with the adoption of smart waste management solutions and advanced recycling technologies accelerating market development. Furthermore, evolving consumer behaviors, marked by a greater emphasis on recycling and waste reduction, are playing a crucial role. The current penetration of advanced waste management technologies is still relatively nascent, presenting substantial untapped growth potential and opportunities for early adopters.
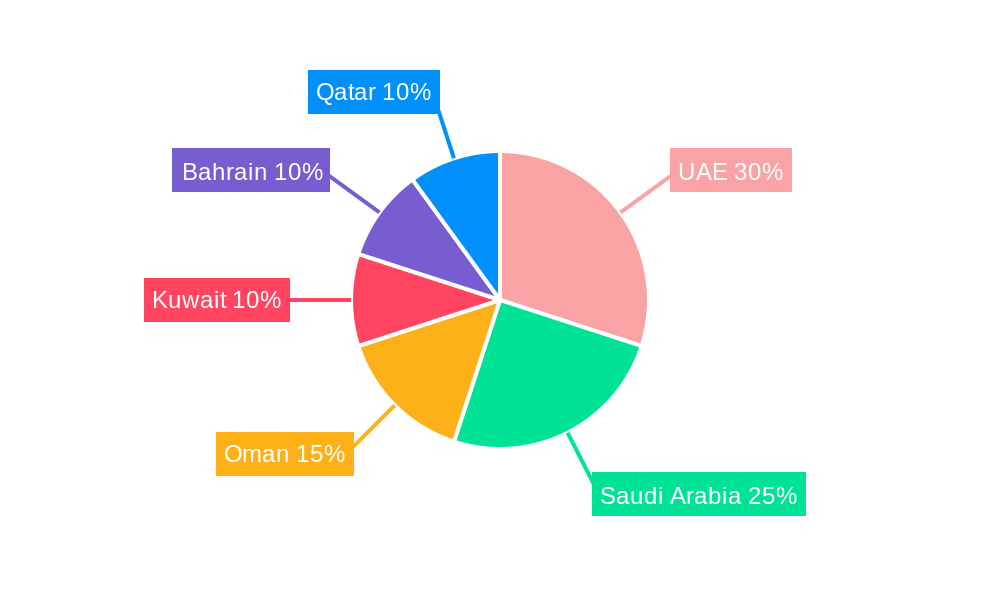
Dominant Regions, Countries, or Segments in GCC Waste Management Industry
The United Arab Emirates (UAE) and Saudi Arabia stand out as the leading markets within the GCC waste management landscape. This dominance is attributed to their larger populations, robust economic activity, and substantial investments in state-of-the-art infrastructure development. These nations are spearheading market growth through a combination of favorable regulatory frameworks, strong private sector engagement, and a pronounced commitment to sustainability initiatives.
- Key Drivers of Dominance:
- Proactive Government Initiatives: A steadfast commitment from governments towards sustainable development and environmental protection is a primary driver.
- Sustained Economic Growth: High GDP growth rates directly correlate with increased waste generation and consequently, higher expenditure on effective waste management solutions.
- Expansive Infrastructure Development: Significant capital is being channeled into developing advanced waste management infrastructure, including modern treatment plants and sophisticated recycling facilities.
- Factors Contributing to Dominance: The sheer market size, higher per capita waste generation, and substantial investments in Public-Private Partnerships (PPPs) in the UAE and Saudi Arabia solidify their leadership. The UAE's ambitious smart city initiatives further amplify its influence in adopting and implementing cutting-edge waste management solutions.
GCC Waste Management Industry Product Landscape
The GCC waste management industry offers a range of products and services, including collection, transportation, treatment, recycling, and disposal solutions. Recent innovations include the deployment of smart bins, optimized waste routing algorithms, and advanced recycling technologies that enhance efficiency and sustainability. These technologies offer unique selling propositions by reducing operational costs, improving resource recovery rates, and minimizing environmental impact.
Key Drivers, Barriers & Challenges in GCC Waste Management Industry
Key Drivers:
- Stringent Government Regulations: The implementation of robust environmental regulations mandating comprehensive waste management practices is a significant catalyst.
- Heightened Environmental Awareness: A growing public consciousness regarding the critical importance of effective waste management is fostering greater adoption of sustainable practices.
- Technological Advancements: Continuous innovation in waste management technologies is leading to improvements in efficiency, sustainability, and cost-effectiveness.
Challenges:
- High Infrastructure Investment: The development of modern waste management infrastructure necessitates substantial upfront capital investment.
- Enhancing Public Engagement: There remains a pressing need to bolster public participation in recycling programs and waste reduction initiatives through improved awareness and accessibility.
- Supply Chain Volatility: Potential disruptions in the supply chain for essential equipment and materials can impact project timelines and costs. The estimated financial impact of these disruptions on lost revenue in 2024 was XX Million.
Emerging Opportunities in GCC Waste Management Industry
- Waste-to-Energy (WtE): There is immense potential for developing and scaling up waste-to-energy projects, contributing to renewable energy generation and reducing landfill dependency.
- Advanced Organic Waste Recycling: The increasing demand for sustainable solutions for organic waste is creating significant opportunities for composting and anaerobic digestion facilities.
- Innovative Plastic Recycling Solutions: The drive towards a circular economy presents substantial opportunities for the deployment of cutting-edge technologies to enhance plastic recycling rates and create valuable secondary materials.
Growth Accelerators in the GCC Waste Management Industry Industry
Technological breakthroughs, particularly in AI-powered waste management and advanced recycling, are driving growth. Strategic partnerships between private companies and government entities are crucial for infrastructure development. Expansion into new markets and service offerings, such as waste-to-energy and organic waste management, will unlock further growth potential.
Key Players Shaping the GCC Waste Management Industry Market
- Averda
- EnviroServe
- Suez Middle East Recycling LLC
- Green Mountains
- Veolia
- Blue LLC
- Envac
- SEPCO Environment
- Wasco
- Saudi Investment Recycling Company
- Dulsco Waste Management Services
- Bee'ah
- Power Waste Management and Transport LLC
- Al Haya Enviro
- Bin-Ovation
- United Waste Management Company
- Kuwait Waste Collection and Recycling Company
- List Not Exhaustive
Notable Milestones in GCC Waste Management Industry Sector
- December 2023: Wardwizard Innovations and Mobility announced a strategic partnership with BEEAH Group, aimed at promoting electric vehicles across the GCC and Africa. This collaboration is expected to have a positive ripple effect on the industry's sustainability efforts.
- October 2022: Marafiq marked a significant step forward with the commencement of construction for a new sewage treatment plant at Jeddah Airport II. This project is set to increase treatment capacity by an impressive 300,000 m3/d.
- September 2022: Ashghal awarded a substantial USD 1.48 billion contract for the development of a new sewage treatment facility in Qatar, underscoring the region's commitment to major infrastructure investments in waste management.
In-Depth GCC Waste Management Industry Market Outlook
The GCC waste management market holds significant long-term growth potential driven by ongoing urbanization, increasing environmental awareness, and supportive government policies. Strategic investments in advanced technologies, coupled with public-private partnerships, will be crucial for unlocking the full market potential. Opportunities exist in waste-to-energy, organic waste recycling, and innovative plastic recycling solutions. The market is poised for further consolidation as larger players seek to expand their market share and service offerings.
GCC Waste Management Industry Segmentation
-
1. Waste Type
- 1.1. Industrial Waste
- 1.2. Municipal Solid Waste
- 1.3. Hazardous Waste
- 1.4. E-Waste
- 1.5. Plastic Waste
- 1.6. Bio-Medical Waste
-
2. Disposal Method
- 2.1. Collection
- 2.2. Landfills
- 2.3. Incineration
- 2.4. Recycling
GCC Waste Management Industry Segmentation By Geography
-
1. North America
- 1.1. United States
- 1.2. Canada
- 1.3. Mexico
-
2. South America
- 2.1. Brazil
- 2.2. Argentina
- 2.3. Rest of South America
-
3. Europe
- 3.1. United Kingdom
- 3.2. Germany
- 3.3. France
- 3.4. Italy
- 3.5. Spain
- 3.6. Russia
- 3.7. Benelux
- 3.8. Nordics
- 3.9. Rest of Europe
-
4. Middle East & Africa
- 4.1. Turkey
- 4.2. Israel
- 4.3. GCC
- 4.4. North Africa
- 4.5. South Africa
- 4.6. Rest of Middle East & Africa
-
5. Asia Pacific
- 5.1. China
- 5.2. India
- 5.3. Japan
- 5.4. South Korea
- 5.5. ASEAN
- 5.6. Oceania
- 5.7. Rest of Asia Pacific
GCC Waste Management Industry Regional Market Share
Geographic Coverage of GCC Waste Management Industry
GCC Waste Management Industry REPORT HIGHLIGHTS
| Aspects | Details |
|---|---|
| Study Period | 2020-2034 |
| Base Year | 2025 |
| Estimated Year | 2026 |
| Forecast Period | 2026-2034 |
| Historical Period | 2020-2025 |
| Growth Rate | CAGR of 7.38% from 2020-2034 |
| Segmentation |
|
Table of Contents
- 1. Introduction
- 1.1. Research Scope
- 1.2. Market Segmentation
- 1.3. Research Objective
- 1.4. Definitions and Assumptions
- 2. Executive Summary
- 2.1. Market Snapshot
- 3. Market Dynamics
- 3.1. Market Drivers
- 3.2. Market Restrains
- 3.3. Market Trends
- 3.4. Market Opportunities
- 4. Market Factor Analysis
- 4.1. Porters Five Forces
- 4.1.1. Bargaining Power of Suppliers
- 4.1.2. Bargaining Power of Buyers
- 4.1.3. Threat of New Entrants
- 4.1.4. Threat of Substitutes
- 4.1.5. Competitive Rivalry
- 4.2. PESTEL analysis
- 4.3. BCG Analysis
- 4.3.1. Stars (High Growth, High Market Share)
- 4.3.2. Cash Cows (Low Growth, High Market Share)
- 4.3.3. Question Mark (High Growth, Low Market Share)
- 4.3.4. Dogs (Low Growth, Low Market Share)
- 4.4. Ansoff Matrix Analysis
- 4.5. Supply Chain Analysis
- 4.6. Regulatory Landscape
- 4.7. Current Market Potential and Opportunity Assessment (TAM–SAM–SOM Framework)
- 4.8. VDR Analyst Note
- 4.1. Porters Five Forces
- 5. Market Analysis, Insights and Forecast 2021-2033
- 5.1. Market Analysis, Insights and Forecast - by Waste Type
- 5.1.1. Industrial Waste
- 5.1.2. Municipal Solid Waste
- 5.1.3. Hazardous Waste
- 5.1.4. E-Waste
- 5.1.5. Plastic Waste
- 5.1.6. Bio-Medical Waste
- 5.2. Market Analysis, Insights and Forecast - by Disposal Method
- 5.2.1. Collection
- 5.2.2. Landfills
- 5.2.3. Incineration
- 5.2.4. Recycling
- 5.3. Market Analysis, Insights and Forecast - by Region
- 5.3.1. North America
- 5.3.2. South America
- 5.3.3. Europe
- 5.3.4. Middle East & Africa
- 5.3.5. Asia Pacific
- 5.1. Market Analysis, Insights and Forecast - by Waste Type
- 6. Global GCC Waste Management Industry Analysis, Insights and Forecast, 2021-2033
- 6.1. Market Analysis, Insights and Forecast - by Waste Type
- 6.1.1. Industrial Waste
- 6.1.2. Municipal Solid Waste
- 6.1.3. Hazardous Waste
- 6.1.4. E-Waste
- 6.1.5. Plastic Waste
- 6.1.6. Bio-Medical Waste
- 6.2. Market Analysis, Insights and Forecast - by Disposal Method
- 6.2.1. Collection
- 6.2.2. Landfills
- 6.2.3. Incineration
- 6.2.4. Recycling
- 6.1. Market Analysis, Insights and Forecast - by Waste Type
- 7. North America GCC Waste Management Industry Analysis, Insights and Forecast, 2021-2033
- 7.1. Market Analysis, Insights and Forecast - by Waste Type
- 7.1.1. Industrial Waste
- 7.1.2. Municipal Solid Waste
- 7.1.3. Hazardous Waste
- 7.1.4. E-Waste
- 7.1.5. Plastic Waste
- 7.1.6. Bio-Medical Waste
- 7.2. Market Analysis, Insights and Forecast - by Disposal Method
- 7.2.1. Collection
- 7.2.2. Landfills
- 7.2.3. Incineration
- 7.2.4. Recycling
- 7.1. Market Analysis, Insights and Forecast - by Waste Type
- 8. South America GCC Waste Management Industry Analysis, Insights and Forecast, 2021-2033
- 8.1. Market Analysis, Insights and Forecast - by Waste Type
- 8.1.1. Industrial Waste
- 8.1.2. Municipal Solid Waste
- 8.1.3. Hazardous Waste
- 8.1.4. E-Waste
- 8.1.5. Plastic Waste
- 8.1.6. Bio-Medical Waste
- 8.2. Market Analysis, Insights and Forecast - by Disposal Method
- 8.2.1. Collection
- 8.2.2. Landfills
- 8.2.3. Incineration
- 8.2.4. Recycling
- 8.1. Market Analysis, Insights and Forecast - by Waste Type
- 9. Europe GCC Waste Management Industry Analysis, Insights and Forecast, 2021-2033
- 9.1. Market Analysis, Insights and Forecast - by Waste Type
- 9.1.1. Industrial Waste
- 9.1.2. Municipal Solid Waste
- 9.1.3. Hazardous Waste
- 9.1.4. E-Waste
- 9.1.5. Plastic Waste
- 9.1.6. Bio-Medical Waste
- 9.2. Market Analysis, Insights and Forecast - by Disposal Method
- 9.2.1. Collection
- 9.2.2. Landfills
- 9.2.3. Incineration
- 9.2.4. Recycling
- 9.1. Market Analysis, Insights and Forecast - by Waste Type
- 10. Middle East & Africa GCC Waste Management Industry Analysis, Insights and Forecast, 2021-2033
- 10.1. Market Analysis, Insights and Forecast - by Waste Type
- 10.1.1. Industrial Waste
- 10.1.2. Municipal Solid Waste
- 10.1.3. Hazardous Waste
- 10.1.4. E-Waste
- 10.1.5. Plastic Waste
- 10.1.6. Bio-Medical Waste
- 10.2. Market Analysis, Insights and Forecast - by Disposal Method
- 10.2.1. Collection
- 10.2.2. Landfills
- 10.2.3. Incineration
- 10.2.4. Recycling
- 10.1. Market Analysis, Insights and Forecast - by Waste Type
- 11. Asia Pacific GCC Waste Management Industry Analysis, Insights and Forecast, 2021-2033
- 11.1. Market Analysis, Insights and Forecast - by Waste Type
- 11.1.1. Industrial Waste
- 11.1.2. Municipal Solid Waste
- 11.1.3. Hazardous Waste
- 11.1.4. E-Waste
- 11.1.5. Plastic Waste
- 11.1.6. Bio-Medical Waste
- 11.2. Market Analysis, Insights and Forecast - by Disposal Method
- 11.2.1. Collection
- 11.2.2. Landfills
- 11.2.3. Incineration
- 11.2.4. Recycling
- 11.1. Market Analysis, Insights and Forecast - by Waste Type
- 12. Competitive Analysis
- 12.1. Company Profiles
- 12.1.1 Averda
- 12.1.1.1. Company Overview
- 12.1.1.2. Products
- 12.1.1.3. Company Financials
- 12.1.1.4. SWOT Analysis
- 12.1.2 EnviroServe
- 12.1.2.1. Company Overview
- 12.1.2.2. Products
- 12.1.2.3. Company Financials
- 12.1.2.4. SWOT Analysis
- 12.1.3 Suez Middle East Recycling LLC
- 12.1.3.1. Company Overview
- 12.1.3.2. Products
- 12.1.3.3. Company Financials
- 12.1.3.4. SWOT Analysis
- 12.1.4 Green Mountains
- 12.1.4.1. Company Overview
- 12.1.4.2. Products
- 12.1.4.3. Company Financials
- 12.1.4.4. SWOT Analysis
- 12.1.5 Veolia
- 12.1.5.1. Company Overview
- 12.1.5.2. Products
- 12.1.5.3. Company Financials
- 12.1.5.4. SWOT Analysis
- 12.1.6 Blue LLC
- 12.1.6.1. Company Overview
- 12.1.6.2. Products
- 12.1.6.3. Company Financials
- 12.1.6.4. SWOT Analysis
- 12.1.7 Envac
- 12.1.7.1. Company Overview
- 12.1.7.2. Products
- 12.1.7.3. Company Financials
- 12.1.7.4. SWOT Analysis
- 12.1.8 SEPCO Environment
- 12.1.8.1. Company Overview
- 12.1.8.2. Products
- 12.1.8.3. Company Financials
- 12.1.8.4. SWOT Analysis
- 12.1.9 Wasco
- 12.1.9.1. Company Overview
- 12.1.9.2. Products
- 12.1.9.3. Company Financials
- 12.1.9.4. SWOT Analysis
- 12.1.10 Saudi Investment Recycling Company
- 12.1.10.1. Company Overview
- 12.1.10.2. Products
- 12.1.10.3. Company Financials
- 12.1.10.4. SWOT Analysis
- 12.1.11 Dulsco Waste Management Services
- 12.1.11.1. Company Overview
- 12.1.11.2. Products
- 12.1.11.3. Company Financials
- 12.1.11.4. SWOT Analysis
- 12.1.12 Bee'ah
- 12.1.12.1. Company Overview
- 12.1.12.2. Products
- 12.1.12.3. Company Financials
- 12.1.12.4. SWOT Analysis
- 12.1.13 Power Waste Management and Transport LLC
- 12.1.13.1. Company Overview
- 12.1.13.2. Products
- 12.1.13.3. Company Financials
- 12.1.13.4. SWOT Analysis
- 12.1.14 Al Haya Enviro
- 12.1.14.1. Company Overview
- 12.1.14.2. Products
- 12.1.14.3. Company Financials
- 12.1.14.4. SWOT Analysis
- 12.1.15 Bin-Ovation
- 12.1.15.1. Company Overview
- 12.1.15.2. Products
- 12.1.15.3. Company Financials
- 12.1.15.4. SWOT Analysis
- 12.1.16 United Waste Management Company
- 12.1.16.1. Company Overview
- 12.1.16.2. Products
- 12.1.16.3. Company Financials
- 12.1.16.4. SWOT Analysis
- 12.1.17 Kuwait Waste Collection and Recycling Company**List Not Exhaustive
- 12.1.17.1. Company Overview
- 12.1.17.2. Products
- 12.1.17.3. Company Financials
- 12.1.17.4. SWOT Analysis
- 12.1.1 Averda
- 12.2. Market Entropy
- 12.2.1 Company's Key Areas Served
- 12.2.2 Recent Developments
- 12.3. Company Market Share Analysis 2025
- 12.3.1 Top 5 Companies Market Share Analysis
- 12.3.2 Top 3 Companies Market Share Analysis
- 12.4. List of Potential Customers
- 13. Research Methodology
List of Figures
- Figure 1: Global GCC Waste Management Industry Revenue Breakdown (Million, %) by Region 2025 & 2033
- Figure 2: Global GCC Waste Management Industry Volume Breakdown (Billion, %) by Region 2025 & 2033
- Figure 3: North America GCC Waste Management Industry Revenue (Million), by Waste Type 2025 & 2033
- Figure 4: North America GCC Waste Management Industry Volume (Billion), by Waste Type 2025 & 2033
- Figure 5: North America GCC Waste Management Industry Revenue Share (%), by Waste Type 2025 & 2033
- Figure 6: North America GCC Waste Management Industry Volume Share (%), by Waste Type 2025 & 2033
- Figure 7: North America GCC Waste Management Industry Revenue (Million), by Disposal Method 2025 & 2033
- Figure 8: North America GCC Waste Management Industry Volume (Billion), by Disposal Method 2025 & 2033
- Figure 9: North America GCC Waste Management Industry Revenue Share (%), by Disposal Method 2025 & 2033
- Figure 10: North America GCC Waste Management Industry Volume Share (%), by Disposal Method 2025 & 2033
- Figure 11: North America GCC Waste Management Industry Revenue (Million), by Country 2025 & 2033
- Figure 12: North America GCC Waste Management Industry Volume (Billion), by Country 2025 & 2033
- Figure 13: North America GCC Waste Management Industry Revenue Share (%), by Country 2025 & 2033
- Figure 14: North America GCC Waste Management Industry Volume Share (%), by Country 2025 & 2033
- Figure 15: South America GCC Waste Management Industry Revenue (Million), by Waste Type 2025 & 2033
- Figure 16: South America GCC Waste Management Industry Volume (Billion), by Waste Type 2025 & 2033
- Figure 17: South America GCC Waste Management Industry Revenue Share (%), by Waste Type 2025 & 2033
- Figure 18: South America GCC Waste Management Industry Volume Share (%), by Waste Type 2025 & 2033
- Figure 19: South America GCC Waste Management Industry Revenue (Million), by Disposal Method 2025 & 2033
- Figure 20: South America GCC Waste Management Industry Volume (Billion), by Disposal Method 2025 & 2033
- Figure 21: South America GCC Waste Management Industry Revenue Share (%), by Disposal Method 2025 & 2033
- Figure 22: South America GCC Waste Management Industry Volume Share (%), by Disposal Method 2025 & 2033
- Figure 23: South America GCC Waste Management Industry Revenue (Million), by Country 2025 & 2033
- Figure 24: South America GCC Waste Management Industry Volume (Billion), by Country 2025 & 2033
- Figure 25: South America GCC Waste Management Industry Revenue Share (%), by Country 2025 & 2033
- Figure 26: South America GCC Waste Management Industry Volume Share (%), by Country 2025 & 2033
- Figure 27: Europe GCC Waste Management Industry Revenue (Million), by Waste Type 2025 & 2033
- Figure 28: Europe GCC Waste Management Industry Volume (Billion), by Waste Type 2025 & 2033
- Figure 29: Europe GCC Waste Management Industry Revenue Share (%), by Waste Type 2025 & 2033
- Figure 30: Europe GCC Waste Management Industry Volume Share (%), by Waste Type 2025 & 2033
- Figure 31: Europe GCC Waste Management Industry Revenue (Million), by Disposal Method 2025 & 2033
- Figure 32: Europe GCC Waste Management Industry Volume (Billion), by Disposal Method 2025 & 2033
- Figure 33: Europe GCC Waste Management Industry Revenue Share (%), by Disposal Method 2025 & 2033
- Figure 34: Europe GCC Waste Management Industry Volume Share (%), by Disposal Method 2025 & 2033
- Figure 35: Europe GCC Waste Management Industry Revenue (Million), by Country 2025 & 2033
- Figure 36: Europe GCC Waste Management Industry Volume (Billion), by Country 2025 & 2033
- Figure 37: Europe GCC Waste Management Industry Revenue Share (%), by Country 2025 & 2033
- Figure 38: Europe GCC Waste Management Industry Volume Share (%), by Country 2025 & 2033
- Figure 39: Middle East & Africa GCC Waste Management Industry Revenue (Million), by Waste Type 2025 & 2033
- Figure 40: Middle East & Africa GCC Waste Management Industry Volume (Billion), by Waste Type 2025 & 2033
- Figure 41: Middle East & Africa GCC Waste Management Industry Revenue Share (%), by Waste Type 2025 & 2033
- Figure 42: Middle East & Africa GCC Waste Management Industry Volume Share (%), by Waste Type 2025 & 2033
- Figure 43: Middle East & Africa GCC Waste Management Industry Revenue (Million), by Disposal Method 2025 & 2033
- Figure 44: Middle East & Africa GCC Waste Management Industry Volume (Billion), by Disposal Method 2025 & 2033
- Figure 45: Middle East & Africa GCC Waste Management Industry Revenue Share (%), by Disposal Method 2025 & 2033
- Figure 46: Middle East & Africa GCC Waste Management Industry Volume Share (%), by Disposal Method 2025 & 2033
- Figure 47: Middle East & Africa GCC Waste Management Industry Revenue (Million), by Country 2025 & 2033
- Figure 48: Middle East & Africa GCC Waste Management Industry Volume (Billion), by Country 2025 & 2033
- Figure 49: Middle East & Africa GCC Waste Management Industry Revenue Share (%), by Country 2025 & 2033
- Figure 50: Middle East & Africa GCC Waste Management Industry Volume Share (%), by Country 2025 & 2033
- Figure 51: Asia Pacific GCC Waste Management Industry Revenue (Million), by Waste Type 2025 & 2033
- Figure 52: Asia Pacific GCC Waste Management Industry Volume (Billion), by Waste Type 2025 & 2033
- Figure 53: Asia Pacific GCC Waste Management Industry Revenue Share (%), by Waste Type 2025 & 2033
- Figure 54: Asia Pacific GCC Waste Management Industry Volume Share (%), by Waste Type 2025 & 2033
- Figure 55: Asia Pacific GCC Waste Management Industry Revenue (Million), by Disposal Method 2025 & 2033
- Figure 56: Asia Pacific GCC Waste Management Industry Volume (Billion), by Disposal Method 2025 & 2033
- Figure 57: Asia Pacific GCC Waste Management Industry Revenue Share (%), by Disposal Method 2025 & 2033
- Figure 58: Asia Pacific GCC Waste Management Industry Volume Share (%), by Disposal Method 2025 & 2033
- Figure 59: Asia Pacific GCC Waste Management Industry Revenue (Million), by Country 2025 & 2033
- Figure 60: Asia Pacific GCC Waste Management Industry Volume (Billion), by Country 2025 & 2033
- Figure 61: Asia Pacific GCC Waste Management Industry Revenue Share (%), by Country 2025 & 2033
- Figure 62: Asia Pacific GCC Waste Management Industry Volume Share (%), by Country 2025 & 2033
List of Tables
- Table 1: Global GCC Waste Management Industry Revenue Million Forecast, by Waste Type 2020 & 2033
- Table 2: Global GCC Waste Management Industry Volume Billion Forecast, by Waste Type 2020 & 2033
- Table 3: Global GCC Waste Management Industry Revenue Million Forecast, by Disposal Method 2020 & 2033
- Table 4: Global GCC Waste Management Industry Volume Billion Forecast, by Disposal Method 2020 & 2033
- Table 5: Global GCC Waste Management Industry Revenue Million Forecast, by Region 2020 & 2033
- Table 6: Global GCC Waste Management Industry Volume Billion Forecast, by Region 2020 & 2033
- Table 7: Global GCC Waste Management Industry Revenue Million Forecast, by Waste Type 2020 & 2033
- Table 8: Global GCC Waste Management Industry Volume Billion Forecast, by Waste Type 2020 & 2033
- Table 9: Global GCC Waste Management Industry Revenue Million Forecast, by Disposal Method 2020 & 2033
- Table 10: Global GCC Waste Management Industry Volume Billion Forecast, by Disposal Method 2020 & 2033
- Table 11: Global GCC Waste Management Industry Revenue Million Forecast, by Country 2020 & 2033
- Table 12: Global GCC Waste Management Industry Volume Billion Forecast, by Country 2020 & 2033
- Table 13: United States GCC Waste Management Industry Revenue (Million) Forecast, by Application 2020 & 2033
- Table 14: United States GCC Waste Management Industry Volume (Billion) Forecast, by Application 2020 & 2033
- Table 15: Canada GCC Waste Management Industry Revenue (Million) Forecast, by Application 2020 & 2033
- Table 16: Canada GCC Waste Management Industry Volume (Billion) Forecast, by Application 2020 & 2033
- Table 17: Mexico GCC Waste Management Industry Revenue (Million) Forecast, by Application 2020 & 2033
- Table 18: Mexico GCC Waste Management Industry Volume (Billion) Forecast, by Application 2020 & 2033
- Table 19: Global GCC Waste Management Industry Revenue Million Forecast, by Waste Type 2020 & 2033
- Table 20: Global GCC Waste Management Industry Volume Billion Forecast, by Waste Type 2020 & 2033
- Table 21: Global GCC Waste Management Industry Revenue Million Forecast, by Disposal Method 2020 & 2033
- Table 22: Global GCC Waste Management Industry Volume Billion Forecast, by Disposal Method 2020 & 2033
- Table 23: Global GCC Waste Management Industry Revenue Million Forecast, by Country 2020 & 2033
- Table 24: Global GCC Waste Management Industry Volume Billion Forecast, by Country 2020 & 2033
- Table 25: Brazil GCC Waste Management Industry Revenue (Million) Forecast, by Application 2020 & 2033
- Table 26: Brazil GCC Waste Management Industry Volume (Billion) Forecast, by Application 2020 & 2033
- Table 27: Argentina GCC Waste Management Industry Revenue (Million) Forecast, by Application 2020 & 2033
- Table 28: Argentina GCC Waste Management Industry Volume (Billion) Forecast, by Application 2020 & 2033
- Table 29: Rest of South America GCC Waste Management Industry Revenue (Million) Forecast, by Application 2020 & 2033
- Table 30: Rest of South America GCC Waste Management Industry Volume (Billion) Forecast, by Application 2020 & 2033
- Table 31: Global GCC Waste Management Industry Revenue Million Forecast, by Waste Type 2020 & 2033
- Table 32: Global GCC Waste Management Industry Volume Billion Forecast, by Waste Type 2020 & 2033
- Table 33: Global GCC Waste Management Industry Revenue Million Forecast, by Disposal Method 2020 & 2033
- Table 34: Global GCC Waste Management Industry Volume Billion Forecast, by Disposal Method 2020 & 2033
- Table 35: Global GCC Waste Management Industry Revenue Million Forecast, by Country 2020 & 2033
- Table 36: Global GCC Waste Management Industry Volume Billion Forecast, by Country 2020 & 2033
- Table 37: United Kingdom GCC Waste Management Industry Revenue (Million) Forecast, by Application 2020 & 2033
- Table 38: United Kingdom GCC Waste Management Industry Volume (Billion) Forecast, by Application 2020 & 2033
- Table 39: Germany GCC Waste Management Industry Revenue (Million) Forecast, by Application 2020 & 2033
- Table 40: Germany GCC Waste Management Industry Volume (Billion) Forecast, by Application 2020 & 2033
- Table 41: France GCC Waste Management Industry Revenue (Million) Forecast, by Application 2020 & 2033
- Table 42: France GCC Waste Management Industry Volume (Billion) Forecast, by Application 2020 & 2033
- Table 43: Italy GCC Waste Management Industry Revenue (Million) Forecast, by Application 2020 & 2033
- Table 44: Italy GCC Waste Management Industry Volume (Billion) Forecast, by Application 2020 & 2033
- Table 45: Spain GCC Waste Management Industry Revenue (Million) Forecast, by Application 2020 & 2033
- Table 46: Spain GCC Waste Management Industry Volume (Billion) Forecast, by Application 2020 & 2033
- Table 47: Russia GCC Waste Management Industry Revenue (Million) Forecast, by Application 2020 & 2033
- Table 48: Russia GCC Waste Management Industry Volume (Billion) Forecast, by Application 2020 & 2033
- Table 49: Benelux GCC Waste Management Industry Revenue (Million) Forecast, by Application 2020 & 2033
- Table 50: Benelux GCC Waste Management Industry Volume (Billion) Forecast, by Application 2020 & 2033
- Table 51: Nordics GCC Waste Management Industry Revenue (Million) Forecast, by Application 2020 & 2033
- Table 52: Nordics GCC Waste Management Industry Volume (Billion) Forecast, by Application 2020 & 2033
- Table 53: Rest of Europe GCC Waste Management Industry Revenue (Million) Forecast, by Application 2020 & 2033
- Table 54: Rest of Europe GCC Waste Management Industry Volume (Billion) Forecast, by Application 2020 & 2033
- Table 55: Global GCC Waste Management Industry Revenue Million Forecast, by Waste Type 2020 & 2033
- Table 56: Global GCC Waste Management Industry Volume Billion Forecast, by Waste Type 2020 & 2033
- Table 57: Global GCC Waste Management Industry Revenue Million Forecast, by Disposal Method 2020 & 2033
- Table 58: Global GCC Waste Management Industry Volume Billion Forecast, by Disposal Method 2020 & 2033
- Table 59: Global GCC Waste Management Industry Revenue Million Forecast, by Country 2020 & 2033
- Table 60: Global GCC Waste Management Industry Volume Billion Forecast, by Country 2020 & 2033
- Table 61: Turkey GCC Waste Management Industry Revenue (Million) Forecast, by Application 2020 & 2033
- Table 62: Turkey GCC Waste Management Industry Volume (Billion) Forecast, by Application 2020 & 2033
- Table 63: Israel GCC Waste Management Industry Revenue (Million) Forecast, by Application 2020 & 2033
- Table 64: Israel GCC Waste Management Industry Volume (Billion) Forecast, by Application 2020 & 2033
- Table 65: GCC GCC Waste Management Industry Revenue (Million) Forecast, by Application 2020 & 2033
- Table 66: GCC GCC Waste Management Industry Volume (Billion) Forecast, by Application 2020 & 2033
- Table 67: North Africa GCC Waste Management Industry Revenue (Million) Forecast, by Application 2020 & 2033
- Table 68: North Africa GCC Waste Management Industry Volume (Billion) Forecast, by Application 2020 & 2033
- Table 69: South Africa GCC Waste Management Industry Revenue (Million) Forecast, by Application 2020 & 2033
- Table 70: South Africa GCC Waste Management Industry Volume (Billion) Forecast, by Application 2020 & 2033
- Table 71: Rest of Middle East & Africa GCC Waste Management Industry Revenue (Million) Forecast, by Application 2020 & 2033
- Table 72: Rest of Middle East & Africa GCC Waste Management Industry Volume (Billion) Forecast, by Application 2020 & 2033
- Table 73: Global GCC Waste Management Industry Revenue Million Forecast, by Waste Type 2020 & 2033
- Table 74: Global GCC Waste Management Industry Volume Billion Forecast, by Waste Type 2020 & 2033
- Table 75: Global GCC Waste Management Industry Revenue Million Forecast, by Disposal Method 2020 & 2033
- Table 76: Global GCC Waste Management Industry Volume Billion Forecast, by Disposal Method 2020 & 2033
- Table 77: Global GCC Waste Management Industry Revenue Million Forecast, by Country 2020 & 2033
- Table 78: Global GCC Waste Management Industry Volume Billion Forecast, by Country 2020 & 2033
- Table 79: China GCC Waste Management Industry Revenue (Million) Forecast, by Application 2020 & 2033
- Table 80: China GCC Waste Management Industry Volume (Billion) Forecast, by Application 2020 & 2033
- Table 81: India GCC Waste Management Industry Revenue (Million) Forecast, by Application 2020 & 2033
- Table 82: India GCC Waste Management Industry Volume (Billion) Forecast, by Application 2020 & 2033
- Table 83: Japan GCC Waste Management Industry Revenue (Million) Forecast, by Application 2020 & 2033
- Table 84: Japan GCC Waste Management Industry Volume (Billion) Forecast, by Application 2020 & 2033
- Table 85: South Korea GCC Waste Management Industry Revenue (Million) Forecast, by Application 2020 & 2033
- Table 86: South Korea GCC Waste Management Industry Volume (Billion) Forecast, by Application 2020 & 2033
- Table 87: ASEAN GCC Waste Management Industry Revenue (Million) Forecast, by Application 2020 & 2033
- Table 88: ASEAN GCC Waste Management Industry Volume (Billion) Forecast, by Application 2020 & 2033
- Table 89: Oceania GCC Waste Management Industry Revenue (Million) Forecast, by Application 2020 & 2033
- Table 90: Oceania GCC Waste Management Industry Volume (Billion) Forecast, by Application 2020 & 2033
- Table 91: Rest of Asia Pacific GCC Waste Management Industry Revenue (Million) Forecast, by Application 2020 & 2033
- Table 92: Rest of Asia Pacific GCC Waste Management Industry Volume (Billion) Forecast, by Application 2020 & 2033
Frequently Asked Questions
1. What is the projected Compound Annual Growth Rate (CAGR) of the GCC Waste Management Industry?
The projected CAGR is approximately 7.38%.
2. Which companies are prominent players in the GCC Waste Management Industry?
Key companies in the market include Averda, EnviroServe, Suez Middle East Recycling LLC, Green Mountains, Veolia, Blue LLC, Envac, SEPCO Environment, Wasco, Saudi Investment Recycling Company, Dulsco Waste Management Services, Bee'ah, Power Waste Management and Transport LLC, Al Haya Enviro, Bin-Ovation, United Waste Management Company, Kuwait Waste Collection and Recycling Company**List Not Exhaustive.
3. What are the main segments of the GCC Waste Management Industry?
The market segments include Waste Type, Disposal Method.
4. Can you provide details about the market size?
The market size is estimated to be USD 63.56 Million as of 2022.
5. What are some drivers contributing to market growth?
4.; Increasing demand for mining waste co-disposable.
6. What are the notable trends driving market growth?
Increasing E-waste Generation in Gulf Cooperation Council Region.
7. Are there any restraints impacting market growth?
4.; Increasing demand for mining waste co-disposable.
8. Can you provide examples of recent developments in the market?
December 2023: Electric mobility firm Wardwizard Innovations and Mobility entered into an agreement with the Sharjah Government co-owned sustainable waste management company BEEAH Group (BG) for the manufacturing of electric vehicles. Under this collaboration, Wardwizard Innovations and Mobility, along with BEEAH Group, will jointly promote electric vehicles in GCC nations and the African region.
9. What pricing options are available for accessing the report?
Pricing options include single-user, multi-user, and enterprise licenses priced at USD 3800, USD 4500, and USD 5800 respectively.
10. Is the market size provided in terms of value or volume?
The market size is provided in terms of value, measured in Million and volume, measured in Billion.
11. Are there any specific market keywords associated with the report?
Yes, the market keyword associated with the report is "GCC Waste Management Industry," which aids in identifying and referencing the specific market segment covered.
12. How do I determine which pricing option suits my needs best?
The pricing options vary based on user requirements and access needs. Individual users may opt for single-user licenses, while businesses requiring broader access may choose multi-user or enterprise licenses for cost-effective access to the report.
13. Are there any additional resources or data provided in the GCC Waste Management Industry report?
While the report offers comprehensive insights, it's advisable to review the specific contents or supplementary materials provided to ascertain if additional resources or data are available.
14. How can I stay updated on further developments or reports in the GCC Waste Management Industry?
To stay informed about further developments, trends, and reports in the GCC Waste Management Industry, consider subscribing to industry newsletters, following relevant companies and organizations, or regularly checking reputable industry news sources and publications.
Methodology
Step 1 - Identification of Relevant Samples Size from Population Database


Step 2 - Approaches for Defining Global Market Size (Value, Volume* & Price*)

Note*: In applicable scenarios
Step 3 - Data Sources
Primary Research
- Web Analytics
- Survey Reports
- Research Institute
- Latest Research Reports
- Opinion Leaders
Secondary Research
- Annual Reports
- White Paper
- Latest Press Release
- Industry Association
- Paid Database
- Investor Presentations

Step 4 - Data Triangulation
Involves using different sources of information in order to increase the validity of a study
These sources are likely to be stakeholders in a program - participants, other researchers, program staff, other community members, and so on.
Then we put all data in single framework & apply various statistical tools to find out the dynamic on the market.
During the analysis stage, feedback from the stakeholder groups would be compared to determine areas of agreement as well as areas of divergence