
Key Insights
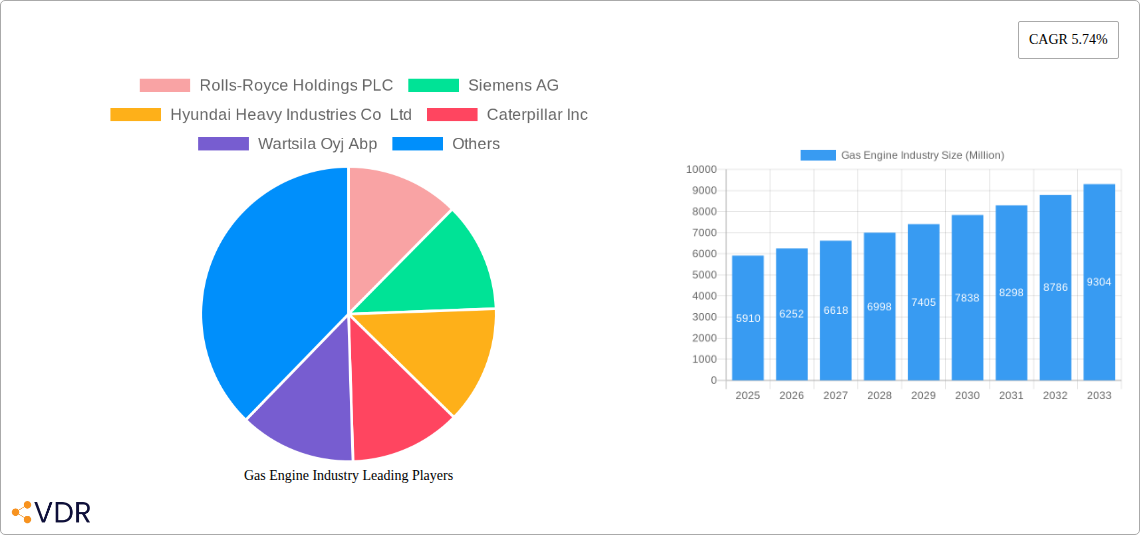
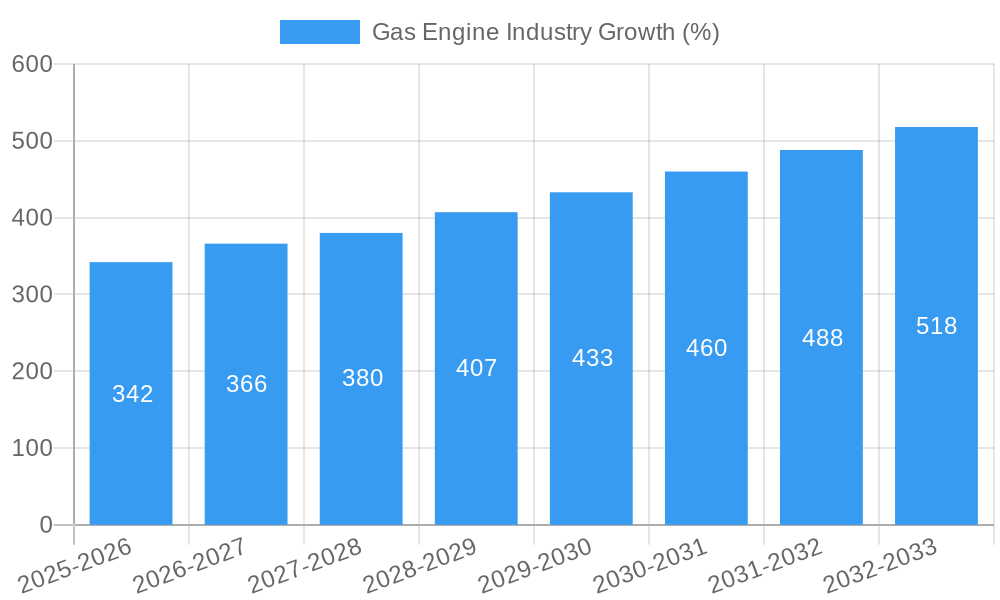
The global gas engine market, valued at $5.91 billion in 2025, is projected to experience robust growth, driven by increasing demand for reliable and efficient power generation across various sectors. A Compound Annual Growth Rate (CAGR) of 5.74% from 2025 to 2033 indicates a significant expansion of this market. Key drivers include the rising adoption of natural gas as a cleaner and more affordable fuel source compared to traditional fossil fuels, particularly in power generation and industrial applications. Furthermore, the growth of decentralized energy systems and the increasing need for backup power solutions are bolstering market expansion. The automotive sector, although smaller than the power utilities segment, contributes significantly through the use of natural gas engines in heavy-duty vehicles and specialized applications. Growth in marine and industrial sectors, driven by demands for efficient and reliable power in ships and industrial processes, also contributes to market expansion. However, potential regulatory changes related to emissions and the emergence of alternative energy technologies, such as fuel cells and batteries, could present some challenges to sustained market growth. Technological advancements focused on improving engine efficiency and reducing emissions will be critical for sustained market expansion. The competitive landscape is marked by major players like Rolls-Royce, Siemens, and Caterpillar, each focusing on technological innovation and strategic partnerships to gain market share.
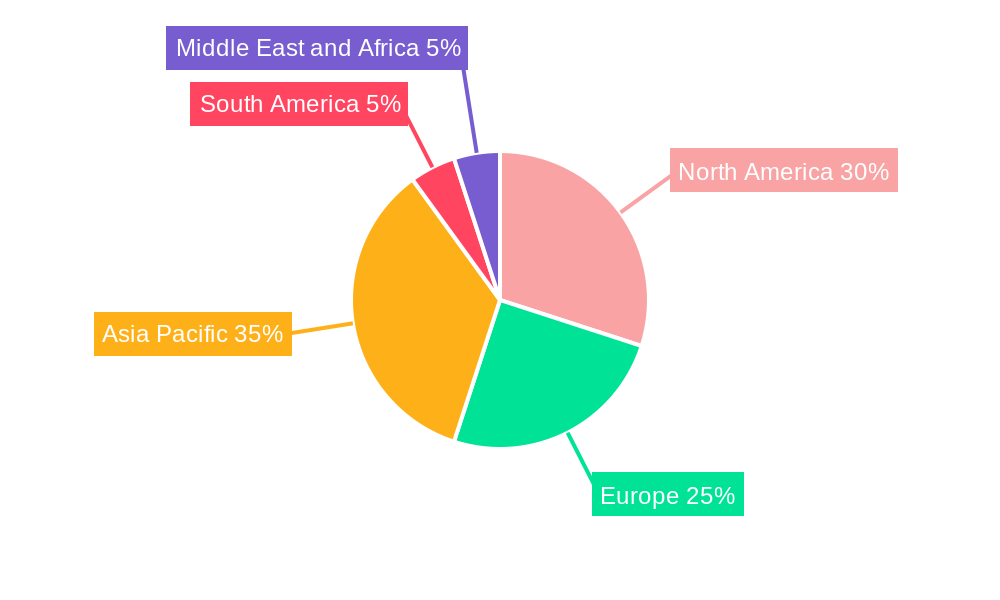
The segmentation of the gas engine market reveals a dominant role for the power utilities end-user segment, fueled by rising energy demands and the need for flexible and reliable power generation. The natural gas fuel type currently dominates, benefiting from its relative abundance and lower cost. However, the growing interest in sustainable energy solutions is fostering the adoption of hydrogen-powered gas engines, representing a promising segment for future growth. Geographic analysis reveals strong market presence in North America and Europe, driven by established infrastructure and stringent emission regulations. Rapid industrialization and urbanization in Asia Pacific are expected to fuel substantial growth in this region over the forecast period. Government policies supporting renewable energy sources and stricter emission norms will likely influence the trajectory of market growth in the coming years. Overall, the gas engine market is poised for continued expansion, driven by multiple factors, though technological advancements and regulatory changes will play crucial roles in shaping its future trajectory.
Gas Engine Industry Market Report: 2019-2033
This comprehensive report provides an in-depth analysis of the Gas Engine Industry, encompassing market dynamics, growth trends, regional dominance, product landscape, key players, and future outlook. The study period covers 2019-2033, with a focus on the base year 2025 and forecast period 2025-2033. The report leverages extensive market data and insights to offer a complete understanding of this evolving sector. This report analyzes both parent (Internal Combustion Engine Market) and child markets (Gas Engine Market) for a complete overview.
Gas Engine Industry Market Dynamics & Structure
The gas engine market, a crucial segment within the broader internal combustion engine industry, exhibits a moderately consolidated structure, with key players like Rolls-Royce Holdings PLC, Siemens AG, Hyundai Heavy Industries Co Ltd, Caterpillar Inc, Wartsila Oyj Abp, Liebherr Group, Cummins Inc, General Electric Company, Kawasaki Heavy Industries Ltd, JFE Engineering Corporation, Man SE, and Mitsubishi Heavy Industries Ltd holding significant market share. However, the entry of new players and technological advancements are leading to increased competition.
Market Concentration: xx% of the market is controlled by the top 5 players in 2025.
Technological Innovation Drivers: Stringent emission regulations, the need for energy efficiency, and the increasing demand for cleaner energy sources are driving innovations in gas engine technology, particularly in areas like hydrogen combustion and improved thermal efficiency.
Regulatory Frameworks: Government policies promoting renewable energy and reducing carbon emissions significantly influence market growth, particularly through incentives for gas engine adoption in specific sectors.
Competitive Product Substitutes: Alternative power generation technologies, such as solar, wind, and fuel cells, pose a competitive threat to gas engines; however, gas engines continue to maintain a strong position due to their reliability and adaptability in various applications.
End-User Demographics: The major end-user segments are Power Utilities, Automotive, Marine, and Industrial sectors; power utilities are the most dominant currently.
M&A Trends: The number of M&A deals in the gas engine industry in the historical period (2019-2024) was xx, primarily driven by companies seeking to expand their product portfolios and geographical reach. This trend is expected to continue, though at a slower pace due to increased regulatory scrutiny.
Gas Engine Industry Growth Trends & Insights
The global gas engine market is projected to experience significant growth during the forecast period (2025-2033). Driven by increasing energy demand, industrialization, and government support for cleaner energy solutions, the market size is expected to reach xx million units by 2033, exhibiting a CAGR of xx% from 2025. The adoption rate of gas engines is rising steadily, particularly in developing economies experiencing rapid industrialization. Technological disruptions, such as the development of more efficient and environmentally friendly gas engines, are further accelerating market growth. Shifts in consumer behavior towards sustainable energy solutions are also playing a significant role. The market penetration of gas engines in various sectors is increasing, with Power Utilities showing the highest adoption rate.
Dominant Regions, Countries, or Segments in Gas Engine Industry
The Asia-Pacific region currently dominates the gas engine market, driven by rapid industrialization and infrastructure development in countries like China and India. Europe and North America also hold significant market shares.
Dominant End-User Segment: Power Utilities remain the largest end-user segment, accounting for xx% of the market in 2025 due to the high demand for reliable and efficient power generation.
Dominant Fuel Type: Natural gas is the dominant fuel type, holding over xx% of market share in 2025 due to its abundance and relatively lower cost compared to hydrogen. However, the rising adoption of hydrogen is expected to gain momentum in the forecast period.
- Key Drivers in Asia-Pacific: Rapid industrialization, increasing energy demand, and government initiatives promoting cleaner energy solutions.
- Key Drivers in Europe: Stringent emission regulations, focus on renewable energy sources, and advancements in gas engine technology.
- Key Drivers in North America: Growth in the power generation sector and increasing adoption of natural gas as a fuel source.
Gas Engine Industry Product Landscape
Gas engine technology is constantly evolving, with advancements in areas like fuel efficiency, emission reduction, and durability. Engine designs incorporate features such as high-pressure direct injection, advanced turbocharging, and sophisticated combustion chamber systems. These innovations are leading to improved performance metrics, including higher thermal efficiency, reduced emissions, and extended operational lifespan. Key selling propositions include higher efficiency, lower emissions, and improved reliability compared to older generation gas engines.
Key Drivers, Barriers & Challenges in Gas Engine Industry
Key Drivers:
- Increasing demand for reliable and efficient power generation.
- Growing adoption of natural gas as a cleaner fuel source.
- Stringent emission regulations and government incentives for cleaner technologies.
- Technological advancements in gas engine design and efficiency.
Key Challenges:
- Fluctuations in natural gas prices.
- Competition from alternative power generation technologies.
- Supply chain disruptions impacting component availability.
- Regulatory hurdles related to emission standards. The cost of implementing new emission technologies poses a considerable challenge.
Emerging Opportunities in Gas Engine Industry
- Growing demand for gas engines in developing economies.
- Expansion into new applications, such as combined heat and power (CHP) systems.
- Development of hydrogen-fueled gas engines to further reduce emissions.
- Focus on digitalization and remote monitoring to improve efficiency and reduce downtime.
Growth Accelerators in the Gas Engine Industry Industry
Technological breakthroughs, such as improved combustion systems and advanced materials, are key growth accelerators. Strategic partnerships between engine manufacturers and energy companies are also driving market growth. Expansion into new geographic markets and diversification into new applications, like renewable gas utilization, present significant growth opportunities.
Key Players Shaping the Gas Engine Industry Market
- Rolls-Royce Holdings PLC
- Siemens AG
- Hyundai Heavy Industries Co Ltd
- Caterpillar Inc
- Wartsila Oyj Abp
- Liebherr Group
- Cummins Inc
- General Electric Company
- Kawasaki Heavy Industries Ltd
- JFE Engineering Corporation
- Man SE
- Mitsubishi Heavy Industries Ltd
Notable Milestones in Gas Engine Industry Sector
- November 2022: Weichai Group launched a commercial natural gas engine with a base engine thermal efficiency of 54.16%, demonstrating significant advancements in gas engine technology.
- March 2023: ITP Aero initiated a USD 13 million project to develop a hydrogen-fueled commercial aircraft engine, showcasing the industry's shift towards cleaner fuel sources.
In-Depth Gas Engine Industry Market Outlook
The gas engine market is poised for continued growth, driven by technological innovations, increasing energy demand, and the transition towards cleaner energy solutions. Strategic partnerships, market expansion initiatives, and the development of hydrogen-fueled engines will shape the future of the industry. The market's potential is significant, offering attractive opportunities for investors and industry players.
Gas Engine Industry Segmentation
-
1. End-User
- 1.1. Power Utilities
- 1.2. Automotive
- 1.3. Marine
- 1.4. Industrial
- 1.5. Others
-
2. Fuel Type
- 2.1. Natural Gas
- 2.2. Hydrogen
- 2.3. Other Fuel Types
Gas Engine Industry Segmentation By Geography
-
1. North America
- 1.1. United States
- 1.2. Canada
- 1.3. Rest of North America
-
2. Europe
- 2.1. Germany
- 2.2. France
- 2.3. United Kingdom
- 2.4. Rest of Europe
-
3. Asia Pacific
- 3.1. China
- 3.2. India
- 3.3. Japan
- 3.4. South Korea
- 3.5. Rest of Asia Pacific
-
4. South America
- 4.1. Brazil
- 4.2. Argentina
- 4.3. Rest of South America
-
5. Middle East and Africa
- 5.1. Saudi Arabia
- 5.2. United Arab Emirates
- 5.3. South Africa
- 5.4. Rest of Middle East and Africa
Gas Engine Industry REPORT HIGHLIGHTS
| Aspects | Details |
|---|---|
| Study Period | 2019-2033 |
| Base Year | 2024 |
| Estimated Year | 2025 |
| Forecast Period | 2025-2033 |
| Historical Period | 2019-2024 |
| Growth Rate | CAGR of 5.74% from 2019-2033 |
| Segmentation |
|
Table of Contents
- 1. Introduction
- 1.1. Research Scope
- 1.2. Market Segmentation
- 1.3. Research Methodology
- 1.4. Definitions and Assumptions
- 2. Executive Summary
- 2.1. Introduction
- 3. Market Dynamics
- 3.1. Introduction
- 3.2. Market Drivers
- 3.2.1. 4.; Increasing Supply and Consumption of Gas-based Systems in Various End-user Industry4.; Implementation of stricter emission regulations worldwide
- 3.3. Market Restrains
- 3.3.1. 4.; Growing Inclination towards Renewable Sources
- 3.4. Market Trends
- 3.4.1. Power Utilities Expected to Witness Significant Growth
- 4. Market Factor Analysis
- 4.1. Porters Five Forces
- 4.2. Supply/Value Chain
- 4.3. PESTEL analysis
- 4.4. Market Entropy
- 4.5. Patent/Trademark Analysis
- 5. Global Gas Engine Industry Analysis, Insights and Forecast, 2019-2031
- 5.1. Market Analysis, Insights and Forecast - by End-User
- 5.1.1. Power Utilities
- 5.1.2. Automotive
- 5.1.3. Marine
- 5.1.4. Industrial
- 5.1.5. Others
- 5.2. Market Analysis, Insights and Forecast - by Fuel Type
- 5.2.1. Natural Gas
- 5.2.2. Hydrogen
- 5.2.3. Other Fuel Types
- 5.3. Market Analysis, Insights and Forecast - by Region
- 5.3.1. North America
- 5.3.2. Europe
- 5.3.3. Asia Pacific
- 5.3.4. South America
- 5.3.5. Middle East and Africa
- 5.1. Market Analysis, Insights and Forecast - by End-User
- 6. North America Gas Engine Industry Analysis, Insights and Forecast, 2019-2031
- 6.1. Market Analysis, Insights and Forecast - by End-User
- 6.1.1. Power Utilities
- 6.1.2. Automotive
- 6.1.3. Marine
- 6.1.4. Industrial
- 6.1.5. Others
- 6.2. Market Analysis, Insights and Forecast - by Fuel Type
- 6.2.1. Natural Gas
- 6.2.2. Hydrogen
- 6.2.3. Other Fuel Types
- 6.1. Market Analysis, Insights and Forecast - by End-User
- 7. Europe Gas Engine Industry Analysis, Insights and Forecast, 2019-2031
- 7.1. Market Analysis, Insights and Forecast - by End-User
- 7.1.1. Power Utilities
- 7.1.2. Automotive
- 7.1.3. Marine
- 7.1.4. Industrial
- 7.1.5. Others
- 7.2. Market Analysis, Insights and Forecast - by Fuel Type
- 7.2.1. Natural Gas
- 7.2.2. Hydrogen
- 7.2.3. Other Fuel Types
- 7.1. Market Analysis, Insights and Forecast - by End-User
- 8. Asia Pacific Gas Engine Industry Analysis, Insights and Forecast, 2019-2031
- 8.1. Market Analysis, Insights and Forecast - by End-User
- 8.1.1. Power Utilities
- 8.1.2. Automotive
- 8.1.3. Marine
- 8.1.4. Industrial
- 8.1.5. Others
- 8.2. Market Analysis, Insights and Forecast - by Fuel Type
- 8.2.1. Natural Gas
- 8.2.2. Hydrogen
- 8.2.3. Other Fuel Types
- 8.1. Market Analysis, Insights and Forecast - by End-User
- 9. South America Gas Engine Industry Analysis, Insights and Forecast, 2019-2031
- 9.1. Market Analysis, Insights and Forecast - by End-User
- 9.1.1. Power Utilities
- 9.1.2. Automotive
- 9.1.3. Marine
- 9.1.4. Industrial
- 9.1.5. Others
- 9.2. Market Analysis, Insights and Forecast - by Fuel Type
- 9.2.1. Natural Gas
- 9.2.2. Hydrogen
- 9.2.3. Other Fuel Types
- 9.1. Market Analysis, Insights and Forecast - by End-User
- 10. Middle East and Africa Gas Engine Industry Analysis, Insights and Forecast, 2019-2031
- 10.1. Market Analysis, Insights and Forecast - by End-User
- 10.1.1. Power Utilities
- 10.1.2. Automotive
- 10.1.3. Marine
- 10.1.4. Industrial
- 10.1.5. Others
- 10.2. Market Analysis, Insights and Forecast - by Fuel Type
- 10.2.1. Natural Gas
- 10.2.2. Hydrogen
- 10.2.3. Other Fuel Types
- 10.1. Market Analysis, Insights and Forecast - by End-User
- 11. North America Gas Engine Industry Analysis, Insights and Forecast, 2019-2031
- 11.1. Market Analysis, Insights and Forecast - By Country/Sub-region
- 11.1.1 United States
- 11.1.2 Canada
- 11.1.3 Rest of North America
- 12. Europe Gas Engine Industry Analysis, Insights and Forecast, 2019-2031
- 12.1. Market Analysis, Insights and Forecast - By Country/Sub-region
- 12.1.1 Germany
- 12.1.2 France
- 12.1.3 United Kingdom
- 12.1.4 Rest of Europe
- 13. Asia Pacific Gas Engine Industry Analysis, Insights and Forecast, 2019-2031
- 13.1. Market Analysis, Insights and Forecast - By Country/Sub-region
- 13.1.1 China
- 13.1.2 India
- 13.1.3 Japan
- 13.1.4 South Korea
- 13.1.5 Rest of Asia Pacific
- 14. South America Gas Engine Industry Analysis, Insights and Forecast, 2019-2031
- 14.1. Market Analysis, Insights and Forecast - By Country/Sub-region
- 14.1.1 Brazil
- 14.1.2 Argentina
- 14.1.3 Rest of South America
- 15. Middle East and Africa Gas Engine Industry Analysis, Insights and Forecast, 2019-2031
- 15.1. Market Analysis, Insights and Forecast - By Country/Sub-region
- 15.1.1 Saudi Arabia
- 15.1.2 United Arab Emirates
- 15.1.3 South Africa
- 15.1.4 Rest of Middle East and Africa
- 16. Competitive Analysis
- 16.1. Global Market Share Analysis 2024
- 16.2. Company Profiles
- 16.2.1 Rolls-Royce Holdings PLC
- 16.2.1.1. Overview
- 16.2.1.2. Products
- 16.2.1.3. SWOT Analysis
- 16.2.1.4. Recent Developments
- 16.2.1.5. Financials (Based on Availability)
- 16.2.2 Siemens AG
- 16.2.2.1. Overview
- 16.2.2.2. Products
- 16.2.2.3. SWOT Analysis
- 16.2.2.4. Recent Developments
- 16.2.2.5. Financials (Based on Availability)
- 16.2.3 Hyundai Heavy Industries Co Ltd
- 16.2.3.1. Overview
- 16.2.3.2. Products
- 16.2.3.3. SWOT Analysis
- 16.2.3.4. Recent Developments
- 16.2.3.5. Financials (Based on Availability)
- 16.2.4 Caterpillar Inc
- 16.2.4.1. Overview
- 16.2.4.2. Products
- 16.2.4.3. SWOT Analysis
- 16.2.4.4. Recent Developments
- 16.2.4.5. Financials (Based on Availability)
- 16.2.5 Wartsila Oyj Abp
- 16.2.5.1. Overview
- 16.2.5.2. Products
- 16.2.5.3. SWOT Analysis
- 16.2.5.4. Recent Developments
- 16.2.5.5. Financials (Based on Availability)
- 16.2.6 Liebherr Group*List Not Exhaustive
- 16.2.6.1. Overview
- 16.2.6.2. Products
- 16.2.6.3. SWOT Analysis
- 16.2.6.4. Recent Developments
- 16.2.6.5. Financials (Based on Availability)
- 16.2.7 Cummins Inc
- 16.2.7.1. Overview
- 16.2.7.2. Products
- 16.2.7.3. SWOT Analysis
- 16.2.7.4. Recent Developments
- 16.2.7.5. Financials (Based on Availability)
- 16.2.8 General Electric Company
- 16.2.8.1. Overview
- 16.2.8.2. Products
- 16.2.8.3. SWOT Analysis
- 16.2.8.4. Recent Developments
- 16.2.8.5. Financials (Based on Availability)
- 16.2.9 Kawasaki Heavy Industries Ltd
- 16.2.9.1. Overview
- 16.2.9.2. Products
- 16.2.9.3. SWOT Analysis
- 16.2.9.4. Recent Developments
- 16.2.9.5. Financials (Based on Availability)
- 16.2.10 JFE Engineering Corporation
- 16.2.10.1. Overview
- 16.2.10.2. Products
- 16.2.10.3. SWOT Analysis
- 16.2.10.4. Recent Developments
- 16.2.10.5. Financials (Based on Availability)
- 16.2.11 Man SE
- 16.2.11.1. Overview
- 16.2.11.2. Products
- 16.2.11.3. SWOT Analysis
- 16.2.11.4. Recent Developments
- 16.2.11.5. Financials (Based on Availability)
- 16.2.12 Mitsubishi Heavy Industries Ltd
- 16.2.12.1. Overview
- 16.2.12.2. Products
- 16.2.12.3. SWOT Analysis
- 16.2.12.4. Recent Developments
- 16.2.12.5. Financials (Based on Availability)
- 16.2.1 Rolls-Royce Holdings PLC
List of Figures
- Figure 1: Global Gas Engine Industry Revenue Breakdown (Million, %) by Region 2024 & 2032
- Figure 2: Global Gas Engine Industry Volume Breakdown (K Unit, %) by Region 2024 & 2032
- Figure 3: North America Gas Engine Industry Revenue (Million), by Country 2024 & 2032
- Figure 4: North America Gas Engine Industry Volume (K Unit), by Country 2024 & 2032
- Figure 5: North America Gas Engine Industry Revenue Share (%), by Country 2024 & 2032
- Figure 6: North America Gas Engine Industry Volume Share (%), by Country 2024 & 2032
- Figure 7: Europe Gas Engine Industry Revenue (Million), by Country 2024 & 2032
- Figure 8: Europe Gas Engine Industry Volume (K Unit), by Country 2024 & 2032
- Figure 9: Europe Gas Engine Industry Revenue Share (%), by Country 2024 & 2032
- Figure 10: Europe Gas Engine Industry Volume Share (%), by Country 2024 & 2032
- Figure 11: Asia Pacific Gas Engine Industry Revenue (Million), by Country 2024 & 2032
- Figure 12: Asia Pacific Gas Engine Industry Volume (K Unit), by Country 2024 & 2032
- Figure 13: Asia Pacific Gas Engine Industry Revenue Share (%), by Country 2024 & 2032
- Figure 14: Asia Pacific Gas Engine Industry Volume Share (%), by Country 2024 & 2032
- Figure 15: South America Gas Engine Industry Revenue (Million), by Country 2024 & 2032
- Figure 16: South America Gas Engine Industry Volume (K Unit), by Country 2024 & 2032
- Figure 17: South America Gas Engine Industry Revenue Share (%), by Country 2024 & 2032
- Figure 18: South America Gas Engine Industry Volume Share (%), by Country 2024 & 2032
- Figure 19: Middle East and Africa Gas Engine Industry Revenue (Million), by Country 2024 & 2032
- Figure 20: Middle East and Africa Gas Engine Industry Volume (K Unit), by Country 2024 & 2032
- Figure 21: Middle East and Africa Gas Engine Industry Revenue Share (%), by Country 2024 & 2032
- Figure 22: Middle East and Africa Gas Engine Industry Volume Share (%), by Country 2024 & 2032
- Figure 23: North America Gas Engine Industry Revenue (Million), by End-User 2024 & 2032
- Figure 24: North America Gas Engine Industry Volume (K Unit), by End-User 2024 & 2032
- Figure 25: North America Gas Engine Industry Revenue Share (%), by End-User 2024 & 2032
- Figure 26: North America Gas Engine Industry Volume Share (%), by End-User 2024 & 2032
- Figure 27: North America Gas Engine Industry Revenue (Million), by Fuel Type 2024 & 2032
- Figure 28: North America Gas Engine Industry Volume (K Unit), by Fuel Type 2024 & 2032
- Figure 29: North America Gas Engine Industry Revenue Share (%), by Fuel Type 2024 & 2032
- Figure 30: North America Gas Engine Industry Volume Share (%), by Fuel Type 2024 & 2032
- Figure 31: North America Gas Engine Industry Revenue (Million), by Country 2024 & 2032
- Figure 32: North America Gas Engine Industry Volume (K Unit), by Country 2024 & 2032
- Figure 33: North America Gas Engine Industry Revenue Share (%), by Country 2024 & 2032
- Figure 34: North America Gas Engine Industry Volume Share (%), by Country 2024 & 2032
- Figure 35: Europe Gas Engine Industry Revenue (Million), by End-User 2024 & 2032
- Figure 36: Europe Gas Engine Industry Volume (K Unit), by End-User 2024 & 2032
- Figure 37: Europe Gas Engine Industry Revenue Share (%), by End-User 2024 & 2032
- Figure 38: Europe Gas Engine Industry Volume Share (%), by End-User 2024 & 2032
- Figure 39: Europe Gas Engine Industry Revenue (Million), by Fuel Type 2024 & 2032
- Figure 40: Europe Gas Engine Industry Volume (K Unit), by Fuel Type 2024 & 2032
- Figure 41: Europe Gas Engine Industry Revenue Share (%), by Fuel Type 2024 & 2032
- Figure 42: Europe Gas Engine Industry Volume Share (%), by Fuel Type 2024 & 2032
- Figure 43: Europe Gas Engine Industry Revenue (Million), by Country 2024 & 2032
- Figure 44: Europe Gas Engine Industry Volume (K Unit), by Country 2024 & 2032
- Figure 45: Europe Gas Engine Industry Revenue Share (%), by Country 2024 & 2032
- Figure 46: Europe Gas Engine Industry Volume Share (%), by Country 2024 & 2032
- Figure 47: Asia Pacific Gas Engine Industry Revenue (Million), by End-User 2024 & 2032
- Figure 48: Asia Pacific Gas Engine Industry Volume (K Unit), by End-User 2024 & 2032
- Figure 49: Asia Pacific Gas Engine Industry Revenue Share (%), by End-User 2024 & 2032
- Figure 50: Asia Pacific Gas Engine Industry Volume Share (%), by End-User 2024 & 2032
- Figure 51: Asia Pacific Gas Engine Industry Revenue (Million), by Fuel Type 2024 & 2032
- Figure 52: Asia Pacific Gas Engine Industry Volume (K Unit), by Fuel Type 2024 & 2032
- Figure 53: Asia Pacific Gas Engine Industry Revenue Share (%), by Fuel Type 2024 & 2032
- Figure 54: Asia Pacific Gas Engine Industry Volume Share (%), by Fuel Type 2024 & 2032
- Figure 55: Asia Pacific Gas Engine Industry Revenue (Million), by Country 2024 & 2032
- Figure 56: Asia Pacific Gas Engine Industry Volume (K Unit), by Country 2024 & 2032
- Figure 57: Asia Pacific Gas Engine Industry Revenue Share (%), by Country 2024 & 2032
- Figure 58: Asia Pacific Gas Engine Industry Volume Share (%), by Country 2024 & 2032
- Figure 59: South America Gas Engine Industry Revenue (Million), by End-User 2024 & 2032
- Figure 60: South America Gas Engine Industry Volume (K Unit), by End-User 2024 & 2032
- Figure 61: South America Gas Engine Industry Revenue Share (%), by End-User 2024 & 2032
- Figure 62: South America Gas Engine Industry Volume Share (%), by End-User 2024 & 2032
- Figure 63: South America Gas Engine Industry Revenue (Million), by Fuel Type 2024 & 2032
- Figure 64: South America Gas Engine Industry Volume (K Unit), by Fuel Type 2024 & 2032
- Figure 65: South America Gas Engine Industry Revenue Share (%), by Fuel Type 2024 & 2032
- Figure 66: South America Gas Engine Industry Volume Share (%), by Fuel Type 2024 & 2032
- Figure 67: South America Gas Engine Industry Revenue (Million), by Country 2024 & 2032
- Figure 68: South America Gas Engine Industry Volume (K Unit), by Country 2024 & 2032
- Figure 69: South America Gas Engine Industry Revenue Share (%), by Country 2024 & 2032
- Figure 70: South America Gas Engine Industry Volume Share (%), by Country 2024 & 2032
- Figure 71: Middle East and Africa Gas Engine Industry Revenue (Million), by End-User 2024 & 2032
- Figure 72: Middle East and Africa Gas Engine Industry Volume (K Unit), by End-User 2024 & 2032
- Figure 73: Middle East and Africa Gas Engine Industry Revenue Share (%), by End-User 2024 & 2032
- Figure 74: Middle East and Africa Gas Engine Industry Volume Share (%), by End-User 2024 & 2032
- Figure 75: Middle East and Africa Gas Engine Industry Revenue (Million), by Fuel Type 2024 & 2032
- Figure 76: Middle East and Africa Gas Engine Industry Volume (K Unit), by Fuel Type 2024 & 2032
- Figure 77: Middle East and Africa Gas Engine Industry Revenue Share (%), by Fuel Type 2024 & 2032
- Figure 78: Middle East and Africa Gas Engine Industry Volume Share (%), by Fuel Type 2024 & 2032
- Figure 79: Middle East and Africa Gas Engine Industry Revenue (Million), by Country 2024 & 2032
- Figure 80: Middle East and Africa Gas Engine Industry Volume (K Unit), by Country 2024 & 2032
- Figure 81: Middle East and Africa Gas Engine Industry Revenue Share (%), by Country 2024 & 2032
- Figure 82: Middle East and Africa Gas Engine Industry Volume Share (%), by Country 2024 & 2032
List of Tables
- Table 1: Global Gas Engine Industry Revenue Million Forecast, by Region 2019 & 2032
- Table 2: Global Gas Engine Industry Volume K Unit Forecast, by Region 2019 & 2032
- Table 3: Global Gas Engine Industry Revenue Million Forecast, by End-User 2019 & 2032
- Table 4: Global Gas Engine Industry Volume K Unit Forecast, by End-User 2019 & 2032
- Table 5: Global Gas Engine Industry Revenue Million Forecast, by Fuel Type 2019 & 2032
- Table 6: Global Gas Engine Industry Volume K Unit Forecast, by Fuel Type 2019 & 2032
- Table 7: Global Gas Engine Industry Revenue Million Forecast, by Region 2019 & 2032
- Table 8: Global Gas Engine Industry Volume K Unit Forecast, by Region 2019 & 2032
- Table 9: Global Gas Engine Industry Revenue Million Forecast, by Country 2019 & 2032
- Table 10: Global Gas Engine Industry Volume K Unit Forecast, by Country 2019 & 2032
- Table 11: United States Gas Engine Industry Revenue (Million) Forecast, by Application 2019 & 2032
- Table 12: United States Gas Engine Industry Volume (K Unit) Forecast, by Application 2019 & 2032
- Table 13: Canada Gas Engine Industry Revenue (Million) Forecast, by Application 2019 & 2032
- Table 14: Canada Gas Engine Industry Volume (K Unit) Forecast, by Application 2019 & 2032
- Table 15: Rest of North America Gas Engine Industry Revenue (Million) Forecast, by Application 2019 & 2032
- Table 16: Rest of North America Gas Engine Industry Volume (K Unit) Forecast, by Application 2019 & 2032
- Table 17: Global Gas Engine Industry Revenue Million Forecast, by Country 2019 & 2032
- Table 18: Global Gas Engine Industry Volume K Unit Forecast, by Country 2019 & 2032
- Table 19: Germany Gas Engine Industry Revenue (Million) Forecast, by Application 2019 & 2032
- Table 20: Germany Gas Engine Industry Volume (K Unit) Forecast, by Application 2019 & 2032
- Table 21: France Gas Engine Industry Revenue (Million) Forecast, by Application 2019 & 2032
- Table 22: France Gas Engine Industry Volume (K Unit) Forecast, by Application 2019 & 2032
- Table 23: United Kingdom Gas Engine Industry Revenue (Million) Forecast, by Application 2019 & 2032
- Table 24: United Kingdom Gas Engine Industry Volume (K Unit) Forecast, by Application 2019 & 2032
- Table 25: Rest of Europe Gas Engine Industry Revenue (Million) Forecast, by Application 2019 & 2032
- Table 26: Rest of Europe Gas Engine Industry Volume (K Unit) Forecast, by Application 2019 & 2032
- Table 27: Global Gas Engine Industry Revenue Million Forecast, by Country 2019 & 2032
- Table 28: Global Gas Engine Industry Volume K Unit Forecast, by Country 2019 & 2032
- Table 29: China Gas Engine Industry Revenue (Million) Forecast, by Application 2019 & 2032
- Table 30: China Gas Engine Industry Volume (K Unit) Forecast, by Application 2019 & 2032
- Table 31: India Gas Engine Industry Revenue (Million) Forecast, by Application 2019 & 2032
- Table 32: India Gas Engine Industry Volume (K Unit) Forecast, by Application 2019 & 2032
- Table 33: Japan Gas Engine Industry Revenue (Million) Forecast, by Application 2019 & 2032
- Table 34: Japan Gas Engine Industry Volume (K Unit) Forecast, by Application 2019 & 2032
- Table 35: South Korea Gas Engine Industry Revenue (Million) Forecast, by Application 2019 & 2032
- Table 36: South Korea Gas Engine Industry Volume (K Unit) Forecast, by Application 2019 & 2032
- Table 37: Rest of Asia Pacific Gas Engine Industry Revenue (Million) Forecast, by Application 2019 & 2032
- Table 38: Rest of Asia Pacific Gas Engine Industry Volume (K Unit) Forecast, by Application 2019 & 2032
- Table 39: Global Gas Engine Industry Revenue Million Forecast, by Country 2019 & 2032
- Table 40: Global Gas Engine Industry Volume K Unit Forecast, by Country 2019 & 2032
- Table 41: Brazil Gas Engine Industry Revenue (Million) Forecast, by Application 2019 & 2032
- Table 42: Brazil Gas Engine Industry Volume (K Unit) Forecast, by Application 2019 & 2032
- Table 43: Argentina Gas Engine Industry Revenue (Million) Forecast, by Application 2019 & 2032
- Table 44: Argentina Gas Engine Industry Volume (K Unit) Forecast, by Application 2019 & 2032
- Table 45: Rest of South America Gas Engine Industry Revenue (Million) Forecast, by Application 2019 & 2032
- Table 46: Rest of South America Gas Engine Industry Volume (K Unit) Forecast, by Application 2019 & 2032
- Table 47: Global Gas Engine Industry Revenue Million Forecast, by Country 2019 & 2032
- Table 48: Global Gas Engine Industry Volume K Unit Forecast, by Country 2019 & 2032
- Table 49: Saudi Arabia Gas Engine Industry Revenue (Million) Forecast, by Application 2019 & 2032
- Table 50: Saudi Arabia Gas Engine Industry Volume (K Unit) Forecast, by Application 2019 & 2032
- Table 51: United Arab Emirates Gas Engine Industry Revenue (Million) Forecast, by Application 2019 & 2032
- Table 52: United Arab Emirates Gas Engine Industry Volume (K Unit) Forecast, by Application 2019 & 2032
- Table 53: South Africa Gas Engine Industry Revenue (Million) Forecast, by Application 2019 & 2032
- Table 54: South Africa Gas Engine Industry Volume (K Unit) Forecast, by Application 2019 & 2032
- Table 55: Rest of Middle East and Africa Gas Engine Industry Revenue (Million) Forecast, by Application 2019 & 2032
- Table 56: Rest of Middle East and Africa Gas Engine Industry Volume (K Unit) Forecast, by Application 2019 & 2032
- Table 57: Global Gas Engine Industry Revenue Million Forecast, by End-User 2019 & 2032
- Table 58: Global Gas Engine Industry Volume K Unit Forecast, by End-User 2019 & 2032
- Table 59: Global Gas Engine Industry Revenue Million Forecast, by Fuel Type 2019 & 2032
- Table 60: Global Gas Engine Industry Volume K Unit Forecast, by Fuel Type 2019 & 2032
- Table 61: Global Gas Engine Industry Revenue Million Forecast, by Country 2019 & 2032
- Table 62: Global Gas Engine Industry Volume K Unit Forecast, by Country 2019 & 2032
- Table 63: United States Gas Engine Industry Revenue (Million) Forecast, by Application 2019 & 2032
- Table 64: United States Gas Engine Industry Volume (K Unit) Forecast, by Application 2019 & 2032
- Table 65: Canada Gas Engine Industry Revenue (Million) Forecast, by Application 2019 & 2032
- Table 66: Canada Gas Engine Industry Volume (K Unit) Forecast, by Application 2019 & 2032
- Table 67: Rest of North America Gas Engine Industry Revenue (Million) Forecast, by Application 2019 & 2032
- Table 68: Rest of North America Gas Engine Industry Volume (K Unit) Forecast, by Application 2019 & 2032
- Table 69: Global Gas Engine Industry Revenue Million Forecast, by End-User 2019 & 2032
- Table 70: Global Gas Engine Industry Volume K Unit Forecast, by End-User 2019 & 2032
- Table 71: Global Gas Engine Industry Revenue Million Forecast, by Fuel Type 2019 & 2032
- Table 72: Global Gas Engine Industry Volume K Unit Forecast, by Fuel Type 2019 & 2032
- Table 73: Global Gas Engine Industry Revenue Million Forecast, by Country 2019 & 2032
- Table 74: Global Gas Engine Industry Volume K Unit Forecast, by Country 2019 & 2032
- Table 75: Germany Gas Engine Industry Revenue (Million) Forecast, by Application 2019 & 2032
- Table 76: Germany Gas Engine Industry Volume (K Unit) Forecast, by Application 2019 & 2032
- Table 77: France Gas Engine Industry Revenue (Million) Forecast, by Application 2019 & 2032
- Table 78: France Gas Engine Industry Volume (K Unit) Forecast, by Application 2019 & 2032
- Table 79: United Kingdom Gas Engine Industry Revenue (Million) Forecast, by Application 2019 & 2032
- Table 80: United Kingdom Gas Engine Industry Volume (K Unit) Forecast, by Application 2019 & 2032
- Table 81: Rest of Europe Gas Engine Industry Revenue (Million) Forecast, by Application 2019 & 2032
- Table 82: Rest of Europe Gas Engine Industry Volume (K Unit) Forecast, by Application 2019 & 2032
- Table 83: Global Gas Engine Industry Revenue Million Forecast, by End-User 2019 & 2032
- Table 84: Global Gas Engine Industry Volume K Unit Forecast, by End-User 2019 & 2032
- Table 85: Global Gas Engine Industry Revenue Million Forecast, by Fuel Type 2019 & 2032
- Table 86: Global Gas Engine Industry Volume K Unit Forecast, by Fuel Type 2019 & 2032
- Table 87: Global Gas Engine Industry Revenue Million Forecast, by Country 2019 & 2032
- Table 88: Global Gas Engine Industry Volume K Unit Forecast, by Country 2019 & 2032
- Table 89: China Gas Engine Industry Revenue (Million) Forecast, by Application 2019 & 2032
- Table 90: China Gas Engine Industry Volume (K Unit) Forecast, by Application 2019 & 2032
- Table 91: India Gas Engine Industry Revenue (Million) Forecast, by Application 2019 & 2032
- Table 92: India Gas Engine Industry Volume (K Unit) Forecast, by Application 2019 & 2032
- Table 93: Japan Gas Engine Industry Revenue (Million) Forecast, by Application 2019 & 2032
- Table 94: Japan Gas Engine Industry Volume (K Unit) Forecast, by Application 2019 & 2032
- Table 95: South Korea Gas Engine Industry Revenue (Million) Forecast, by Application 2019 & 2032
- Table 96: South Korea Gas Engine Industry Volume (K Unit) Forecast, by Application 2019 & 2032
- Table 97: Rest of Asia Pacific Gas Engine Industry Revenue (Million) Forecast, by Application 2019 & 2032
- Table 98: Rest of Asia Pacific Gas Engine Industry Volume (K Unit) Forecast, by Application 2019 & 2032
- Table 99: Global Gas Engine Industry Revenue Million Forecast, by End-User 2019 & 2032
- Table 100: Global Gas Engine Industry Volume K Unit Forecast, by End-User 2019 & 2032
- Table 101: Global Gas Engine Industry Revenue Million Forecast, by Fuel Type 2019 & 2032
- Table 102: Global Gas Engine Industry Volume K Unit Forecast, by Fuel Type 2019 & 2032
- Table 103: Global Gas Engine Industry Revenue Million Forecast, by Country 2019 & 2032
- Table 104: Global Gas Engine Industry Volume K Unit Forecast, by Country 2019 & 2032
- Table 105: Brazil Gas Engine Industry Revenue (Million) Forecast, by Application 2019 & 2032
- Table 106: Brazil Gas Engine Industry Volume (K Unit) Forecast, by Application 2019 & 2032
- Table 107: Argentina Gas Engine Industry Revenue (Million) Forecast, by Application 2019 & 2032
- Table 108: Argentina Gas Engine Industry Volume (K Unit) Forecast, by Application 2019 & 2032
- Table 109: Rest of South America Gas Engine Industry Revenue (Million) Forecast, by Application 2019 & 2032
- Table 110: Rest of South America Gas Engine Industry Volume (K Unit) Forecast, by Application 2019 & 2032
- Table 111: Global Gas Engine Industry Revenue Million Forecast, by End-User 2019 & 2032
- Table 112: Global Gas Engine Industry Volume K Unit Forecast, by End-User 2019 & 2032
- Table 113: Global Gas Engine Industry Revenue Million Forecast, by Fuel Type 2019 & 2032
- Table 114: Global Gas Engine Industry Volume K Unit Forecast, by Fuel Type 2019 & 2032
- Table 115: Global Gas Engine Industry Revenue Million Forecast, by Country 2019 & 2032
- Table 116: Global Gas Engine Industry Volume K Unit Forecast, by Country 2019 & 2032
- Table 117: Saudi Arabia Gas Engine Industry Revenue (Million) Forecast, by Application 2019 & 2032
- Table 118: Saudi Arabia Gas Engine Industry Volume (K Unit) Forecast, by Application 2019 & 2032
- Table 119: United Arab Emirates Gas Engine Industry Revenue (Million) Forecast, by Application 2019 & 2032
- Table 120: United Arab Emirates Gas Engine Industry Volume (K Unit) Forecast, by Application 2019 & 2032
- Table 121: South Africa Gas Engine Industry Revenue (Million) Forecast, by Application 2019 & 2032
- Table 122: South Africa Gas Engine Industry Volume (K Unit) Forecast, by Application 2019 & 2032
- Table 123: Rest of Middle East and Africa Gas Engine Industry Revenue (Million) Forecast, by Application 2019 & 2032
- Table 124: Rest of Middle East and Africa Gas Engine Industry Volume (K Unit) Forecast, by Application 2019 & 2032
Frequently Asked Questions
1. What is the projected Compound Annual Growth Rate (CAGR) of the Gas Engine Industry?
The projected CAGR is approximately 5.74%.
2. Which companies are prominent players in the Gas Engine Industry?
Key companies in the market include Rolls-Royce Holdings PLC, Siemens AG, Hyundai Heavy Industries Co Ltd, Caterpillar Inc, Wartsila Oyj Abp, Liebherr Group*List Not Exhaustive, Cummins Inc, General Electric Company, Kawasaki Heavy Industries Ltd, JFE Engineering Corporation, Man SE, Mitsubishi Heavy Industries Ltd.
3. What are the main segments of the Gas Engine Industry?
The market segments include End-User, Fuel Type.
4. Can you provide details about the market size?
The market size is estimated to be USD 5.91 Million as of 2022.
5. What are some drivers contributing to market growth?
4.; Increasing Supply and Consumption of Gas-based Systems in Various End-user Industry4.; Implementation of stricter emission regulations worldwide.
6. What are the notable trends driving market growth?
Power Utilities Expected to Witness Significant Growth.
7. Are there any restraints impacting market growth?
4.; Growing Inclination towards Renewable Sources.
8. Can you provide examples of recent developments in the market?
In March 2023, ITP Aero, a Spanish aircraft engine company, has announced that it is leading a national consortium to test and develop the first hydrogen-fueled commercial aircraft engine developed locally. As part of the Spanish Ministry of Science agency's Aeronautical Technology Plan, managed by CDTI, the Spanish Center for Technological Development and Innovation, the USD 13 million Cryogenics, Fuel Cells and Hydrogen Combustion in Air Transport project is co-funded by European Union Next Gen strategic investment funding.
9. What pricing options are available for accessing the report?
Pricing options include single-user, multi-user, and enterprise licenses priced at USD 4750, USD 5250, and USD 8750 respectively.
10. Is the market size provided in terms of value or volume?
The market size is provided in terms of value, measured in Million and volume, measured in K Unit.
11. Are there any specific market keywords associated with the report?
Yes, the market keyword associated with the report is "Gas Engine Industry," which aids in identifying and referencing the specific market segment covered.
12. How do I determine which pricing option suits my needs best?
The pricing options vary based on user requirements and access needs. Individual users may opt for single-user licenses, while businesses requiring broader access may choose multi-user or enterprise licenses for cost-effective access to the report.
13. Are there any additional resources or data provided in the Gas Engine Industry report?
While the report offers comprehensive insights, it's advisable to review the specific contents or supplementary materials provided to ascertain if additional resources or data are available.
14. How can I stay updated on further developments or reports in the Gas Engine Industry?
To stay informed about further developments, trends, and reports in the Gas Engine Industry, consider subscribing to industry newsletters, following relevant companies and organizations, or regularly checking reputable industry news sources and publications.
Methodology
Step 1 - Identification of Relevant Samples Size from Population Database


Step 2 - Approaches for Defining Global Market Size (Value, Volume* & Price*)

Note*: In applicable scenarios
Step 3 - Data Sources
Primary Research
- Web Analytics
- Survey Reports
- Research Institute
- Latest Research Reports
- Opinion Leaders
Secondary Research
- Annual Reports
- White Paper
- Latest Press Release
- Industry Association
- Paid Database
- Investor Presentations

Step 4 - Data Triangulation
Involves using different sources of information in order to increase the validity of a study
These sources are likely to be stakeholders in a program - participants, other researchers, program staff, other community members, and so on.
Then we put all data in single framework & apply various statistical tools to find out the dynamic on the market.
During the analysis stage, feedback from the stakeholder groups would be compared to determine areas of agreement as well as areas of divergence


