

Key Insights
The Global Gallium Nitride (GaN) Semiconductor Market is poised for robust expansion, projected to reach a valuation of USD 21.18 billion by 2025, driven by an impressive Compound Annual Growth Rate (CAGR) of 6.06%. This signifies a dynamic industry landscape where GaN technology is rapidly displacing traditional silicon-based solutions across a multitude of high-performance applications. The primary growth engines for this market stem from the inherent superior performance characteristics of GaN, including higher efficiency, faster switching speeds, increased power density, and enhanced thermal management capabilities. These advantages are critically important in burgeoning sectors like electric vehicles, where efficient power conversion is paramount for extending battery range, and in advanced consumer electronics, where miniaturization and faster charging are key differentiators. The increasing demand for next-generation wireless infrastructure, particularly the rollout of 5G networks, also presents a significant growth opportunity, as GaN-based RF components offer improved performance and power efficiency critical for these demanding communication standards.
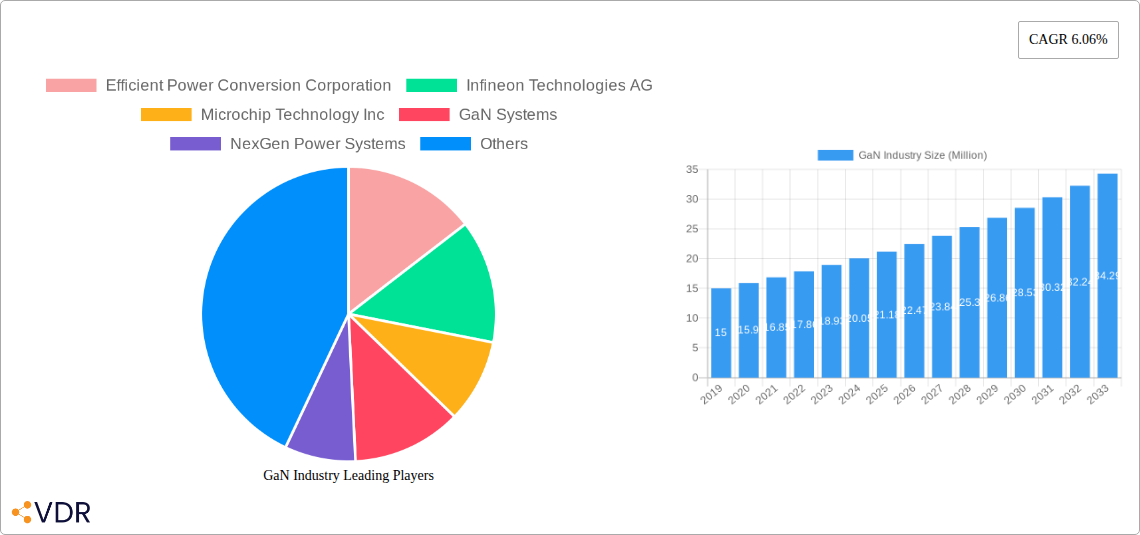
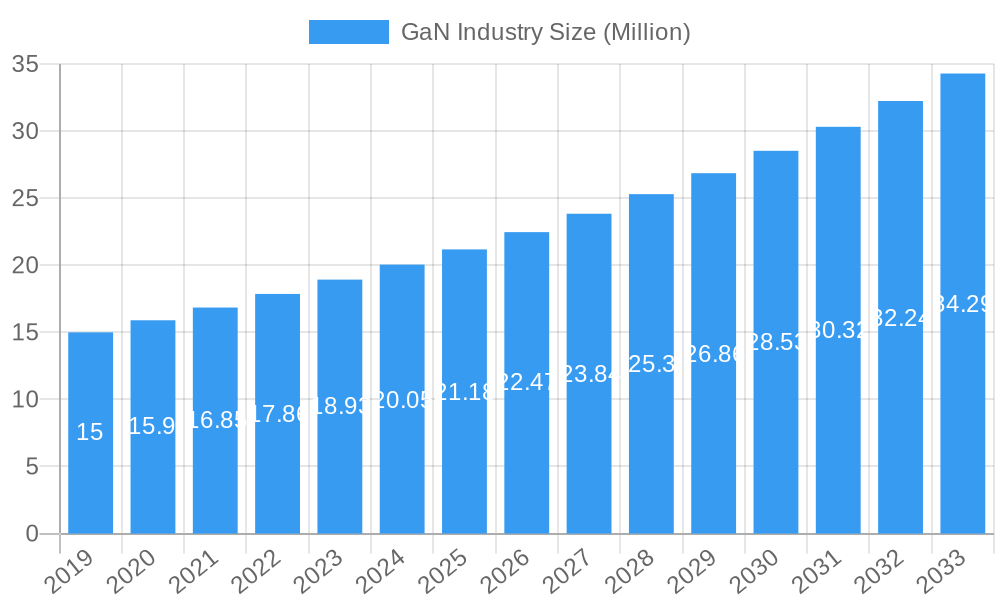
GaN Industry Market Size (In Million)
The market's trajectory is further bolstered by significant trends such as the pervasive integration of GaN power semiconductors into power adapters, data centers, and renewable energy systems, all of which are experiencing substantial global investment. The evolution of Opto-Semiconductors, especially in advanced lighting and display technologies, and the expanding use of RF semiconductors in radar and satellite communications, are also key contributors to market growth. However, certain challenges, including the higher initial manufacturing costs compared to silicon and the need for specialized handling and fabrication processes, act as restraints. Despite these hurdles, the continuous innovation in GaN material science and manufacturing techniques, coupled with a growing ecosystem of dedicated companies like Efficient Power Conversion, Infineon Technologies, and Wolfspeed, are actively addressing these limitations, paving the way for widespread adoption and sustained market growth throughout the forecast period.
GaN Industry Company Market Share
GaN Industry Market Report: Unveiling the Future of Power Semiconductors
This comprehensive GaN Industry Market Report delves into the dynamic landscape of Gallium Nitride (GaN) technology, a pivotal material revolutionizing power and RF semiconductors. Spanning from 2019 to 2033, with a base year of 2025, this analysis provides critical insights into market size, growth trajectories, regional dominance, product innovation, key drivers, challenges, and emerging opportunities. We meticulously examine the parent and child market segments, offering a granular view of how GaN is transforming end-user industries. Prepare for an in-depth exploration of market concentration, technological advancements, and competitive strategies that are shaping the future of electronics.
GaN Industry Market Dynamics & Structure
The GaN industry is characterized by a moderately concentrated market, driven by significant technological innovation and increasing regulatory pressure for energy efficiency. Key players are investing heavily in R&D to overcome inherent manufacturing complexities and cost barriers associated with GaN materials. Competitive product substitutes, primarily silicon-based power devices, are facing increasing pressure from GaN's superior performance metrics like higher switching frequencies, reduced power loss, and smaller form factors. End-user demographics are shifting towards industries demanding high-efficiency power solutions, such as automotive electrification and advanced ICT infrastructure. Mergers and acquisitions (M&A) are emerging as a strategy for established semiconductor companies to gain access to GaN expertise and intellectual property.
- Market Concentration: Dominated by a few key players with significant IP and manufacturing capabilities, but a growing number of new entrants.
- Technological Innovation Drivers: Demand for higher efficiency, smaller power supplies, faster charging, and advanced RF communication.
- Regulatory Frameworks: Stringent energy efficiency standards globally are a major catalyst for GaN adoption.
- Competitive Product Substitutes: Silicon-based MOSFETs and IGBTs, facing increasing obsolescence in high-performance applications.
- End-User Demographics: Rapid growth in Electric Vehicles (EVs), 5G infrastructure, data centers, and portable consumer electronics.
- M&A Trends: Strategic acquisitions by larger semiconductor firms to integrate GaN technology and expand market reach.
- Innovation Barriers: High manufacturing costs, reliability concerns in certain applications, and the need for specialized design expertise.
GaN Industry Growth Trends & Insights
The GaN industry is poised for exponential growth, fueled by its inherent superior performance characteristics compared to traditional silicon. Market size evolution indicates a robust upward trajectory, with adoption rates accelerating across diverse end-user sectors. Technological disruptions, particularly in power conversion and RF amplification, are fundamentally reshaping product design and functionality. Consumer behavior shifts towards more energy-conscious and performance-driven devices further propel GaN adoption. The forecast period anticipates a compound annual growth rate (CAGR) of approximately 25-30%, driven by increasing demand in electric mobility, renewable energy systems, and high-speed communication networks. Market penetration is expected to surge as manufacturing costs decline and GaN's advantages become more widely understood and implemented.
The increasing demand for higher power density and greater energy efficiency across various industries is the primary catalyst for the GaN market's rapid expansion. From consumer electronics, where fast charging and miniaturized power adapters are becoming standard, to the burgeoning electric vehicle market, where GaN components enable lighter, more efficient powertrains and charging infrastructure, the impact is profound. The Information Communication and Technology (ICT) sector, with its insatiable need for high-performance, low-loss components for data centers, 5G base stations, and advanced networking equipment, represents another significant growth engine. Furthermore, the aerospace and defense sector's requirements for robust, lightweight, and high-temperature tolerant solutions are increasingly being met by GaN technology.
The historical period from 2019 to 2024 has witnessed a steady rise in GaN adoption, transitioning from niche applications to more mainstream ones. Early adoption in high-frequency RF applications for telecommunications and military radar laid the groundwork, demonstrating GaN's unparalleled capabilities in these demanding fields. The subsequent development of high-voltage and high-efficiency GaN power devices has broadened its appeal, making it a compelling alternative to silicon in power supplies, inverters, and converters. This period has been marked by continuous improvements in material quality, device fabrication processes, and packaging technologies, all contributing to enhanced reliability and reduced costs. The estimated market size for 2025 is projected to be approximately $1.5 billion, with substantial growth anticipated in the coming decade.
The forecast period (2025–2033) is expected to witness an acceleration in GaN market penetration, as economies of scale are realized and widespread integration becomes more feasible. This sustained growth will be driven by ongoing technological advancements, such as the development of even higher voltage GaN transistors, novel device architectures, and improved integration capabilities. The increasing focus on sustainability and carbon footprint reduction across industries will further incentivize the adoption of GaN, given its ability to significantly reduce energy losses in power systems. The total market potential is vast, with GaN poised to capture a significant share of the global power semiconductor market.
Dominant Regions, Countries, or Segments in GaN Industry
The Power Semiconductors segment, within the broader GaN industry, is currently the dominant force driving market growth. This dominance is underpinned by the immense demand for high-efficiency power conversion solutions across a multitude of end-user industries. The proliferation of electric vehicles, the expansion of renewable energy grids, and the ever-increasing power requirements of data centers are all heavily reliant on advanced power semiconductor technology, making GaN a critical enabler for these sectors.
- Dominant Segment: Power Semiconductors.
- Key Devices: Transistors, Rectifiers, and Power ICs are witnessing substantial demand.
- End-User Industry Drivers: Automotive (EV powertrains, onboard chargers), Consumer Electronics (fast chargers, power adapters), and Information Communication and Technology (data centers, power supplies).
- Market Share: Power Semiconductors are estimated to hold over 70% of the total GaN market share in 2025.
- Growth Potential: The sub-segments within power semiconductors, such as high-voltage transistors and integrated power modules, are expected to exhibit a CAGR of over 28% from 2025-2033.
North America and Asia Pacific are leading regions in GaN adoption, driven by robust technological ecosystems, significant investments in R&D, and strong governmental support for advanced manufacturing and electrification initiatives. In North America, the United States, with its leading technology companies and strong automotive sector, is a major contributor. Asia Pacific, particularly China, Japan, and South Korea, benefits from a highly developed electronics manufacturing base and aggressive adoption of new technologies for consumer electronics and telecommunications.
- Leading Region: Asia Pacific.
- Key Countries: China, Japan, South Korea.
- Dominance Factors: Extensive electronics manufacturing capabilities, strong government initiatives for high-tech industries, and a massive consumer market for electronics.
- Market Share: Asia Pacific is projected to account for approximately 45% of the global GaN market share in 2025.
- Economic Policies: Favorable policies supporting semiconductor manufacturing and R&D, along with significant domestic demand.
The Automotive industry is emerging as a critical growth driver, with the transition to electric vehicles necessitating high-efficiency, lightweight, and compact power electronics. GaN's ability to operate at higher frequencies and temperatures translates to smaller, more efficient onboard chargers, inverters, and DC-DC converters, directly impacting vehicle range and performance. The Information Communication and Technology (ICT) sector, encompassing data centers and 5G infrastructure, also presents substantial growth opportunities due to the demand for reduced energy consumption and increased data processing capabilities.
- Emerging Growth Driver: Automotive Industry.
- Impact: Enables lighter, more efficient EVs with extended range and faster charging capabilities.
- Key Applications: Onboard chargers, DC-DC converters, motor controllers.
- Market Penetration: GaN adoption in automotive power electronics is projected to grow from approximately 5% in 2025 to over 20% by 2033.
GaN Industry Product Landscape
The GaN industry is characterized by continuous product innovation, focusing on enhancing performance metrics like switching speed, power density, and thermal management. GaN transistors and diodes are leading the charge, enabling significantly smaller and more efficient power adapters for consumer electronics, high-frequency components for advanced communication systems, and robust power solutions for electric vehicles. These products offer unique selling propositions such as lower on-resistance, reduced parasitic capacitance, and operation at higher voltages, leading to substantial energy savings and miniaturization of electronic devices. Technological advancements in epitaxy, device architecture, and packaging are further pushing the boundaries of GaN performance.
Key Drivers, Barriers & Challenges in GaN Industry
The GaN industry is propelled by the unrelenting demand for higher energy efficiency and reduced power consumption across all sectors. Technological advancements that enable smaller, lighter, and more powerful electronic devices are key drivers. Government regulations mandating stricter energy efficiency standards globally are also significantly boosting GaN adoption. Furthermore, the rapid growth of electric vehicles and 5G infrastructure creates a substantial market pull for GaN's superior performance capabilities.
- Key Drivers:
- Energy Efficiency Demands: Reducing power loss in electronic systems.
- Miniaturization: Enabling smaller and lighter devices.
- Performance Advantages: Higher switching frequencies, faster response times.
- Regulatory Mandates: Stringent energy efficiency standards.
- Emerging Applications: Electric vehicles, 5G, data centers.
However, the GaN market faces significant barriers and challenges. The high manufacturing cost of GaN wafers and the complex fabrication processes remain a primary restraint. Supply chain issues, particularly the availability of raw materials and specialized manufacturing equipment, can also impact production volumes and lead times. Regulatory hurdles related to environmental impact and material sourcing, along with intense competition from established silicon-based technologies, also pose challenges.
- Key Barriers & Challenges:
- High Manufacturing Costs: Compared to silicon.
- Supply Chain Constraints: Availability of raw materials and equipment.
- Technical Expertise: Need for specialized design and manufacturing skills.
- Reliability Concerns: Historically, some concerns in specific harsh environments.
- Competition from Silicon: Established market presence and cost advantages of silicon.
Emerging Opportunities in GaN Industry
Emerging opportunities within the GaN industry lie in the expansion into new application areas and the development of integrated GaN solutions. The increasing demand for efficient power management in renewable energy systems, such as solar inverters and wind turbines, presents a vast untapped market. Furthermore, the development of advanced GaN-based sensors and actuators for industrial automation and robotics offers significant potential. The convergence of GaN technology with other emerging technologies like artificial intelligence and the Internet of Things (IoT) will unlock novel applications in smart grids, wearable technology, and advanced medical devices.
Growth Accelerators in the GaN Industry Industry
Several factors are accelerating the long-term growth of the GaN industry. Continued breakthroughs in material science and fabrication techniques are leading to improved device performance and reduced manufacturing costs, making GaN more competitive with silicon. Strategic partnerships between GaN component manufacturers and system integrators are fostering innovation and accelerating product development cycles. Market expansion strategies targeting new geographical regions and emerging applications, coupled with robust investment in research and development, will further fuel this growth trajectory.
Key Players Shaping the GaN Industry Market
- Efficient Power Conversion Corporation
- Infineon Technologies AG
- Microchip Technology Inc
- GaN Systems
- NexGen Power Systems
- NXP Semiconductors
- Wolfspeed Inc
- Toshiba Electronic Devices & Storage Corporation
- Soitec
- Qorvo Inc
- Texas Instruments Incorporated
- NTT Advanced Technology Corporation
Notable Milestones in GaN Industry Sector
- Jan 2024: Silvaco Group, Inc. partnered with GaN Valley to advance GaN power device design using its Victory TCAD platform, enhancing simulation capabilities for optimization.
- July 2023: STMicroelectronics commenced large-scale manufacturing of e-mode PowerGaN HEMT devices, improving the efficiency of power conversion systems across chargers, industrial supplies, and automotive applications.
In-Depth GaN Industry Market Outlook
The GaN industry's market outlook is exceptionally promising, driven by its intrinsic ability to deliver superior performance in power and RF applications. Future market potential is anchored in the continuous evolution of electric mobility, the expansion of 5G networks, and the growing demand for energy-efficient data centers. Strategic opportunities lie in developing highly integrated GaN power modules, exploring new materials for enhanced performance, and expanding into niche markets like aerospace and medical devices. The industry's growth will be significantly amplified by ongoing technological innovations, strategic collaborations, and a global push towards sustainable energy solutions.
GaN Industry Segmentation
-
1. Type
- 1.1. Power Semiconductors
- 1.2. Opto-Semiconductors
- 1.3. RF Semiconductors
-
2. Devices
- 2.1. Transistors
- 2.2. Diodes
- 2.3. Rectifiers
- 2.4. Power ICs
-
3. End-user Industry
- 3.1. Automotive
- 3.2. Consumer Electronics
- 3.3. Aerospace and Defense
- 3.4. Medical
- 3.5. Information Communication and Technology
- 3.6. Other End-user Industries
GaN Industry Segmentation By Geography
- 1. United States
- 2. Europe
- 3. Japan
- 4. China
- 5. Korea
- 6. Taiwan
- 7. Latin America
- 8. Middle East and Africa
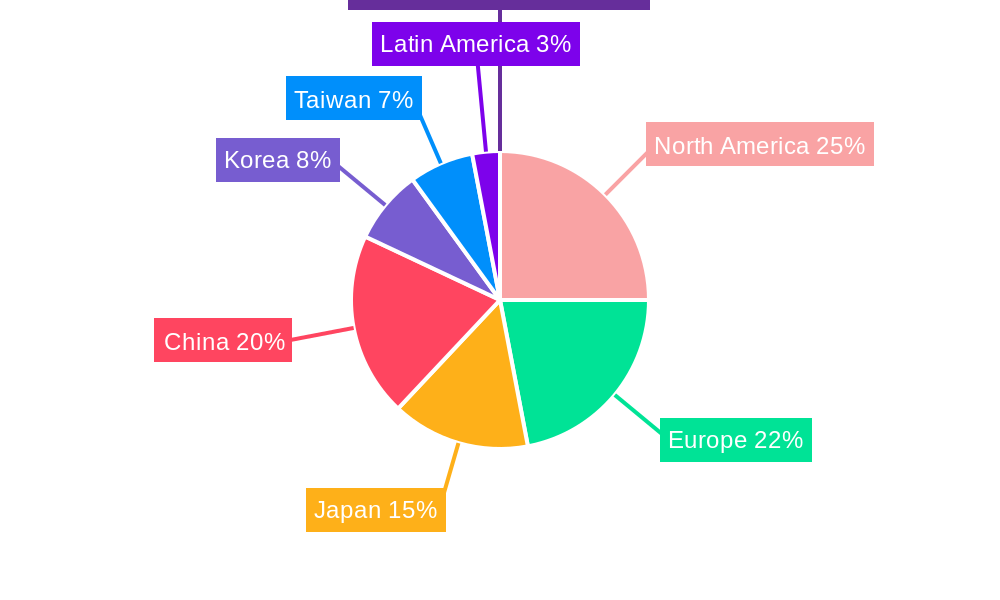
GaN Industry Regional Market Share
Geographic Coverage of GaN Industry
GaN Industry REPORT HIGHLIGHTS
| Aspects | Details |
|---|---|
| Study Period | 2020-2034 |
| Base Year | 2025 |
| Estimated Year | 2026 |
| Forecast Period | 2026-2034 |
| Historical Period | 2020-2025 |
| Growth Rate | CAGR of 6.06% from 2020-2034 |
| Segmentation |
|
Table of Contents
- 1. Introduction
- 1.1. Research Scope
- 1.2. Market Segmentation
- 1.3. Research Objective
- 1.4. Definitions and Assumptions
- 2. Executive Summary
- 2.1. Market Snapshot
- 3. Market Dynamics
- 3.1. Market Drivers
- 3.2. Market Restrains
- 3.3. Market Trends
- 3.4. Market Opportunities
- 4. Market Factor Analysis
- 4.1. Porters Five Forces
- 4.1.1. Bargaining Power of Suppliers
- 4.1.2. Bargaining Power of Buyers
- 4.1.3. Threat of New Entrants
- 4.1.4. Threat of Substitutes
- 4.1.5. Competitive Rivalry
- 4.2. PESTEL analysis
- 4.3. BCG Analysis
- 4.3.1. Stars (High Growth, High Market Share)
- 4.3.2. Cash Cows (Low Growth, High Market Share)
- 4.3.3. Question Mark (High Growth, Low Market Share)
- 4.3.4. Dogs (Low Growth, Low Market Share)
- 4.4. Ansoff Matrix Analysis
- 4.5. Supply Chain Analysis
- 4.6. Regulatory Landscape
- 4.7. Current Market Potential and Opportunity Assessment (TAM–SAM–SOM Framework)
- 4.8. VDR Analyst Note
- 4.1. Porters Five Forces
- 5. Market Analysis, Insights and Forecast 2021-2033
- 5.1. Market Analysis, Insights and Forecast - by Type
- 5.1.1. Power Semiconductors
- 5.1.2. Opto-Semiconductors
- 5.1.3. RF Semiconductors
- 5.2. Market Analysis, Insights and Forecast - by Devices
- 5.2.1. Transistors
- 5.2.2. Diodes
- 5.2.3. Rectifiers
- 5.2.4. Power ICs
- 5.3. Market Analysis, Insights and Forecast - by End-user Industry
- 5.3.1. Automotive
- 5.3.2. Consumer Electronics
- 5.3.3. Aerospace and Defense
- 5.3.4. Medical
- 5.3.5. Information Communication and Technology
- 5.3.6. Other End-user Industries
- 5.4. Market Analysis, Insights and Forecast - by Region
- 5.4.1. United States
- 5.4.2. Europe
- 5.4.3. Japan
- 5.4.4. China
- 5.4.5. Korea
- 5.4.6. Taiwan
- 5.4.7. Latin America
- 5.4.8. Middle East and Africa
- 5.1. Market Analysis, Insights and Forecast - by Type
- 6. Global GaN Industry Analysis, Insights and Forecast, 2021-2033
- 6.1. Market Analysis, Insights and Forecast - by Type
- 6.1.1. Power Semiconductors
- 6.1.2. Opto-Semiconductors
- 6.1.3. RF Semiconductors
- 6.2. Market Analysis, Insights and Forecast - by Devices
- 6.2.1. Transistors
- 6.2.2. Diodes
- 6.2.3. Rectifiers
- 6.2.4. Power ICs
- 6.3. Market Analysis, Insights and Forecast - by End-user Industry
- 6.3.1. Automotive
- 6.3.2. Consumer Electronics
- 6.3.3. Aerospace and Defense
- 6.3.4. Medical
- 6.3.5. Information Communication and Technology
- 6.3.6. Other End-user Industries
- 6.1. Market Analysis, Insights and Forecast - by Type
- 7. United States GaN Industry Analysis, Insights and Forecast, 2021-2033
- 7.1. Market Analysis, Insights and Forecast - by Type
- 7.1.1. Power Semiconductors
- 7.1.2. Opto-Semiconductors
- 7.1.3. RF Semiconductors
- 7.2. Market Analysis, Insights and Forecast - by Devices
- 7.2.1. Transistors
- 7.2.2. Diodes
- 7.2.3. Rectifiers
- 7.2.4. Power ICs
- 7.3. Market Analysis, Insights and Forecast - by End-user Industry
- 7.3.1. Automotive
- 7.3.2. Consumer Electronics
- 7.3.3. Aerospace and Defense
- 7.3.4. Medical
- 7.3.5. Information Communication and Technology
- 7.3.6. Other End-user Industries
- 7.1. Market Analysis, Insights and Forecast - by Type
- 8. Europe GaN Industry Analysis, Insights and Forecast, 2021-2033
- 8.1. Market Analysis, Insights and Forecast - by Type
- 8.1.1. Power Semiconductors
- 8.1.2. Opto-Semiconductors
- 8.1.3. RF Semiconductors
- 8.2. Market Analysis, Insights and Forecast - by Devices
- 8.2.1. Transistors
- 8.2.2. Diodes
- 8.2.3. Rectifiers
- 8.2.4. Power ICs
- 8.3. Market Analysis, Insights and Forecast - by End-user Industry
- 8.3.1. Automotive
- 8.3.2. Consumer Electronics
- 8.3.3. Aerospace and Defense
- 8.3.4. Medical
- 8.3.5. Information Communication and Technology
- 8.3.6. Other End-user Industries
- 8.1. Market Analysis, Insights and Forecast - by Type
- 9. Japan GaN Industry Analysis, Insights and Forecast, 2021-2033
- 9.1. Market Analysis, Insights and Forecast - by Type
- 9.1.1. Power Semiconductors
- 9.1.2. Opto-Semiconductors
- 9.1.3. RF Semiconductors
- 9.2. Market Analysis, Insights and Forecast - by Devices
- 9.2.1. Transistors
- 9.2.2. Diodes
- 9.2.3. Rectifiers
- 9.2.4. Power ICs
- 9.3. Market Analysis, Insights and Forecast - by End-user Industry
- 9.3.1. Automotive
- 9.3.2. Consumer Electronics
- 9.3.3. Aerospace and Defense
- 9.3.4. Medical
- 9.3.5. Information Communication and Technology
- 9.3.6. Other End-user Industries
- 9.1. Market Analysis, Insights and Forecast - by Type
- 10. China GaN Industry Analysis, Insights and Forecast, 2021-2033
- 10.1. Market Analysis, Insights and Forecast - by Type
- 10.1.1. Power Semiconductors
- 10.1.2. Opto-Semiconductors
- 10.1.3. RF Semiconductors
- 10.2. Market Analysis, Insights and Forecast - by Devices
- 10.2.1. Transistors
- 10.2.2. Diodes
- 10.2.3. Rectifiers
- 10.2.4. Power ICs
- 10.3. Market Analysis, Insights and Forecast - by End-user Industry
- 10.3.1. Automotive
- 10.3.2. Consumer Electronics
- 10.3.3. Aerospace and Defense
- 10.3.4. Medical
- 10.3.5. Information Communication and Technology
- 10.3.6. Other End-user Industries
- 10.1. Market Analysis, Insights and Forecast - by Type
- 11. Korea GaN Industry Analysis, Insights and Forecast, 2021-2033
- 11.1. Market Analysis, Insights and Forecast - by Type
- 11.1.1. Power Semiconductors
- 11.1.2. Opto-Semiconductors
- 11.1.3. RF Semiconductors
- 11.2. Market Analysis, Insights and Forecast - by Devices
- 11.2.1. Transistors
- 11.2.2. Diodes
- 11.2.3. Rectifiers
- 11.2.4. Power ICs
- 11.3. Market Analysis, Insights and Forecast - by End-user Industry
- 11.3.1. Automotive
- 11.3.2. Consumer Electronics
- 11.3.3. Aerospace and Defense
- 11.3.4. Medical
- 11.3.5. Information Communication and Technology
- 11.3.6. Other End-user Industries
- 11.1. Market Analysis, Insights and Forecast - by Type
- 12. Taiwan GaN Industry Analysis, Insights and Forecast, 2021-2033
- 12.1. Market Analysis, Insights and Forecast - by Type
- 12.1.1. Power Semiconductors
- 12.1.2. Opto-Semiconductors
- 12.1.3. RF Semiconductors
- 12.2. Market Analysis, Insights and Forecast - by Devices
- 12.2.1. Transistors
- 12.2.2. Diodes
- 12.2.3. Rectifiers
- 12.2.4. Power ICs
- 12.3. Market Analysis, Insights and Forecast - by End-user Industry
- 12.3.1. Automotive
- 12.3.2. Consumer Electronics
- 12.3.3. Aerospace and Defense
- 12.3.4. Medical
- 12.3.5. Information Communication and Technology
- 12.3.6. Other End-user Industries
- 12.1. Market Analysis, Insights and Forecast - by Type
- 13. Latin America GaN Industry Analysis, Insights and Forecast, 2021-2033
- 13.1. Market Analysis, Insights and Forecast - by Type
- 13.1.1. Power Semiconductors
- 13.1.2. Opto-Semiconductors
- 13.1.3. RF Semiconductors
- 13.2. Market Analysis, Insights and Forecast - by Devices
- 13.2.1. Transistors
- 13.2.2. Diodes
- 13.2.3. Rectifiers
- 13.2.4. Power ICs
- 13.3. Market Analysis, Insights and Forecast - by End-user Industry
- 13.3.1. Automotive
- 13.3.2. Consumer Electronics
- 13.3.3. Aerospace and Defense
- 13.3.4. Medical
- 13.3.5. Information Communication and Technology
- 13.3.6. Other End-user Industries
- 13.1. Market Analysis, Insights and Forecast - by Type
- 14. Middle East and Africa GaN Industry Analysis, Insights and Forecast, 2021-2033
- 14.1. Market Analysis, Insights and Forecast - by Type
- 14.1.1. Power Semiconductors
- 14.1.2. Opto-Semiconductors
- 14.1.3. RF Semiconductors
- 14.2. Market Analysis, Insights and Forecast - by Devices
- 14.2.1. Transistors
- 14.2.2. Diodes
- 14.2.3. Rectifiers
- 14.2.4. Power ICs
- 14.3. Market Analysis, Insights and Forecast - by End-user Industry
- 14.3.1. Automotive
- 14.3.2. Consumer Electronics
- 14.3.3. Aerospace and Defense
- 14.3.4. Medical
- 14.3.5. Information Communication and Technology
- 14.3.6. Other End-user Industries
- 14.1. Market Analysis, Insights and Forecast - by Type
- 15. Competitive Analysis
- 15.1. Company Profiles
- 15.1.1 Efficient Power Conversion Corporation
- 15.1.1.1. Company Overview
- 15.1.1.2. Products
- 15.1.1.3. Company Financials
- 15.1.1.4. SWOT Analysis
- 15.1.2 Infineon Technologies AG
- 15.1.2.1. Company Overview
- 15.1.2.2. Products
- 15.1.2.3. Company Financials
- 15.1.2.4. SWOT Analysis
- 15.1.3 Microchip Technology Inc
- 15.1.3.1. Company Overview
- 15.1.3.2. Products
- 15.1.3.3. Company Financials
- 15.1.3.4. SWOT Analysis
- 15.1.4 GaN Systems
- 15.1.4.1. Company Overview
- 15.1.4.2. Products
- 15.1.4.3. Company Financials
- 15.1.4.4. SWOT Analysis
- 15.1.5 NexGen Power Systems
- 15.1.5.1. Company Overview
- 15.1.5.2. Products
- 15.1.5.3. Company Financials
- 15.1.5.4. SWOT Analysis
- 15.1.6 NXP Semiconductors
- 15.1.6.1. Company Overview
- 15.1.6.2. Products
- 15.1.6.3. Company Financials
- 15.1.6.4. SWOT Analysis
- 15.1.7 Wolfspeed Inc
- 15.1.7.1. Company Overview
- 15.1.7.2. Products
- 15.1.7.3. Company Financials
- 15.1.7.4. SWOT Analysis
- 15.1.8 Toshiba Electronic Devices & Storage Corporation
- 15.1.8.1. Company Overview
- 15.1.8.2. Products
- 15.1.8.3. Company Financials
- 15.1.8.4. SWOT Analysis
- 15.1.9 Soitec
- 15.1.9.1. Company Overview
- 15.1.9.2. Products
- 15.1.9.3. Company Financials
- 15.1.9.4. SWOT Analysis
- 15.1.10 Qorvo Inc
- 15.1.10.1. Company Overview
- 15.1.10.2. Products
- 15.1.10.3. Company Financials
- 15.1.10.4. SWOT Analysis
- 15.1.11 Texas Instruments Incorporated
- 15.1.11.1. Company Overview
- 15.1.11.2. Products
- 15.1.11.3. Company Financials
- 15.1.11.4. SWOT Analysis
- 15.1.12 NTT Advanced Technology Corporation*List Not Exhaustive
- 15.1.12.1. Company Overview
- 15.1.12.2. Products
- 15.1.12.3. Company Financials
- 15.1.12.4. SWOT Analysis
- 15.1.1 Efficient Power Conversion Corporation
- 15.2. Market Entropy
- 15.2.1 Company's Key Areas Served
- 15.2.2 Recent Developments
- 15.3. Company Market Share Analysis 2025
- 15.3.1 Top 5 Companies Market Share Analysis
- 15.3.2 Top 3 Companies Market Share Analysis
- 15.4. List of Potential Customers
- 16. Research Methodology
List of Figures
- Figure 1: Global GaN Industry Revenue Breakdown (Million, %) by Region 2025 & 2033
- Figure 2: United States GaN Industry Revenue (Million), by Type 2025 & 2033
- Figure 3: United States GaN Industry Revenue Share (%), by Type 2025 & 2033
- Figure 4: United States GaN Industry Revenue (Million), by Devices 2025 & 2033
- Figure 5: United States GaN Industry Revenue Share (%), by Devices 2025 & 2033
- Figure 6: United States GaN Industry Revenue (Million), by End-user Industry 2025 & 2033
- Figure 7: United States GaN Industry Revenue Share (%), by End-user Industry 2025 & 2033
- Figure 8: United States GaN Industry Revenue (Million), by Country 2025 & 2033
- Figure 9: United States GaN Industry Revenue Share (%), by Country 2025 & 2033
- Figure 10: Europe GaN Industry Revenue (Million), by Type 2025 & 2033
- Figure 11: Europe GaN Industry Revenue Share (%), by Type 2025 & 2033
- Figure 12: Europe GaN Industry Revenue (Million), by Devices 2025 & 2033
- Figure 13: Europe GaN Industry Revenue Share (%), by Devices 2025 & 2033
- Figure 14: Europe GaN Industry Revenue (Million), by End-user Industry 2025 & 2033
- Figure 15: Europe GaN Industry Revenue Share (%), by End-user Industry 2025 & 2033
- Figure 16: Europe GaN Industry Revenue (Million), by Country 2025 & 2033
- Figure 17: Europe GaN Industry Revenue Share (%), by Country 2025 & 2033
- Figure 18: Japan GaN Industry Revenue (Million), by Type 2025 & 2033
- Figure 19: Japan GaN Industry Revenue Share (%), by Type 2025 & 2033
- Figure 20: Japan GaN Industry Revenue (Million), by Devices 2025 & 2033
- Figure 21: Japan GaN Industry Revenue Share (%), by Devices 2025 & 2033
- Figure 22: Japan GaN Industry Revenue (Million), by End-user Industry 2025 & 2033
- Figure 23: Japan GaN Industry Revenue Share (%), by End-user Industry 2025 & 2033
- Figure 24: Japan GaN Industry Revenue (Million), by Country 2025 & 2033
- Figure 25: Japan GaN Industry Revenue Share (%), by Country 2025 & 2033
- Figure 26: China GaN Industry Revenue (Million), by Type 2025 & 2033
- Figure 27: China GaN Industry Revenue Share (%), by Type 2025 & 2033
- Figure 28: China GaN Industry Revenue (Million), by Devices 2025 & 2033
- Figure 29: China GaN Industry Revenue Share (%), by Devices 2025 & 2033
- Figure 30: China GaN Industry Revenue (Million), by End-user Industry 2025 & 2033
- Figure 31: China GaN Industry Revenue Share (%), by End-user Industry 2025 & 2033
- Figure 32: China GaN Industry Revenue (Million), by Country 2025 & 2033
- Figure 33: China GaN Industry Revenue Share (%), by Country 2025 & 2033
- Figure 34: Korea GaN Industry Revenue (Million), by Type 2025 & 2033
- Figure 35: Korea GaN Industry Revenue Share (%), by Type 2025 & 2033
- Figure 36: Korea GaN Industry Revenue (Million), by Devices 2025 & 2033
- Figure 37: Korea GaN Industry Revenue Share (%), by Devices 2025 & 2033
- Figure 38: Korea GaN Industry Revenue (Million), by End-user Industry 2025 & 2033
- Figure 39: Korea GaN Industry Revenue Share (%), by End-user Industry 2025 & 2033
- Figure 40: Korea GaN Industry Revenue (Million), by Country 2025 & 2033
- Figure 41: Korea GaN Industry Revenue Share (%), by Country 2025 & 2033
- Figure 42: Taiwan GaN Industry Revenue (Million), by Type 2025 & 2033
- Figure 43: Taiwan GaN Industry Revenue Share (%), by Type 2025 & 2033
- Figure 44: Taiwan GaN Industry Revenue (Million), by Devices 2025 & 2033
- Figure 45: Taiwan GaN Industry Revenue Share (%), by Devices 2025 & 2033
- Figure 46: Taiwan GaN Industry Revenue (Million), by End-user Industry 2025 & 2033
- Figure 47: Taiwan GaN Industry Revenue Share (%), by End-user Industry 2025 & 2033
- Figure 48: Taiwan GaN Industry Revenue (Million), by Country 2025 & 2033
- Figure 49: Taiwan GaN Industry Revenue Share (%), by Country 2025 & 2033
- Figure 50: Latin America GaN Industry Revenue (Million), by Type 2025 & 2033
- Figure 51: Latin America GaN Industry Revenue Share (%), by Type 2025 & 2033
- Figure 52: Latin America GaN Industry Revenue (Million), by Devices 2025 & 2033
- Figure 53: Latin America GaN Industry Revenue Share (%), by Devices 2025 & 2033
- Figure 54: Latin America GaN Industry Revenue (Million), by End-user Industry 2025 & 2033
- Figure 55: Latin America GaN Industry Revenue Share (%), by End-user Industry 2025 & 2033
- Figure 56: Latin America GaN Industry Revenue (Million), by Country 2025 & 2033
- Figure 57: Latin America GaN Industry Revenue Share (%), by Country 2025 & 2033
- Figure 58: Middle East and Africa GaN Industry Revenue (Million), by Type 2025 & 2033
- Figure 59: Middle East and Africa GaN Industry Revenue Share (%), by Type 2025 & 2033
- Figure 60: Middle East and Africa GaN Industry Revenue (Million), by Devices 2025 & 2033
- Figure 61: Middle East and Africa GaN Industry Revenue Share (%), by Devices 2025 & 2033
- Figure 62: Middle East and Africa GaN Industry Revenue (Million), by End-user Industry 2025 & 2033
- Figure 63: Middle East and Africa GaN Industry Revenue Share (%), by End-user Industry 2025 & 2033
- Figure 64: Middle East and Africa GaN Industry Revenue (Million), by Country 2025 & 2033
- Figure 65: Middle East and Africa GaN Industry Revenue Share (%), by Country 2025 & 2033
List of Tables
- Table 1: Global GaN Industry Revenue Million Forecast, by Type 2020 & 2033
- Table 2: Global GaN Industry Revenue Million Forecast, by Devices 2020 & 2033
- Table 3: Global GaN Industry Revenue Million Forecast, by End-user Industry 2020 & 2033
- Table 4: Global GaN Industry Revenue Million Forecast, by Region 2020 & 2033
- Table 5: Global GaN Industry Revenue Million Forecast, by Type 2020 & 2033
- Table 6: Global GaN Industry Revenue Million Forecast, by Devices 2020 & 2033
- Table 7: Global GaN Industry Revenue Million Forecast, by End-user Industry 2020 & 2033
- Table 8: Global GaN Industry Revenue Million Forecast, by Country 2020 & 2033
- Table 9: Global GaN Industry Revenue Million Forecast, by Type 2020 & 2033
- Table 10: Global GaN Industry Revenue Million Forecast, by Devices 2020 & 2033
- Table 11: Global GaN Industry Revenue Million Forecast, by End-user Industry 2020 & 2033
- Table 12: Global GaN Industry Revenue Million Forecast, by Country 2020 & 2033
- Table 13: Global GaN Industry Revenue Million Forecast, by Type 2020 & 2033
- Table 14: Global GaN Industry Revenue Million Forecast, by Devices 2020 & 2033
- Table 15: Global GaN Industry Revenue Million Forecast, by End-user Industry 2020 & 2033
- Table 16: Global GaN Industry Revenue Million Forecast, by Country 2020 & 2033
- Table 17: Global GaN Industry Revenue Million Forecast, by Type 2020 & 2033
- Table 18: Global GaN Industry Revenue Million Forecast, by Devices 2020 & 2033
- Table 19: Global GaN Industry Revenue Million Forecast, by End-user Industry 2020 & 2033
- Table 20: Global GaN Industry Revenue Million Forecast, by Country 2020 & 2033
- Table 21: Global GaN Industry Revenue Million Forecast, by Type 2020 & 2033
- Table 22: Global GaN Industry Revenue Million Forecast, by Devices 2020 & 2033
- Table 23: Global GaN Industry Revenue Million Forecast, by End-user Industry 2020 & 2033
- Table 24: Global GaN Industry Revenue Million Forecast, by Country 2020 & 2033
- Table 25: Global GaN Industry Revenue Million Forecast, by Type 2020 & 2033
- Table 26: Global GaN Industry Revenue Million Forecast, by Devices 2020 & 2033
- Table 27: Global GaN Industry Revenue Million Forecast, by End-user Industry 2020 & 2033
- Table 28: Global GaN Industry Revenue Million Forecast, by Country 2020 & 2033
- Table 29: Global GaN Industry Revenue Million Forecast, by Type 2020 & 2033
- Table 30: Global GaN Industry Revenue Million Forecast, by Devices 2020 & 2033
- Table 31: Global GaN Industry Revenue Million Forecast, by End-user Industry 2020 & 2033
- Table 32: Global GaN Industry Revenue Million Forecast, by Country 2020 & 2033
- Table 33: Global GaN Industry Revenue Million Forecast, by Type 2020 & 2033
- Table 34: Global GaN Industry Revenue Million Forecast, by Devices 2020 & 2033
- Table 35: Global GaN Industry Revenue Million Forecast, by End-user Industry 2020 & 2033
- Table 36: Global GaN Industry Revenue Million Forecast, by Country 2020 & 2033
Frequently Asked Questions
1. What is the projected Compound Annual Growth Rate (CAGR) of the GaN Industry?
The projected CAGR is approximately 6.06%.
2. Which companies are prominent players in the GaN Industry?
Key companies in the market include Efficient Power Conversion Corporation, Infineon Technologies AG, Microchip Technology Inc, GaN Systems, NexGen Power Systems, NXP Semiconductors, Wolfspeed Inc, Toshiba Electronic Devices & Storage Corporation, Soitec, Qorvo Inc, Texas Instruments Incorporated, NTT Advanced Technology Corporation*List Not Exhaustive.
3. What are the main segments of the GaN Industry?
The market segments include Type, Devices, End-user Industry.
4. Can you provide details about the market size?
The market size is estimated to be USD 21.18 Million as of 2022.
5. What are some drivers contributing to market growth?
Strong Demand from Telecom Infrastructure Segment Driven by Advancements in 5G Implementation; Favorable Attributes Such As High-performance and Small Form Factor to Drive Adoption in the Military Segment.
6. What are the notable trends driving market growth?
Consumer Electronics to Hold Significant Market Share.
7. Are there any restraints impacting market growth?
; Declining Volume of Traditional Mails; High Adoption Costs.
8. Can you provide examples of recent developments in the market?
Jan 2024: Silvaco Group, Inc., a leading provider of TCAD, EDA software, and design IP, partnered with GaN Valley to drive advancements in efficient gallium nitride (GaN) power device design. By leveraging its Victory TCAD platform, Silvaco aims to empower customers to innovate and optimize performance in GaN-based semiconductor power devices. The Victory TCAD platform offers a comprehensive simulation environment, incorporating diverse numerical methods, physical models, SPICE model generation, and a user-friendly graphical interface, tailored specifically for the latest generation of GaN-based power devices.
9. What pricing options are available for accessing the report?
Pricing options include single-user, multi-user, and enterprise licenses priced at USD 4750, USD 5250, and USD 8750 respectively.
10. Is the market size provided in terms of value or volume?
The market size is provided in terms of value, measured in Million.
11. Are there any specific market keywords associated with the report?
Yes, the market keyword associated with the report is "GaN Industry," which aids in identifying and referencing the specific market segment covered.
12. How do I determine which pricing option suits my needs best?
The pricing options vary based on user requirements and access needs. Individual users may opt for single-user licenses, while businesses requiring broader access may choose multi-user or enterprise licenses for cost-effective access to the report.
13. Are there any additional resources or data provided in the GaN Industry report?
While the report offers comprehensive insights, it's advisable to review the specific contents or supplementary materials provided to ascertain if additional resources or data are available.
14. How can I stay updated on further developments or reports in the GaN Industry?
To stay informed about further developments, trends, and reports in the GaN Industry, consider subscribing to industry newsletters, following relevant companies and organizations, or regularly checking reputable industry news sources and publications.
Methodology
Step 1 - Identification of Relevant Samples Size from Population Database


Step 2 - Approaches for Defining Global Market Size (Value, Volume* & Price*)

Note*: In applicable scenarios
Step 3 - Data Sources
Primary Research
- Web Analytics
- Survey Reports
- Research Institute
- Latest Research Reports
- Opinion Leaders
Secondary Research
- Annual Reports
- White Paper
- Latest Press Release
- Industry Association
- Paid Database
- Investor Presentations

Step 4 - Data Triangulation
Involves using different sources of information in order to increase the validity of a study
These sources are likely to be stakeholders in a program - participants, other researchers, program staff, other community members, and so on.
Then we put all data in single framework & apply various statistical tools to find out the dynamic on the market.
During the analysis stage, feedback from the stakeholder groups would be compared to determine areas of agreement as well as areas of divergence