

Key Insights
The global fumaric acid market, valued at approximately $106.6 million in 2025, is projected to experience robust growth, exhibiting a compound annual growth rate (CAGR) of 5.41% from 2025 to 2033. This expansion is primarily driven by escalating demand within the food and beverage sector, where fumaric acid serves as a key acidulant and functional food additive. Its increasing adoption in pharmaceuticals and cosmetics, alongside its integral role in unsaturated polyester and alkyd resins, further bolsters market growth. The technical grade segment is anticipated to lead market expansion due to its widespread industrial utility. Geographically, the Asia Pacific region, notably China and India, is expected to dominate market share, propelled by their rapidly advancing food processing and manufacturing industries. Potential challenges include raw material price volatility and evolving regulatory landscapes for food additives. Intense competition among established and emerging manufacturers will continue to shape market dynamics. The forecast period (2025-2033) anticipates sustained demand driven by application innovation and expanding end-user industries. Sector and regional growth will be influenced by economic performance, technological progress, and evolving consumer preferences.
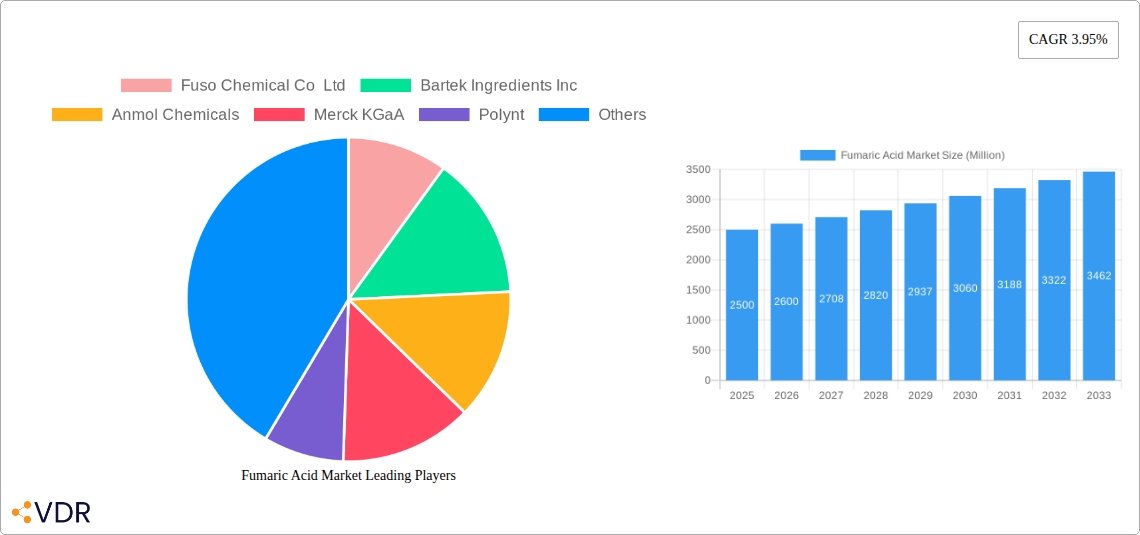
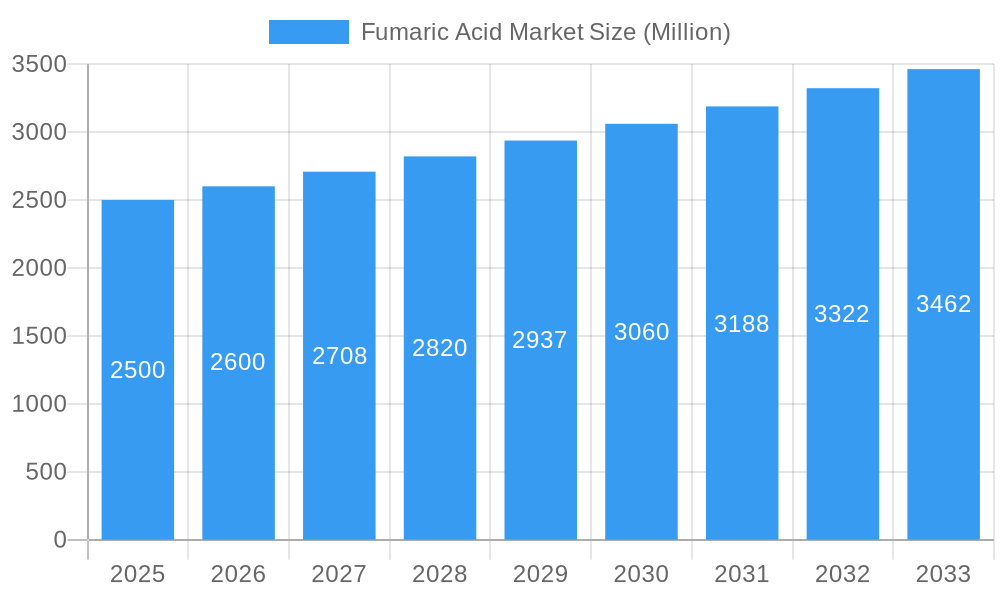
Fumaric Acid Market Market Size (In Million)
Market segmentation highlights substantial opportunities across various application areas. The food & beverage sector represents a significant segment, driven by increasing consumer demand for healthier food alternatives. Applications in rosin paper sizing and unsaturated polyester resins are projected to grow in alignment with the overall market CAGR. North America and Europe maintain strong market positions owing to established industrial bases and robust regulatory frameworks, while emerging economies in Asia-Pacific offer considerable growth potential. Strategic collaborations, technological advancements, and market expansion initiatives will be pivotal for stakeholders aiming to leverage opportunities within the dynamic fumaric acid market. Leading companies are prioritizing research and development to enhance product quality and uncover novel applications, thereby influencing the market's future trajectory.
Fumaric Acid Market Company Market Share
Fumaric Acid Market Report: A Comprehensive Analysis (2019-2033)
This comprehensive report provides an in-depth analysis of the global Fumaric Acid market, encompassing market dynamics, growth trends, regional insights, and competitive landscape. The report covers the period from 2019 to 2033, with a focus on the forecast period from 2025 to 2033, and utilizes 2025 as the base year. The market is segmented by type (Food Grade, Technical Grade), application (Food & Beverage Processing, Rosin Paper Sizing, Unsaturated Polyster Resin, Alkyd Resin, Personal Care & Cosmetics, Other Applications), and end-user industry (Food and Beverage, Cosmetics, Pharmaceutical, Chemical, Other End-user Industries). Key players analyzed include Fuso Chemical Co Ltd, Bartek Ingredients Inc, Anmol Chemicals, Merck KGaA, Polynt, Yongsan Chemicals Inc, Changmao Biochem, UPC Group, XST Biological Co Ltd, Thirumalai Chemicals Ltd, and ESIM Chemicals. The total market value in 2025 is estimated at xx Million.
Fumaric Acid Market Market Dynamics & Structure
The Fumaric Acid market exhibits a moderately concentrated structure, with several major players holding significant market share. Technological innovations, particularly in production efficiency and purity, are key drivers. Stringent regulatory frameworks concerning food safety and environmental impact influence market dynamics. Competition from alternative acidulants and bio-based alternatives presents a challenge. Mergers and acquisitions (M&A) activity, though not extensive, has contributed to consolidation and expansion into new segments. The report analyzes these factors quantitatively and qualitatively.
- Market Concentration: xx% of the market is controlled by the top 5 players in 2025.
- Technological Innovation: Focus on improving yield, purity, and cost-effectiveness of production.
- Regulatory Landscape: Compliance with food safety and environmental regulations varies across regions.
- Competitive Substitutes: Citric acid, malic acid, and tartaric acid pose competition.
- M&A Activity: An estimated xx M&A deals occurred between 2019 and 2024, primarily focused on expanding geographic reach.
- Innovation Barriers: High capital investment requirements for new production facilities can hinder entry.
Fumaric Acid Market Growth Trends & Insights
The global Fumaric Acid market witnessed a Compound Annual Growth Rate (CAGR) of xx% during the historical period (2019-2024), driven by the rising demand from food and beverage, and the increasing adoption in the chemical industry. Market penetration within emerging economies is increasing. Technological disruptions, such as the adoption of more efficient manufacturing processes, have further accelerated growth. Shifts in consumer preferences towards healthier food and beverages contribute positively. The forecast period (2025-2033) projects a CAGR of xx%, driven by expanding applications and rising demand in developing nations. The total market value is expected to reach xx Million by 2033. Further analysis on market evolution, technological advancements, and changing consumer demands is provided in the full report.
Dominant Regions, Countries, or Segments in Fumaric Acid Market
North America and Europe currently dominate the Fumaric Acid market, driven by established food & beverage industries, robust chemical sectors, and stringent regulatory compliance. However, Asia-Pacific shows significant growth potential due to rapidly expanding economies and rising demand from diverse applications.
- Key Drivers:
- North America: High consumption of processed foods and beverages.
- Europe: Strong chemical industry and regulatory frameworks encouraging sustainable alternatives.
- Asia-Pacific: Rapid industrialization, growing population, and increasing disposable incomes.
- Dominant Segments:
- Food Grade: Largest segment driven by demand for healthier food additives.
- Food & Beverage Processing: Significant application in the production of various food and beverages.
- Unsaturated Polyester Resin: A major application in the chemical industry.
Fumaric Acid Market Product Landscape
The Fumaric Acid market features a range of products differing in purity, particle size, and manufacturing processes. Recent innovations focus on enhanced purity for food applications and tailored particle sizes for specific industrial uses. Unique selling propositions emphasize high quality, consistent performance, and efficient supply chain management. Advances in production technologies are continuously improving yield and cost-effectiveness.
Key Drivers, Barriers & Challenges in Fumaric Acid Market
Key Drivers: Growing demand for food and beverage processing, increasing use in polymers and resins, and expansion into new applications like pharmaceuticals, drive market growth.
Challenges & Restraints: Fluctuations in raw material prices, stringent regulatory compliance requirements, and intense competition from substitutes impose challenges. Supply chain disruptions can lead to price volatility, impacting profitability. The total estimated impact of these restraints is a reduction in the growth rate by xx% in 2027.
Emerging Opportunities in Fumaric Acid Market
Untapped markets in developing economies, exploration of novel applications in bioplastics and bio-based materials, and catering to the rising demand for natural and sustainable food additives present significant opportunities.
Growth Accelerators in the Fumaric Acid Market Industry
Strategic partnerships for expanding geographical reach, investments in R&D for improving product quality and applications, and focusing on sustainable production methods will significantly accelerate market growth.
Key Players Shaping the Fumaric Acid Market Market
- Fuso Chemical Co Ltd
- Bartek Ingredients Inc
- Anmol Chemicals
- Merck KGaA
- Polynt
- Yongsan Chemicals Inc
- Changmao Biochem
- UPC Group
- XST Biological Co Ltd
- Thirumalai Chemicals Ltd
- ESIM Chemicals
Notable Milestones in Fumaric Acid Market Sector
- 2021: Merck KGaA launched a new high-purity fumaric acid product line.
- 2022: A major M&A deal between two key players expanded market reach in Asia.
- 2023: A new production facility using sustainable manufacturing practices was opened. (Specific details to be included in the full report.)
In-Depth Fumaric Acid Market Market Outlook
The Fumaric Acid market is poised for substantial growth in the forecast period, driven by factors discussed earlier. Strategic investments in capacity expansion, technological innovation, and exploration of new applications will shape future market dynamics and unlock promising opportunities for key players. The market is expected to experience sustained growth due to the continuous expansion in consumer and industrial applications.
Fumaric Acid Market Segmentation
-
1. Type
- 1.1. Food Grade
- 1.2. Technical Grade
-
2. Application
- 2.1. Food & Beverage Processing
- 2.2. Rosin Paper Sizing
- 2.3. Unsaturated Polyster Resin
- 2.4. Alkyd Resin
- 2.5. Personal Care & Cosmetics
- 2.6. Other Applications
-
3. End-user Industry
- 3.1. Food and Beverage
- 3.2. Cosmetics
- 3.3. Pharmaceutical
- 3.4. Chemical
- 3.5. Other End-user Industries
Fumaric Acid Market Segmentation By Geography
-
1. Asia Pacific
- 1.1. China
- 1.2. India
- 1.3. Japan
- 1.4. South Korea
- 1.5. Rest of Asia Pacific
-
2. North America
- 2.1. United States
- 2.2. Canada
- 2.3. Mexico
-
3. Europe
- 3.1. Germany
- 3.2. United Kingdom
- 3.3. France
- 3.4. Italy
- 3.5. Rest of Europe
-
4. South America
- 4.1. Brazil
- 4.2. Argentina
- 4.3. Rest of South America
-
5. Middle East and Africa
- 5.1. South Africa
- 5.2. Saudi Arabia
- 5.3. Rest of Middle East and Africa
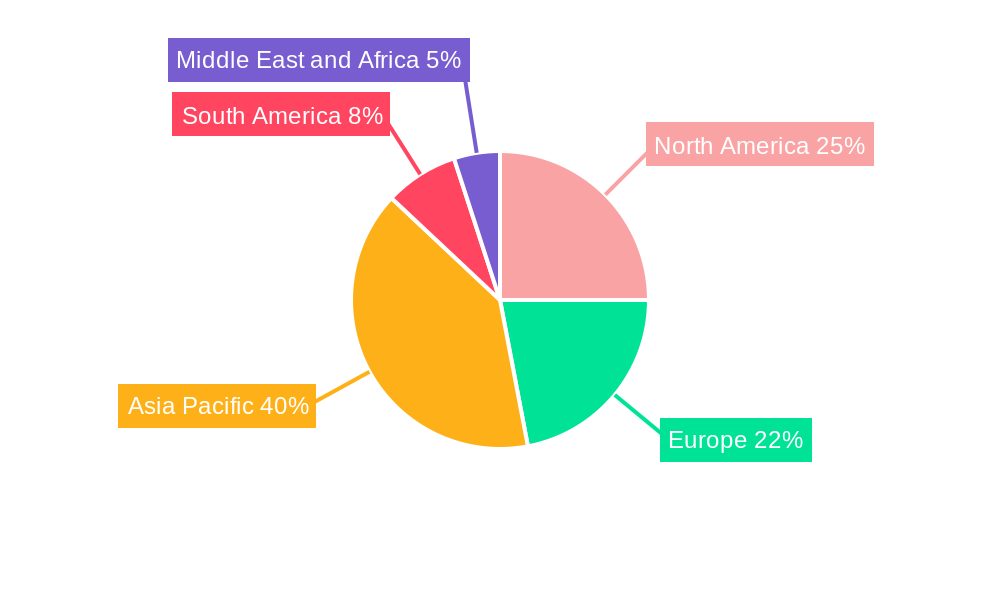
Fumaric Acid Market Regional Market Share
Geographic Coverage of Fumaric Acid Market
Fumaric Acid Market REPORT HIGHLIGHTS
| Aspects | Details |
|---|---|
| Study Period | 2020-2034 |
| Base Year | 2025 |
| Estimated Year | 2026 |
| Forecast Period | 2026-2034 |
| Historical Period | 2020-2025 |
| Growth Rate | CAGR of 5.41% from 2020-2034 |
| Segmentation |
|
Table of Contents
- 1. Introduction
- 1.1. Research Scope
- 1.2. Market Segmentation
- 1.3. Research Objective
- 1.4. Definitions and Assumptions
- 2. Executive Summary
- 2.1. Market Snapshot
- 3. Market Dynamics
- 3.1. Market Drivers
- 3.2. Market Restrains
- 3.3. Market Trends
- 3.4. Market Opportunities
- 4. Market Factor Analysis
- 4.1. Porters Five Forces
- 4.1.1. Bargaining Power of Suppliers
- 4.1.2. Bargaining Power of Buyers
- 4.1.3. Threat of New Entrants
- 4.1.4. Threat of Substitutes
- 4.1.5. Competitive Rivalry
- 4.2. PESTEL analysis
- 4.3. BCG Analysis
- 4.3.1. Stars (High Growth, High Market Share)
- 4.3.2. Cash Cows (Low Growth, High Market Share)
- 4.3.3. Question Mark (High Growth, Low Market Share)
- 4.3.4. Dogs (Low Growth, Low Market Share)
- 4.4. Ansoff Matrix Analysis
- 4.5. Supply Chain Analysis
- 4.6. Regulatory Landscape
- 4.7. Current Market Potential and Opportunity Assessment (TAM–SAM–SOM Framework)
- 4.8. VDR Analyst Note
- 4.1. Porters Five Forces
- 5. Market Analysis, Insights and Forecast 2021-2033
- 5.1. Market Analysis, Insights and Forecast - by Type
- 5.1.1. Food Grade
- 5.1.2. Technical Grade
- 5.2. Market Analysis, Insights and Forecast - by Application
- 5.2.1. Food & Beverage Processing
- 5.2.2. Rosin Paper Sizing
- 5.2.3. Unsaturated Polyster Resin
- 5.2.4. Alkyd Resin
- 5.2.5. Personal Care & Cosmetics
- 5.2.6. Other Applications
- 5.3. Market Analysis, Insights and Forecast - by End-user Industry
- 5.3.1. Food and Beverage
- 5.3.2. Cosmetics
- 5.3.3. Pharmaceutical
- 5.3.4. Chemical
- 5.3.5. Other End-user Industries
- 5.4. Market Analysis, Insights and Forecast - by Region
- 5.4.1. Asia Pacific
- 5.4.2. North America
- 5.4.3. Europe
- 5.4.4. South America
- 5.4.5. Middle East and Africa
- 5.1. Market Analysis, Insights and Forecast - by Type
- 6. Global Fumaric Acid Market Analysis, Insights and Forecast, 2021-2033
- 6.1. Market Analysis, Insights and Forecast - by Type
- 6.1.1. Food Grade
- 6.1.2. Technical Grade
- 6.2. Market Analysis, Insights and Forecast - by Application
- 6.2.1. Food & Beverage Processing
- 6.2.2. Rosin Paper Sizing
- 6.2.3. Unsaturated Polyster Resin
- 6.2.4. Alkyd Resin
- 6.2.5. Personal Care & Cosmetics
- 6.2.6. Other Applications
- 6.3. Market Analysis, Insights and Forecast - by End-user Industry
- 6.3.1. Food and Beverage
- 6.3.2. Cosmetics
- 6.3.3. Pharmaceutical
- 6.3.4. Chemical
- 6.3.5. Other End-user Industries
- 6.1. Market Analysis, Insights and Forecast - by Type
- 7. Asia Pacific Fumaric Acid Market Analysis, Insights and Forecast, 2021-2033
- 7.1. Market Analysis, Insights and Forecast - by Type
- 7.1.1. Food Grade
- 7.1.2. Technical Grade
- 7.2. Market Analysis, Insights and Forecast - by Application
- 7.2.1. Food & Beverage Processing
- 7.2.2. Rosin Paper Sizing
- 7.2.3. Unsaturated Polyster Resin
- 7.2.4. Alkyd Resin
- 7.2.5. Personal Care & Cosmetics
- 7.2.6. Other Applications
- 7.3. Market Analysis, Insights and Forecast - by End-user Industry
- 7.3.1. Food and Beverage
- 7.3.2. Cosmetics
- 7.3.3. Pharmaceutical
- 7.3.4. Chemical
- 7.3.5. Other End-user Industries
- 7.1. Market Analysis, Insights and Forecast - by Type
- 8. North America Fumaric Acid Market Analysis, Insights and Forecast, 2021-2033
- 8.1. Market Analysis, Insights and Forecast - by Type
- 8.1.1. Food Grade
- 8.1.2. Technical Grade
- 8.2. Market Analysis, Insights and Forecast - by Application
- 8.2.1. Food & Beverage Processing
- 8.2.2. Rosin Paper Sizing
- 8.2.3. Unsaturated Polyster Resin
- 8.2.4. Alkyd Resin
- 8.2.5. Personal Care & Cosmetics
- 8.2.6. Other Applications
- 8.3. Market Analysis, Insights and Forecast - by End-user Industry
- 8.3.1. Food and Beverage
- 8.3.2. Cosmetics
- 8.3.3. Pharmaceutical
- 8.3.4. Chemical
- 8.3.5. Other End-user Industries
- 8.1. Market Analysis, Insights and Forecast - by Type
- 9. Europe Fumaric Acid Market Analysis, Insights and Forecast, 2021-2033
- 9.1. Market Analysis, Insights and Forecast - by Type
- 9.1.1. Food Grade
- 9.1.2. Technical Grade
- 9.2. Market Analysis, Insights and Forecast - by Application
- 9.2.1. Food & Beverage Processing
- 9.2.2. Rosin Paper Sizing
- 9.2.3. Unsaturated Polyster Resin
- 9.2.4. Alkyd Resin
- 9.2.5. Personal Care & Cosmetics
- 9.2.6. Other Applications
- 9.3. Market Analysis, Insights and Forecast - by End-user Industry
- 9.3.1. Food and Beverage
- 9.3.2. Cosmetics
- 9.3.3. Pharmaceutical
- 9.3.4. Chemical
- 9.3.5. Other End-user Industries
- 9.1. Market Analysis, Insights and Forecast - by Type
- 10. South America Fumaric Acid Market Analysis, Insights and Forecast, 2021-2033
- 10.1. Market Analysis, Insights and Forecast - by Type
- 10.1.1. Food Grade
- 10.1.2. Technical Grade
- 10.2. Market Analysis, Insights and Forecast - by Application
- 10.2.1. Food & Beverage Processing
- 10.2.2. Rosin Paper Sizing
- 10.2.3. Unsaturated Polyster Resin
- 10.2.4. Alkyd Resin
- 10.2.5. Personal Care & Cosmetics
- 10.2.6. Other Applications
- 10.3. Market Analysis, Insights and Forecast - by End-user Industry
- 10.3.1. Food and Beverage
- 10.3.2. Cosmetics
- 10.3.3. Pharmaceutical
- 10.3.4. Chemical
- 10.3.5. Other End-user Industries
- 10.1. Market Analysis, Insights and Forecast - by Type
- 11. Middle East and Africa Fumaric Acid Market Analysis, Insights and Forecast, 2021-2033
- 11.1. Market Analysis, Insights and Forecast - by Type
- 11.1.1. Food Grade
- 11.1.2. Technical Grade
- 11.2. Market Analysis, Insights and Forecast - by Application
- 11.2.1. Food & Beverage Processing
- 11.2.2. Rosin Paper Sizing
- 11.2.3. Unsaturated Polyster Resin
- 11.2.4. Alkyd Resin
- 11.2.5. Personal Care & Cosmetics
- 11.2.6. Other Applications
- 11.3. Market Analysis, Insights and Forecast - by End-user Industry
- 11.3.1. Food and Beverage
- 11.3.2. Cosmetics
- 11.3.3. Pharmaceutical
- 11.3.4. Chemical
- 11.3.5. Other End-user Industries
- 11.1. Market Analysis, Insights and Forecast - by Type
- 12. Competitive Analysis
- 12.1. Company Profiles
- 12.1.1 Fuso Chemical Co Ltd
- 12.1.1.1. Company Overview
- 12.1.1.2. Products
- 12.1.1.3. Company Financials
- 12.1.1.4. SWOT Analysis
- 12.1.2 Bartek Ingredients Inc
- 12.1.2.1. Company Overview
- 12.1.2.2. Products
- 12.1.2.3. Company Financials
- 12.1.2.4. SWOT Analysis
- 12.1.3 Anmol Chemicals
- 12.1.3.1. Company Overview
- 12.1.3.2. Products
- 12.1.3.3. Company Financials
- 12.1.3.4. SWOT Analysis
- 12.1.4 Merck KGaA
- 12.1.4.1. Company Overview
- 12.1.4.2. Products
- 12.1.4.3. Company Financials
- 12.1.4.4. SWOT Analysis
- 12.1.5 Polynt
- 12.1.5.1. Company Overview
- 12.1.5.2. Products
- 12.1.5.3. Company Financials
- 12.1.5.4. SWOT Analysis
- 12.1.6 Yongsan Chemicals Inc
- 12.1.6.1. Company Overview
- 12.1.6.2. Products
- 12.1.6.3. Company Financials
- 12.1.6.4. SWOT Analysis
- 12.1.7 Changmao Biochem
- 12.1.7.1. Company Overview
- 12.1.7.2. Products
- 12.1.7.3. Company Financials
- 12.1.7.4. SWOT Analysis
- 12.1.8 UPC Group
- 12.1.8.1. Company Overview
- 12.1.8.2. Products
- 12.1.8.3. Company Financials
- 12.1.8.4. SWOT Analysis
- 12.1.9 XST Biological Co Ltd*List Not Exhaustive
- 12.1.9.1. Company Overview
- 12.1.9.2. Products
- 12.1.9.3. Company Financials
- 12.1.9.4. SWOT Analysis
- 12.1.10 Thirumalai Chemicals Ltd
- 12.1.10.1. Company Overview
- 12.1.10.2. Products
- 12.1.10.3. Company Financials
- 12.1.10.4. SWOT Analysis
- 12.1.11 ESIM Chemicals
- 12.1.11.1. Company Overview
- 12.1.11.2. Products
- 12.1.11.3. Company Financials
- 12.1.11.4. SWOT Analysis
- 12.1.1 Fuso Chemical Co Ltd
- 12.2. Market Entropy
- 12.2.1 Company's Key Areas Served
- 12.2.2 Recent Developments
- 12.3. Company Market Share Analysis 2025
- 12.3.1 Top 5 Companies Market Share Analysis
- 12.3.2 Top 3 Companies Market Share Analysis
- 12.4. List of Potential Customers
- 13. Research Methodology
List of Figures
- Figure 1: Global Fumaric Acid Market Revenue Breakdown (million, %) by Region 2025 & 2033
- Figure 2: Global Fumaric Acid Market Volume Breakdown (kilotons, %) by Region 2025 & 2033
- Figure 3: Asia Pacific Fumaric Acid Market Revenue (million), by Type 2025 & 2033
- Figure 4: Asia Pacific Fumaric Acid Market Volume (kilotons), by Type 2025 & 2033
- Figure 5: Asia Pacific Fumaric Acid Market Revenue Share (%), by Type 2025 & 2033
- Figure 6: Asia Pacific Fumaric Acid Market Volume Share (%), by Type 2025 & 2033
- Figure 7: Asia Pacific Fumaric Acid Market Revenue (million), by Application 2025 & 2033
- Figure 8: Asia Pacific Fumaric Acid Market Volume (kilotons), by Application 2025 & 2033
- Figure 9: Asia Pacific Fumaric Acid Market Revenue Share (%), by Application 2025 & 2033
- Figure 10: Asia Pacific Fumaric Acid Market Volume Share (%), by Application 2025 & 2033
- Figure 11: Asia Pacific Fumaric Acid Market Revenue (million), by End-user Industry 2025 & 2033
- Figure 12: Asia Pacific Fumaric Acid Market Volume (kilotons), by End-user Industry 2025 & 2033
- Figure 13: Asia Pacific Fumaric Acid Market Revenue Share (%), by End-user Industry 2025 & 2033
- Figure 14: Asia Pacific Fumaric Acid Market Volume Share (%), by End-user Industry 2025 & 2033
- Figure 15: Asia Pacific Fumaric Acid Market Revenue (million), by Country 2025 & 2033
- Figure 16: Asia Pacific Fumaric Acid Market Volume (kilotons), by Country 2025 & 2033
- Figure 17: Asia Pacific Fumaric Acid Market Revenue Share (%), by Country 2025 & 2033
- Figure 18: Asia Pacific Fumaric Acid Market Volume Share (%), by Country 2025 & 2033
- Figure 19: North America Fumaric Acid Market Revenue (million), by Type 2025 & 2033
- Figure 20: North America Fumaric Acid Market Volume (kilotons), by Type 2025 & 2033
- Figure 21: North America Fumaric Acid Market Revenue Share (%), by Type 2025 & 2033
- Figure 22: North America Fumaric Acid Market Volume Share (%), by Type 2025 & 2033
- Figure 23: North America Fumaric Acid Market Revenue (million), by Application 2025 & 2033
- Figure 24: North America Fumaric Acid Market Volume (kilotons), by Application 2025 & 2033
- Figure 25: North America Fumaric Acid Market Revenue Share (%), by Application 2025 & 2033
- Figure 26: North America Fumaric Acid Market Volume Share (%), by Application 2025 & 2033
- Figure 27: North America Fumaric Acid Market Revenue (million), by End-user Industry 2025 & 2033
- Figure 28: North America Fumaric Acid Market Volume (kilotons), by End-user Industry 2025 & 2033
- Figure 29: North America Fumaric Acid Market Revenue Share (%), by End-user Industry 2025 & 2033
- Figure 30: North America Fumaric Acid Market Volume Share (%), by End-user Industry 2025 & 2033
- Figure 31: North America Fumaric Acid Market Revenue (million), by Country 2025 & 2033
- Figure 32: North America Fumaric Acid Market Volume (kilotons), by Country 2025 & 2033
- Figure 33: North America Fumaric Acid Market Revenue Share (%), by Country 2025 & 2033
- Figure 34: North America Fumaric Acid Market Volume Share (%), by Country 2025 & 2033
- Figure 35: Europe Fumaric Acid Market Revenue (million), by Type 2025 & 2033
- Figure 36: Europe Fumaric Acid Market Volume (kilotons), by Type 2025 & 2033
- Figure 37: Europe Fumaric Acid Market Revenue Share (%), by Type 2025 & 2033
- Figure 38: Europe Fumaric Acid Market Volume Share (%), by Type 2025 & 2033
- Figure 39: Europe Fumaric Acid Market Revenue (million), by Application 2025 & 2033
- Figure 40: Europe Fumaric Acid Market Volume (kilotons), by Application 2025 & 2033
- Figure 41: Europe Fumaric Acid Market Revenue Share (%), by Application 2025 & 2033
- Figure 42: Europe Fumaric Acid Market Volume Share (%), by Application 2025 & 2033
- Figure 43: Europe Fumaric Acid Market Revenue (million), by End-user Industry 2025 & 2033
- Figure 44: Europe Fumaric Acid Market Volume (kilotons), by End-user Industry 2025 & 2033
- Figure 45: Europe Fumaric Acid Market Revenue Share (%), by End-user Industry 2025 & 2033
- Figure 46: Europe Fumaric Acid Market Volume Share (%), by End-user Industry 2025 & 2033
- Figure 47: Europe Fumaric Acid Market Revenue (million), by Country 2025 & 2033
- Figure 48: Europe Fumaric Acid Market Volume (kilotons), by Country 2025 & 2033
- Figure 49: Europe Fumaric Acid Market Revenue Share (%), by Country 2025 & 2033
- Figure 50: Europe Fumaric Acid Market Volume Share (%), by Country 2025 & 2033
- Figure 51: South America Fumaric Acid Market Revenue (million), by Type 2025 & 2033
- Figure 52: South America Fumaric Acid Market Volume (kilotons), by Type 2025 & 2033
- Figure 53: South America Fumaric Acid Market Revenue Share (%), by Type 2025 & 2033
- Figure 54: South America Fumaric Acid Market Volume Share (%), by Type 2025 & 2033
- Figure 55: South America Fumaric Acid Market Revenue (million), by Application 2025 & 2033
- Figure 56: South America Fumaric Acid Market Volume (kilotons), by Application 2025 & 2033
- Figure 57: South America Fumaric Acid Market Revenue Share (%), by Application 2025 & 2033
- Figure 58: South America Fumaric Acid Market Volume Share (%), by Application 2025 & 2033
- Figure 59: South America Fumaric Acid Market Revenue (million), by End-user Industry 2025 & 2033
- Figure 60: South America Fumaric Acid Market Volume (kilotons), by End-user Industry 2025 & 2033
- Figure 61: South America Fumaric Acid Market Revenue Share (%), by End-user Industry 2025 & 2033
- Figure 62: South America Fumaric Acid Market Volume Share (%), by End-user Industry 2025 & 2033
- Figure 63: South America Fumaric Acid Market Revenue (million), by Country 2025 & 2033
- Figure 64: South America Fumaric Acid Market Volume (kilotons), by Country 2025 & 2033
- Figure 65: South America Fumaric Acid Market Revenue Share (%), by Country 2025 & 2033
- Figure 66: South America Fumaric Acid Market Volume Share (%), by Country 2025 & 2033
- Figure 67: Middle East and Africa Fumaric Acid Market Revenue (million), by Type 2025 & 2033
- Figure 68: Middle East and Africa Fumaric Acid Market Volume (kilotons), by Type 2025 & 2033
- Figure 69: Middle East and Africa Fumaric Acid Market Revenue Share (%), by Type 2025 & 2033
- Figure 70: Middle East and Africa Fumaric Acid Market Volume Share (%), by Type 2025 & 2033
- Figure 71: Middle East and Africa Fumaric Acid Market Revenue (million), by Application 2025 & 2033
- Figure 72: Middle East and Africa Fumaric Acid Market Volume (kilotons), by Application 2025 & 2033
- Figure 73: Middle East and Africa Fumaric Acid Market Revenue Share (%), by Application 2025 & 2033
- Figure 74: Middle East and Africa Fumaric Acid Market Volume Share (%), by Application 2025 & 2033
- Figure 75: Middle East and Africa Fumaric Acid Market Revenue (million), by End-user Industry 2025 & 2033
- Figure 76: Middle East and Africa Fumaric Acid Market Volume (kilotons), by End-user Industry 2025 & 2033
- Figure 77: Middle East and Africa Fumaric Acid Market Revenue Share (%), by End-user Industry 2025 & 2033
- Figure 78: Middle East and Africa Fumaric Acid Market Volume Share (%), by End-user Industry 2025 & 2033
- Figure 79: Middle East and Africa Fumaric Acid Market Revenue (million), by Country 2025 & 2033
- Figure 80: Middle East and Africa Fumaric Acid Market Volume (kilotons), by Country 2025 & 2033
- Figure 81: Middle East and Africa Fumaric Acid Market Revenue Share (%), by Country 2025 & 2033
- Figure 82: Middle East and Africa Fumaric Acid Market Volume Share (%), by Country 2025 & 2033
List of Tables
- Table 1: Global Fumaric Acid Market Revenue million Forecast, by Type 2020 & 2033
- Table 2: Global Fumaric Acid Market Volume kilotons Forecast, by Type 2020 & 2033
- Table 3: Global Fumaric Acid Market Revenue million Forecast, by Application 2020 & 2033
- Table 4: Global Fumaric Acid Market Volume kilotons Forecast, by Application 2020 & 2033
- Table 5: Global Fumaric Acid Market Revenue million Forecast, by End-user Industry 2020 & 2033
- Table 6: Global Fumaric Acid Market Volume kilotons Forecast, by End-user Industry 2020 & 2033
- Table 7: Global Fumaric Acid Market Revenue million Forecast, by Region 2020 & 2033
- Table 8: Global Fumaric Acid Market Volume kilotons Forecast, by Region 2020 & 2033
- Table 9: Global Fumaric Acid Market Revenue million Forecast, by Type 2020 & 2033
- Table 10: Global Fumaric Acid Market Volume kilotons Forecast, by Type 2020 & 2033
- Table 11: Global Fumaric Acid Market Revenue million Forecast, by Application 2020 & 2033
- Table 12: Global Fumaric Acid Market Volume kilotons Forecast, by Application 2020 & 2033
- Table 13: Global Fumaric Acid Market Revenue million Forecast, by End-user Industry 2020 & 2033
- Table 14: Global Fumaric Acid Market Volume kilotons Forecast, by End-user Industry 2020 & 2033
- Table 15: Global Fumaric Acid Market Revenue million Forecast, by Country 2020 & 2033
- Table 16: Global Fumaric Acid Market Volume kilotons Forecast, by Country 2020 & 2033
- Table 17: China Fumaric Acid Market Revenue (million) Forecast, by Application 2020 & 2033
- Table 18: China Fumaric Acid Market Volume (kilotons) Forecast, by Application 2020 & 2033
- Table 19: India Fumaric Acid Market Revenue (million) Forecast, by Application 2020 & 2033
- Table 20: India Fumaric Acid Market Volume (kilotons) Forecast, by Application 2020 & 2033
- Table 21: Japan Fumaric Acid Market Revenue (million) Forecast, by Application 2020 & 2033
- Table 22: Japan Fumaric Acid Market Volume (kilotons) Forecast, by Application 2020 & 2033
- Table 23: South Korea Fumaric Acid Market Revenue (million) Forecast, by Application 2020 & 2033
- Table 24: South Korea Fumaric Acid Market Volume (kilotons) Forecast, by Application 2020 & 2033
- Table 25: Rest of Asia Pacific Fumaric Acid Market Revenue (million) Forecast, by Application 2020 & 2033
- Table 26: Rest of Asia Pacific Fumaric Acid Market Volume (kilotons) Forecast, by Application 2020 & 2033
- Table 27: Global Fumaric Acid Market Revenue million Forecast, by Type 2020 & 2033
- Table 28: Global Fumaric Acid Market Volume kilotons Forecast, by Type 2020 & 2033
- Table 29: Global Fumaric Acid Market Revenue million Forecast, by Application 2020 & 2033
- Table 30: Global Fumaric Acid Market Volume kilotons Forecast, by Application 2020 & 2033
- Table 31: Global Fumaric Acid Market Revenue million Forecast, by End-user Industry 2020 & 2033
- Table 32: Global Fumaric Acid Market Volume kilotons Forecast, by End-user Industry 2020 & 2033
- Table 33: Global Fumaric Acid Market Revenue million Forecast, by Country 2020 & 2033
- Table 34: Global Fumaric Acid Market Volume kilotons Forecast, by Country 2020 & 2033
- Table 35: United States Fumaric Acid Market Revenue (million) Forecast, by Application 2020 & 2033
- Table 36: United States Fumaric Acid Market Volume (kilotons) Forecast, by Application 2020 & 2033
- Table 37: Canada Fumaric Acid Market Revenue (million) Forecast, by Application 2020 & 2033
- Table 38: Canada Fumaric Acid Market Volume (kilotons) Forecast, by Application 2020 & 2033
- Table 39: Mexico Fumaric Acid Market Revenue (million) Forecast, by Application 2020 & 2033
- Table 40: Mexico Fumaric Acid Market Volume (kilotons) Forecast, by Application 2020 & 2033
- Table 41: Global Fumaric Acid Market Revenue million Forecast, by Type 2020 & 2033
- Table 42: Global Fumaric Acid Market Volume kilotons Forecast, by Type 2020 & 2033
- Table 43: Global Fumaric Acid Market Revenue million Forecast, by Application 2020 & 2033
- Table 44: Global Fumaric Acid Market Volume kilotons Forecast, by Application 2020 & 2033
- Table 45: Global Fumaric Acid Market Revenue million Forecast, by End-user Industry 2020 & 2033
- Table 46: Global Fumaric Acid Market Volume kilotons Forecast, by End-user Industry 2020 & 2033
- Table 47: Global Fumaric Acid Market Revenue million Forecast, by Country 2020 & 2033
- Table 48: Global Fumaric Acid Market Volume kilotons Forecast, by Country 2020 & 2033
- Table 49: Germany Fumaric Acid Market Revenue (million) Forecast, by Application 2020 & 2033
- Table 50: Germany Fumaric Acid Market Volume (kilotons) Forecast, by Application 2020 & 2033
- Table 51: United Kingdom Fumaric Acid Market Revenue (million) Forecast, by Application 2020 & 2033
- Table 52: United Kingdom Fumaric Acid Market Volume (kilotons) Forecast, by Application 2020 & 2033
- Table 53: France Fumaric Acid Market Revenue (million) Forecast, by Application 2020 & 2033
- Table 54: France Fumaric Acid Market Volume (kilotons) Forecast, by Application 2020 & 2033
- Table 55: Italy Fumaric Acid Market Revenue (million) Forecast, by Application 2020 & 2033
- Table 56: Italy Fumaric Acid Market Volume (kilotons) Forecast, by Application 2020 & 2033
- Table 57: Rest of Europe Fumaric Acid Market Revenue (million) Forecast, by Application 2020 & 2033
- Table 58: Rest of Europe Fumaric Acid Market Volume (kilotons) Forecast, by Application 2020 & 2033
- Table 59: Global Fumaric Acid Market Revenue million Forecast, by Type 2020 & 2033
- Table 60: Global Fumaric Acid Market Volume kilotons Forecast, by Type 2020 & 2033
- Table 61: Global Fumaric Acid Market Revenue million Forecast, by Application 2020 & 2033
- Table 62: Global Fumaric Acid Market Volume kilotons Forecast, by Application 2020 & 2033
- Table 63: Global Fumaric Acid Market Revenue million Forecast, by End-user Industry 2020 & 2033
- Table 64: Global Fumaric Acid Market Volume kilotons Forecast, by End-user Industry 2020 & 2033
- Table 65: Global Fumaric Acid Market Revenue million Forecast, by Country 2020 & 2033
- Table 66: Global Fumaric Acid Market Volume kilotons Forecast, by Country 2020 & 2033
- Table 67: Brazil Fumaric Acid Market Revenue (million) Forecast, by Application 2020 & 2033
- Table 68: Brazil Fumaric Acid Market Volume (kilotons) Forecast, by Application 2020 & 2033
- Table 69: Argentina Fumaric Acid Market Revenue (million) Forecast, by Application 2020 & 2033
- Table 70: Argentina Fumaric Acid Market Volume (kilotons) Forecast, by Application 2020 & 2033
- Table 71: Rest of South America Fumaric Acid Market Revenue (million) Forecast, by Application 2020 & 2033
- Table 72: Rest of South America Fumaric Acid Market Volume (kilotons) Forecast, by Application 2020 & 2033
- Table 73: Global Fumaric Acid Market Revenue million Forecast, by Type 2020 & 2033
- Table 74: Global Fumaric Acid Market Volume kilotons Forecast, by Type 2020 & 2033
- Table 75: Global Fumaric Acid Market Revenue million Forecast, by Application 2020 & 2033
- Table 76: Global Fumaric Acid Market Volume kilotons Forecast, by Application 2020 & 2033
- Table 77: Global Fumaric Acid Market Revenue million Forecast, by End-user Industry 2020 & 2033
- Table 78: Global Fumaric Acid Market Volume kilotons Forecast, by End-user Industry 2020 & 2033
- Table 79: Global Fumaric Acid Market Revenue million Forecast, by Country 2020 & 2033
- Table 80: Global Fumaric Acid Market Volume kilotons Forecast, by Country 2020 & 2033
- Table 81: South Africa Fumaric Acid Market Revenue (million) Forecast, by Application 2020 & 2033
- Table 82: South Africa Fumaric Acid Market Volume (kilotons) Forecast, by Application 2020 & 2033
- Table 83: Saudi Arabia Fumaric Acid Market Revenue (million) Forecast, by Application 2020 & 2033
- Table 84: Saudi Arabia Fumaric Acid Market Volume (kilotons) Forecast, by Application 2020 & 2033
- Table 85: Rest of Middle East and Africa Fumaric Acid Market Revenue (million) Forecast, by Application 2020 & 2033
- Table 86: Rest of Middle East and Africa Fumaric Acid Market Volume (kilotons) Forecast, by Application 2020 & 2033
Frequently Asked Questions
1. What is the projected Compound Annual Growth Rate (CAGR) of the Fumaric Acid Market?
The projected CAGR is approximately 5.41%.
2. Which companies are prominent players in the Fumaric Acid Market?
Key companies in the market include Fuso Chemical Co Ltd, Bartek Ingredients Inc, Anmol Chemicals, Merck KGaA, Polynt, Yongsan Chemicals Inc, Changmao Biochem, UPC Group, XST Biological Co Ltd*List Not Exhaustive, Thirumalai Chemicals Ltd, ESIM Chemicals.
3. What are the main segments of the Fumaric Acid Market?
The market segments include Type, Application, End-user Industry.
4. Can you provide details about the market size?
The market size is estimated to be USD 106.6 million as of 2022.
5. What are some drivers contributing to market growth?
Growing Application in the Food and Beverage Industry; Other Drivers.
6. What are the notable trends driving market growth?
Food and Beverage to Dominate the Demand.
7. Are there any restraints impacting market growth?
Health Hazard Related to Fumaric Acid.
8. Can you provide examples of recent developments in the market?
N/A
9. What pricing options are available for accessing the report?
Pricing options include single-user, multi-user, and enterprise licenses priced at USD 4750, USD 5250, and USD 8750 respectively.
10. Is the market size provided in terms of value or volume?
The market size is provided in terms of value, measured in million and volume, measured in kilotons.
11. Are there any specific market keywords associated with the report?
Yes, the market keyword associated with the report is "Fumaric Acid Market," which aids in identifying and referencing the specific market segment covered.
12. How do I determine which pricing option suits my needs best?
The pricing options vary based on user requirements and access needs. Individual users may opt for single-user licenses, while businesses requiring broader access may choose multi-user or enterprise licenses for cost-effective access to the report.
13. Are there any additional resources or data provided in the Fumaric Acid Market report?
While the report offers comprehensive insights, it's advisable to review the specific contents or supplementary materials provided to ascertain if additional resources or data are available.
14. How can I stay updated on further developments or reports in the Fumaric Acid Market?
To stay informed about further developments, trends, and reports in the Fumaric Acid Market, consider subscribing to industry newsletters, following relevant companies and organizations, or regularly checking reputable industry news sources and publications.
Methodology
Step 1 - Identification of Relevant Samples Size from Population Database


Step 2 - Approaches for Defining Global Market Size (Value, Volume* & Price*)

Note*: In applicable scenarios
Step 3 - Data Sources
Primary Research
- Web Analytics
- Survey Reports
- Research Institute
- Latest Research Reports
- Opinion Leaders
Secondary Research
- Annual Reports
- White Paper
- Latest Press Release
- Industry Association
- Paid Database
- Investor Presentations

Step 4 - Data Triangulation
Involves using different sources of information in order to increase the validity of a study
These sources are likely to be stakeholders in a program - participants, other researchers, program staff, other community members, and so on.
Then we put all data in single framework & apply various statistical tools to find out the dynamic on the market.
During the analysis stage, feedback from the stakeholder groups would be compared to determine areas of agreement as well as areas of divergence