

Key Insights
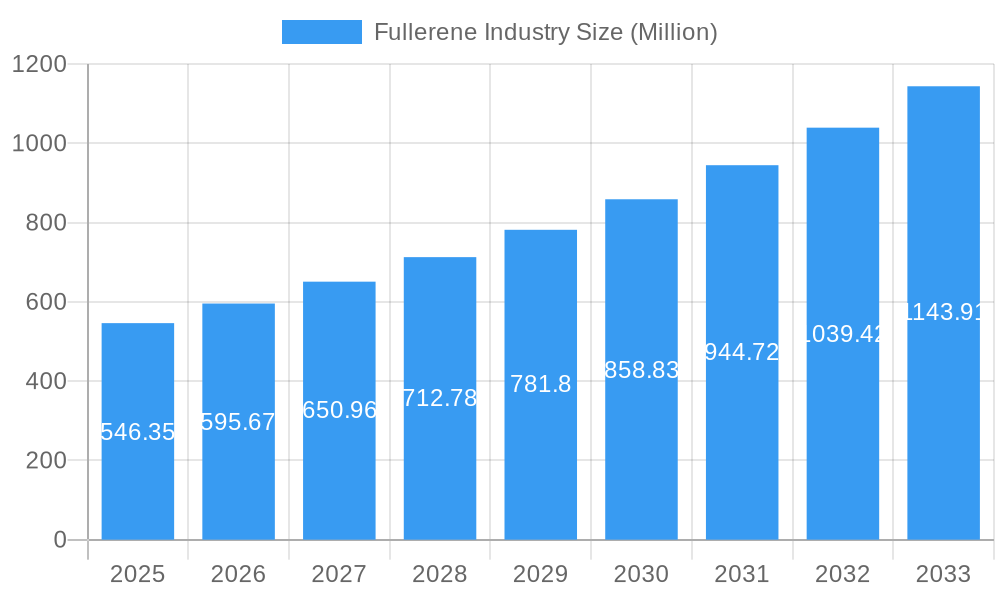
The fullerene market, valued at $546.35 million in 2025, is projected to experience robust growth, driven by increasing applications in diverse sectors. The Compound Annual Growth Rate (CAGR) of 8.97% from 2025 to 2033 indicates a significant expansion of this market over the forecast period. Key drivers include the rising demand for advanced materials in electronics, energy storage, and biomedical applications. Fullerene's unique properties, such as high conductivity, strength, and biocompatibility, make them ideal for various high-tech applications. The market is segmented by type (C60, C70, and others), application (electronics, energy, biomedical, and others), and geography. While precise segment breakdowns are unavailable, the market's growth is expected to be significantly influenced by the increasing adoption of fullerene-based products in emerging technologies like flexible electronics and targeted drug delivery systems. Competitive players like NanoMaterials Ltd, IoLiTec, and others are actively engaged in research and development, furthering technological advancements and expanding market possibilities.
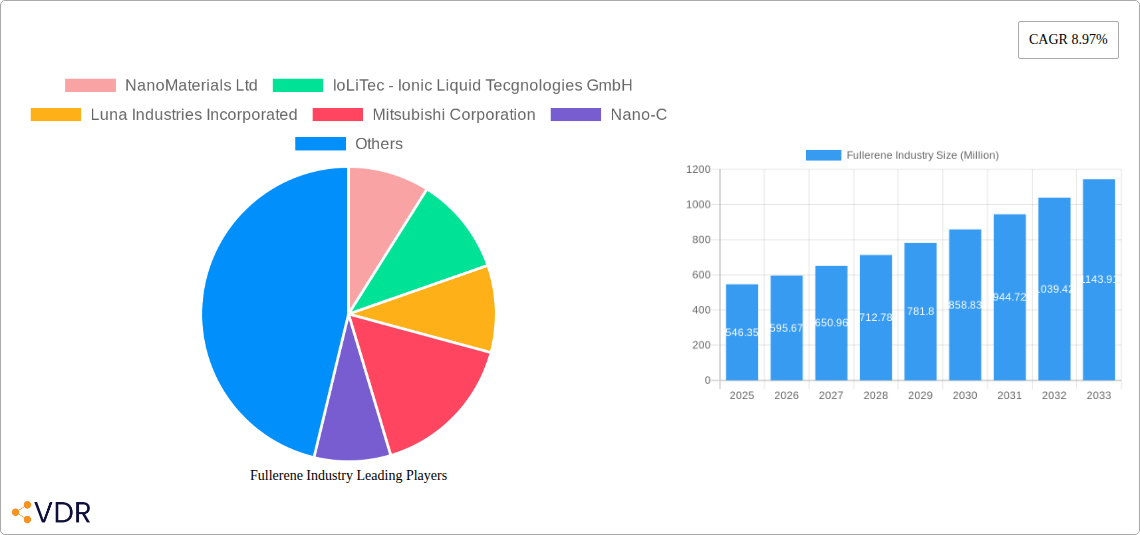
Fullerene Industry Market Size (In Million)
The continued growth is anticipated to be fuelled by ongoing research into new fullerene derivatives and their applications, leading to improved performance and cost-effectiveness. However, challenges remain, including high production costs and potential toxicity concerns which need further investigation and mitigation strategies. The market's expansion will likely be geographically diverse, with North America and Europe expected to be leading regions due to robust research infrastructure and early adoption of advanced materials. Asia-Pacific is also anticipated to show significant growth, driven by the expansion of the electronics and renewable energy sectors in this region. Overall, the fullerene market presents substantial growth opportunities for investors and companies involved in the manufacturing, research, and application of this remarkable material.
Fullerene Industry Company Market Share
Fullerene Industry Market Report: 2019-2033
This comprehensive report provides an in-depth analysis of the Fullerene industry, encompassing market dynamics, growth trends, regional analysis, competitive landscape, and future outlook. The report covers the period 2019-2033, with a base year of 2025 and a forecast period of 2025-2033. This detailed study is essential for industry professionals, investors, and researchers seeking to understand the current state and future trajectory of the fullerene market. The market is segmented by application and geography to provide a granular view of growth opportunities.
Fullerene Industry Market Dynamics & Structure
The fullerene market is characterized by a moderately concentrated landscape, with pioneering entities such as Nano-C, Mitsubishi Corporation, and NanoMaterials Ltd commanding a substantial portion of the market share. A primary catalyst for market expansion lies in continuous technological innovation, particularly advancements in synthesis and functionalization methodologies. The market's trajectory is also influenced by robust regulatory frameworks governing the safety of nanomaterials. It faces competition from other advanced carbon nanomaterials, including carbon nanotubes and graphene, which offer alternative solutions in various applications. The end-user base is remarkably diverse, encompassing critical sectors like electronics, renewable energy, advanced medicine, and cutting-edge materials science. While Mergers & Acquisitions (M&A) activity has been subdued historically, with only a few deals noted in recent years, an uptick is anticipated as the market continues to mature and consolidation opportunities emerge.
- Market Concentration: The market exhibits moderate concentration, with the top 5 players holding a significant share, indicating a competitive yet consolidated environment.
- Technological Innovation: Ongoing efforts are centered on refining synthesis techniques for higher efficiency and purity, developing sophisticated functionalization methods to tailor properties, and driving down production costs to enhance market accessibility.
- Regulatory Framework: Stringent safety regulations, particularly prevalent in key markets like Europe and North America, play a crucial role in shaping market entry and growth strategies, emphasizing responsible development and deployment.
- Competitive Substitutes: The presence of carbon nanotubes and graphene presents significant competitive pressure, necessitating continuous innovation and value proposition enhancement for fullerene-based products to maintain and expand market penetration.
- End-User Demographics: The demand for fullerenes is driven by a broad spectrum of industries, including the rapidly evolving electronics sector, the critical energy storage domain, innovative biomedical applications, and the development of advanced materials with superior properties.
- M&A Trends: While historical M&A activity has been limited, the market is poised for increased consolidation as it matures, offering strategic opportunities for companies seeking to expand their portfolios or gain market access.
Fullerene Industry Growth Trends & Insights
The fullerene market has demonstrated a commendable Compound Annual Growth Rate (CAGR) during the historical period (2019-2024). Projections indicate a sustained and accelerated CAGR during the forecast period (2025-2033), driven by a confluence of factors. The escalating demand from diverse end-use sectors is a primary engine, bolstered by significant technological advancements, supportive government policies aimed at fostering nanotechnology adoption, and a growing awareness among consumers and industries about the unique benefits of fullerene-based materials. Adoption rates are on a steady upward trajectory, particularly in high-value and technologically sophisticated applications such as advanced medical imaging contrast agents and next-generation high-performance electronic components. Disruptive innovations, especially in the field of fullerene synthesis and functionalization, are acting as powerful accelerants to market growth. Furthermore, evolving consumer preferences leaning towards sustainable solutions and the persistent demand for materials exhibiting superior performance characteristics are additional tailwinds. While penetration in emerging economies is currently modest, these regions represent substantial untapped potential for future market expansion.
Dominant Regions, Countries, or Segments in Fullerene Industry
North America currently spearheads the global fullerene industry, underpinned by substantial investments in research and development, a robust ecosystem of key market players, and an early and enthusiastic adoption of fullerene-enabled technologies. Europe closely follows, with its growth being significantly propelled by proactive government initiatives supporting nanotechnology research and development and a strong emphasis on innovation. The Asia-Pacific region is rapidly emerging as a high-growth powerhouse, fueled by accelerating industrialization and an increasing demand from the burgeoning electronics and energy sectors. Within these regions, specific countries such as the United States, Germany, Japan, and China are recognized as pivotal market drivers, shaping global trends and consumption patterns.
- North America: Characterized by substantial R&D investments, a well-established presence of leading fullerene manufacturers and innovators, and a pioneering spirit in adopting advanced fullerene-based technologies across various applications.
- Europe: Benefitting from strong government backing for nanotechnology research, a sophisticated research infrastructure, and a comprehensive regulatory framework that fosters innovation while ensuring safety and responsible development.
- Asia-Pacific: Experiencing rapid industrial expansion, a surging demand from its vast electronics and energy industries, and competitive advantages in production costs, positioning it as a key growth frontier.
- Key Countries: The United States, Germany, Japan, China, and South Korea are pivotal in driving global market demand and technological advancements in the fullerene sector.
Fullerene Industry Product Landscape
The fullerene product portfolio is impressively diverse, encompassing both pristine fullerenes, such as the foundational C60 and C70 molecules, and a wide array of functionalized derivatives engineered with precisely tailored properties. These advanced materials are finding indispensable applications across a multitude of sectors, owing to their exceptional characteristics, including high electrical conductivity, remarkable mechanical strength, and valuable biocompatibility. Continuous technological breakthroughs in synthesis and functionalization processes are instrumental in the creation of novel, high-performance fullerene products that offer enhanced efficacy and greater scalability. The unique selling propositions of these products lie in their ability to be precisely customized for specific application requirements and their capacity to deliver superior performance benchmarks compared to conventional materials.
Key Drivers, Barriers & Challenges in Fullerene Industry
Key Drivers:
- Growing demand from electronics and energy sectors.
- Advancements in synthesis and functionalization technologies.
- Increasing research and development activities.
- Favorable government policies and funding initiatives.
Key Challenges:
- High production costs limiting widespread adoption.
- Toxicity and environmental concerns requiring careful handling and disposal.
- Competition from alternative nanomaterials like carbon nanotubes and graphene.
- Supply chain complexities impacting material availability and pricing.
Emerging Opportunities in Fullerene Industry
Untapped markets in developing economies present significant opportunities. Innovative applications in drug delivery, medical imaging, and water purification are promising growth areas. Evolving consumer preferences for sustainable and high-performance materials offer further potential.
Growth Accelerators in the Fullerene Industry Industry
Technological breakthroughs in mass production techniques will drastically reduce costs, driving market expansion. Strategic partnerships between research institutions and industry players will facilitate innovation and accelerate commercialization. Expansion into new markets and applications will further propel growth.
Key Players Shaping the Fullerene Industry Market
- NanoMaterials Ltd
- IoLiTec - Ionic Liquid Tecgnologies GmbH
- Luna Industries Incorporated
- Mitsubishi Corporation
- Nano-C
- Nanotech Industrial Solutions
- SES Research Inc
- POWDER NANO
- Nanografi Nano technology
Notable Milestones in Fullerene Industry Sector
- 2020: Breakthrough in fullerene synthesis, leading to a significant enhancement in production yield and a notable reduction in manufacturing costs, paving the way for wider adoption.
- 2022: Introduction of a groundbreaking fullerene-based drug delivery system, showcasing the potential of functionalized fullerenes in advanced pharmaceutical applications.
- 2023: Formation of a strategic alliance between a leading electronics manufacturer and a prominent fullerene producer, focused on developing and integrating fullerenes into next-generation high-performance electronic devices.
- 2024: Publication of seminal research findings that conclusively demonstrate the excellent biocompatibility of various functionalized fullerene derivatives, further bolstering their prospects in biomedical and healthcare applications.
In-Depth Fullerene Industry Market Outlook
The fullerene industry is poised for substantial growth in the coming years. Continued technological advancements, coupled with expansion into new markets and applications, will drive significant market expansion. Strategic partnerships and investments in research and development will be crucial in shaping the future of this exciting industry.
Fullerene Industry Segmentation
-
1. Product Type
- 1.1. C60
- 1.2. C70
- 1.3. C76
- 1.4. Other Product Types
-
2. End-user Industry
- 2.1. Electrical and Electronics
- 2.2. Medical and Pharmaceuticals
- 2.3. Aerospace and Defense
- 2.4. Energy
- 2.5. Other End-user Industries
Fullerene Industry Segmentation By Geography
-
1. Asia Pacific
- 1.1. China
- 1.2. India
- 1.3. Japan
- 1.4. South Korea
- 1.5. ASEAN Countries
- 1.6. Rest of Asia Pacific
-
2. North America
- 2.1. United States
- 2.2. Canada
- 2.3. Mexico
-
3. Europe
- 3.1. Germany
- 3.2. United Kingdom
- 3.3. France
- 3.4. Italy
- 3.5. Rest of Europe
-
4. South America
- 4.1. Brazil
- 4.2. Argentina
- 4.3. Rest of South America
-
5. Middle East and Africa
- 5.1. Saudi Arabia
- 5.2. South Africa
- 5.3. Rest of Middle East and Africa

Fullerene Industry Regional Market Share
Geographic Coverage of Fullerene Industry
Fullerene Industry REPORT HIGHLIGHTS
| Aspects | Details |
|---|---|
| Study Period | 2020-2034 |
| Base Year | 2025 |
| Estimated Year | 2026 |
| Forecast Period | 2026-2034 |
| Historical Period | 2020-2025 |
| Growth Rate | CAGR of 8.97% from 2020-2034 |
| Segmentation |
|
Table of Contents
- 1. Introduction
- 1.1. Research Scope
- 1.2. Market Segmentation
- 1.3. Research Objective
- 1.4. Definitions and Assumptions
- 2. Executive Summary
- 2.1. Market Snapshot
- 3. Market Dynamics
- 3.1. Market Drivers
- 3.2. Market Restrains
- 3.3. Market Trends
- 3.4. Market Opportunities
- 4. Market Factor Analysis
- 4.1. Porters Five Forces
- 4.1.1. Bargaining Power of Suppliers
- 4.1.2. Bargaining Power of Buyers
- 4.1.3. Threat of New Entrants
- 4.1.4. Threat of Substitutes
- 4.1.5. Competitive Rivalry
- 4.2. PESTEL analysis
- 4.3. BCG Analysis
- 4.3.1. Stars (High Growth, High Market Share)
- 4.3.2. Cash Cows (Low Growth, High Market Share)
- 4.3.3. Question Mark (High Growth, Low Market Share)
- 4.3.4. Dogs (Low Growth, Low Market Share)
- 4.4. Ansoff Matrix Analysis
- 4.5. Supply Chain Analysis
- 4.6. Regulatory Landscape
- 4.7. Current Market Potential and Opportunity Assessment (TAM–SAM–SOM Framework)
- 4.8. VDR Analyst Note
- 4.1. Porters Five Forces
- 5. Market Analysis, Insights and Forecast 2021-2033
- 5.1. Market Analysis, Insights and Forecast - by Product Type
- 5.1.1. C60
- 5.1.2. C70
- 5.1.3. C76
- 5.1.4. Other Product Types
- 5.2. Market Analysis, Insights and Forecast - by End-user Industry
- 5.2.1. Electrical and Electronics
- 5.2.2. Medical and Pharmaceuticals
- 5.2.3. Aerospace and Defense
- 5.2.4. Energy
- 5.2.5. Other End-user Industries
- 5.3. Market Analysis, Insights and Forecast - by Region
- 5.3.1. Asia Pacific
- 5.3.2. North America
- 5.3.3. Europe
- 5.3.4. South America
- 5.3.5. Middle East and Africa
- 5.1. Market Analysis, Insights and Forecast - by Product Type
- 6. Global Fullerene Industry Analysis, Insights and Forecast, 2021-2033
- 6.1. Market Analysis, Insights and Forecast - by Product Type
- 6.1.1. C60
- 6.1.2. C70
- 6.1.3. C76
- 6.1.4. Other Product Types
- 6.2. Market Analysis, Insights and Forecast - by End-user Industry
- 6.2.1. Electrical and Electronics
- 6.2.2. Medical and Pharmaceuticals
- 6.2.3. Aerospace and Defense
- 6.2.4. Energy
- 6.2.5. Other End-user Industries
- 6.1. Market Analysis, Insights and Forecast - by Product Type
- 7. Asia Pacific Fullerene Industry Analysis, Insights and Forecast, 2021-2033
- 7.1. Market Analysis, Insights and Forecast - by Product Type
- 7.1.1. C60
- 7.1.2. C70
- 7.1.3. C76
- 7.1.4. Other Product Types
- 7.2. Market Analysis, Insights and Forecast - by End-user Industry
- 7.2.1. Electrical and Electronics
- 7.2.2. Medical and Pharmaceuticals
- 7.2.3. Aerospace and Defense
- 7.2.4. Energy
- 7.2.5. Other End-user Industries
- 7.1. Market Analysis, Insights and Forecast - by Product Type
- 8. North America Fullerene Industry Analysis, Insights and Forecast, 2021-2033
- 8.1. Market Analysis, Insights and Forecast - by Product Type
- 8.1.1. C60
- 8.1.2. C70
- 8.1.3. C76
- 8.1.4. Other Product Types
- 8.2. Market Analysis, Insights and Forecast - by End-user Industry
- 8.2.1. Electrical and Electronics
- 8.2.2. Medical and Pharmaceuticals
- 8.2.3. Aerospace and Defense
- 8.2.4. Energy
- 8.2.5. Other End-user Industries
- 8.1. Market Analysis, Insights and Forecast - by Product Type
- 9. Europe Fullerene Industry Analysis, Insights and Forecast, 2021-2033
- 9.1. Market Analysis, Insights and Forecast - by Product Type
- 9.1.1. C60
- 9.1.2. C70
- 9.1.3. C76
- 9.1.4. Other Product Types
- 9.2. Market Analysis, Insights and Forecast - by End-user Industry
- 9.2.1. Electrical and Electronics
- 9.2.2. Medical and Pharmaceuticals
- 9.2.3. Aerospace and Defense
- 9.2.4. Energy
- 9.2.5. Other End-user Industries
- 9.1. Market Analysis, Insights and Forecast - by Product Type
- 10. South America Fullerene Industry Analysis, Insights and Forecast, 2021-2033
- 10.1. Market Analysis, Insights and Forecast - by Product Type
- 10.1.1. C60
- 10.1.2. C70
- 10.1.3. C76
- 10.1.4. Other Product Types
- 10.2. Market Analysis, Insights and Forecast - by End-user Industry
- 10.2.1. Electrical and Electronics
- 10.2.2. Medical and Pharmaceuticals
- 10.2.3. Aerospace and Defense
- 10.2.4. Energy
- 10.2.5. Other End-user Industries
- 10.1. Market Analysis, Insights and Forecast - by Product Type
- 11. Middle East and Africa Fullerene Industry Analysis, Insights and Forecast, 2021-2033
- 11.1. Market Analysis, Insights and Forecast - by Product Type
- 11.1.1. C60
- 11.1.2. C70
- 11.1.3. C76
- 11.1.4. Other Product Types
- 11.2. Market Analysis, Insights and Forecast - by End-user Industry
- 11.2.1. Electrical and Electronics
- 11.2.2. Medical and Pharmaceuticals
- 11.2.3. Aerospace and Defense
- 11.2.4. Energy
- 11.2.5. Other End-user Industries
- 11.1. Market Analysis, Insights and Forecast - by Product Type
- 12. Competitive Analysis
- 12.1. Company Profiles
- 12.1.1 NanoMaterials Ltd
- 12.1.1.1. Company Overview
- 12.1.1.2. Products
- 12.1.1.3. Company Financials
- 12.1.1.4. SWOT Analysis
- 12.1.2 IoLiTec - Ionic Liquid Tecgnologies GmbH
- 12.1.2.1. Company Overview
- 12.1.2.2. Products
- 12.1.2.3. Company Financials
- 12.1.2.4. SWOT Analysis
- 12.1.3 Luna Industries Incorporated
- 12.1.3.1. Company Overview
- 12.1.3.2. Products
- 12.1.3.3. Company Financials
- 12.1.3.4. SWOT Analysis
- 12.1.4 Mitsubishi Corporation
- 12.1.4.1. Company Overview
- 12.1.4.2. Products
- 12.1.4.3. Company Financials
- 12.1.4.4. SWOT Analysis
- 12.1.5 Nano-C
- 12.1.5.1. Company Overview
- 12.1.5.2. Products
- 12.1.5.3. Company Financials
- 12.1.5.4. SWOT Analysis
- 12.1.6 Nanotech Industrial Solutions
- 12.1.6.1. Company Overview
- 12.1.6.2. Products
- 12.1.6.3. Company Financials
- 12.1.6.4. SWOT Analysis
- 12.1.7 SES Research Inc
- 12.1.7.1. Company Overview
- 12.1.7.2. Products
- 12.1.7.3. Company Financials
- 12.1.7.4. SWOT Analysis
- 12.1.8 POWDER NANO
- 12.1.8.1. Company Overview
- 12.1.8.2. Products
- 12.1.8.3. Company Financials
- 12.1.8.4. SWOT Analysis
- 12.1.9 Nanografi Nano technology*List Not Exhaustive
- 12.1.9.1. Company Overview
- 12.1.9.2. Products
- 12.1.9.3. Company Financials
- 12.1.9.4. SWOT Analysis
- 12.1.1 NanoMaterials Ltd
- 12.2. Market Entropy
- 12.2.1 Company's Key Areas Served
- 12.2.2 Recent Developments
- 12.3. Company Market Share Analysis 2025
- 12.3.1 Top 5 Companies Market Share Analysis
- 12.3.2 Top 3 Companies Market Share Analysis
- 12.4. List of Potential Customers
- 13. Research Methodology
List of Figures
- Figure 1: Global Fullerene Industry Revenue Breakdown (Million, %) by Region 2025 & 2033
- Figure 2: Global Fullerene Industry Volume Breakdown (Million, %) by Region 2025 & 2033
- Figure 3: Asia Pacific Fullerene Industry Revenue (Million), by Product Type 2025 & 2033
- Figure 4: Asia Pacific Fullerene Industry Volume (Million), by Product Type 2025 & 2033
- Figure 5: Asia Pacific Fullerene Industry Revenue Share (%), by Product Type 2025 & 2033
- Figure 6: Asia Pacific Fullerene Industry Volume Share (%), by Product Type 2025 & 2033
- Figure 7: Asia Pacific Fullerene Industry Revenue (Million), by End-user Industry 2025 & 2033
- Figure 8: Asia Pacific Fullerene Industry Volume (Million), by End-user Industry 2025 & 2033
- Figure 9: Asia Pacific Fullerene Industry Revenue Share (%), by End-user Industry 2025 & 2033
- Figure 10: Asia Pacific Fullerene Industry Volume Share (%), by End-user Industry 2025 & 2033
- Figure 11: Asia Pacific Fullerene Industry Revenue (Million), by Country 2025 & 2033
- Figure 12: Asia Pacific Fullerene Industry Volume (Million), by Country 2025 & 2033
- Figure 13: Asia Pacific Fullerene Industry Revenue Share (%), by Country 2025 & 2033
- Figure 14: Asia Pacific Fullerene Industry Volume Share (%), by Country 2025 & 2033
- Figure 15: North America Fullerene Industry Revenue (Million), by Product Type 2025 & 2033
- Figure 16: North America Fullerene Industry Volume (Million), by Product Type 2025 & 2033
- Figure 17: North America Fullerene Industry Revenue Share (%), by Product Type 2025 & 2033
- Figure 18: North America Fullerene Industry Volume Share (%), by Product Type 2025 & 2033
- Figure 19: North America Fullerene Industry Revenue (Million), by End-user Industry 2025 & 2033
- Figure 20: North America Fullerene Industry Volume (Million), by End-user Industry 2025 & 2033
- Figure 21: North America Fullerene Industry Revenue Share (%), by End-user Industry 2025 & 2033
- Figure 22: North America Fullerene Industry Volume Share (%), by End-user Industry 2025 & 2033
- Figure 23: North America Fullerene Industry Revenue (Million), by Country 2025 & 2033
- Figure 24: North America Fullerene Industry Volume (Million), by Country 2025 & 2033
- Figure 25: North America Fullerene Industry Revenue Share (%), by Country 2025 & 2033
- Figure 26: North America Fullerene Industry Volume Share (%), by Country 2025 & 2033
- Figure 27: Europe Fullerene Industry Revenue (Million), by Product Type 2025 & 2033
- Figure 28: Europe Fullerene Industry Volume (Million), by Product Type 2025 & 2033
- Figure 29: Europe Fullerene Industry Revenue Share (%), by Product Type 2025 & 2033
- Figure 30: Europe Fullerene Industry Volume Share (%), by Product Type 2025 & 2033
- Figure 31: Europe Fullerene Industry Revenue (Million), by End-user Industry 2025 & 2033
- Figure 32: Europe Fullerene Industry Volume (Million), by End-user Industry 2025 & 2033
- Figure 33: Europe Fullerene Industry Revenue Share (%), by End-user Industry 2025 & 2033
- Figure 34: Europe Fullerene Industry Volume Share (%), by End-user Industry 2025 & 2033
- Figure 35: Europe Fullerene Industry Revenue (Million), by Country 2025 & 2033
- Figure 36: Europe Fullerene Industry Volume (Million), by Country 2025 & 2033
- Figure 37: Europe Fullerene Industry Revenue Share (%), by Country 2025 & 2033
- Figure 38: Europe Fullerene Industry Volume Share (%), by Country 2025 & 2033
- Figure 39: South America Fullerene Industry Revenue (Million), by Product Type 2025 & 2033
- Figure 40: South America Fullerene Industry Volume (Million), by Product Type 2025 & 2033
- Figure 41: South America Fullerene Industry Revenue Share (%), by Product Type 2025 & 2033
- Figure 42: South America Fullerene Industry Volume Share (%), by Product Type 2025 & 2033
- Figure 43: South America Fullerene Industry Revenue (Million), by End-user Industry 2025 & 2033
- Figure 44: South America Fullerene Industry Volume (Million), by End-user Industry 2025 & 2033
- Figure 45: South America Fullerene Industry Revenue Share (%), by End-user Industry 2025 & 2033
- Figure 46: South America Fullerene Industry Volume Share (%), by End-user Industry 2025 & 2033
- Figure 47: South America Fullerene Industry Revenue (Million), by Country 2025 & 2033
- Figure 48: South America Fullerene Industry Volume (Million), by Country 2025 & 2033
- Figure 49: South America Fullerene Industry Revenue Share (%), by Country 2025 & 2033
- Figure 50: South America Fullerene Industry Volume Share (%), by Country 2025 & 2033
- Figure 51: Middle East and Africa Fullerene Industry Revenue (Million), by Product Type 2025 & 2033
- Figure 52: Middle East and Africa Fullerene Industry Volume (Million), by Product Type 2025 & 2033
- Figure 53: Middle East and Africa Fullerene Industry Revenue Share (%), by Product Type 2025 & 2033
- Figure 54: Middle East and Africa Fullerene Industry Volume Share (%), by Product Type 2025 & 2033
- Figure 55: Middle East and Africa Fullerene Industry Revenue (Million), by End-user Industry 2025 & 2033
- Figure 56: Middle East and Africa Fullerene Industry Volume (Million), by End-user Industry 2025 & 2033
- Figure 57: Middle East and Africa Fullerene Industry Revenue Share (%), by End-user Industry 2025 & 2033
- Figure 58: Middle East and Africa Fullerene Industry Volume Share (%), by End-user Industry 2025 & 2033
- Figure 59: Middle East and Africa Fullerene Industry Revenue (Million), by Country 2025 & 2033
- Figure 60: Middle East and Africa Fullerene Industry Volume (Million), by Country 2025 & 2033
- Figure 61: Middle East and Africa Fullerene Industry Revenue Share (%), by Country 2025 & 2033
- Figure 62: Middle East and Africa Fullerene Industry Volume Share (%), by Country 2025 & 2033
List of Tables
- Table 1: Global Fullerene Industry Revenue Million Forecast, by Product Type 2020 & 2033
- Table 2: Global Fullerene Industry Volume Million Forecast, by Product Type 2020 & 2033
- Table 3: Global Fullerene Industry Revenue Million Forecast, by End-user Industry 2020 & 2033
- Table 4: Global Fullerene Industry Volume Million Forecast, by End-user Industry 2020 & 2033
- Table 5: Global Fullerene Industry Revenue Million Forecast, by Region 2020 & 2033
- Table 6: Global Fullerene Industry Volume Million Forecast, by Region 2020 & 2033
- Table 7: Global Fullerene Industry Revenue Million Forecast, by Product Type 2020 & 2033
- Table 8: Global Fullerene Industry Volume Million Forecast, by Product Type 2020 & 2033
- Table 9: Global Fullerene Industry Revenue Million Forecast, by End-user Industry 2020 & 2033
- Table 10: Global Fullerene Industry Volume Million Forecast, by End-user Industry 2020 & 2033
- Table 11: Global Fullerene Industry Revenue Million Forecast, by Country 2020 & 2033
- Table 12: Global Fullerene Industry Volume Million Forecast, by Country 2020 & 2033
- Table 13: China Fullerene Industry Revenue (Million) Forecast, by Application 2020 & 2033
- Table 14: China Fullerene Industry Volume (Million) Forecast, by Application 2020 & 2033
- Table 15: India Fullerene Industry Revenue (Million) Forecast, by Application 2020 & 2033
- Table 16: India Fullerene Industry Volume (Million) Forecast, by Application 2020 & 2033
- Table 17: Japan Fullerene Industry Revenue (Million) Forecast, by Application 2020 & 2033
- Table 18: Japan Fullerene Industry Volume (Million) Forecast, by Application 2020 & 2033
- Table 19: South Korea Fullerene Industry Revenue (Million) Forecast, by Application 2020 & 2033
- Table 20: South Korea Fullerene Industry Volume (Million) Forecast, by Application 2020 & 2033
- Table 21: ASEAN Countries Fullerene Industry Revenue (Million) Forecast, by Application 2020 & 2033
- Table 22: ASEAN Countries Fullerene Industry Volume (Million) Forecast, by Application 2020 & 2033
- Table 23: Rest of Asia Pacific Fullerene Industry Revenue (Million) Forecast, by Application 2020 & 2033
- Table 24: Rest of Asia Pacific Fullerene Industry Volume (Million) Forecast, by Application 2020 & 2033
- Table 25: Global Fullerene Industry Revenue Million Forecast, by Product Type 2020 & 2033
- Table 26: Global Fullerene Industry Volume Million Forecast, by Product Type 2020 & 2033
- Table 27: Global Fullerene Industry Revenue Million Forecast, by End-user Industry 2020 & 2033
- Table 28: Global Fullerene Industry Volume Million Forecast, by End-user Industry 2020 & 2033
- Table 29: Global Fullerene Industry Revenue Million Forecast, by Country 2020 & 2033
- Table 30: Global Fullerene Industry Volume Million Forecast, by Country 2020 & 2033
- Table 31: United States Fullerene Industry Revenue (Million) Forecast, by Application 2020 & 2033
- Table 32: United States Fullerene Industry Volume (Million) Forecast, by Application 2020 & 2033
- Table 33: Canada Fullerene Industry Revenue (Million) Forecast, by Application 2020 & 2033
- Table 34: Canada Fullerene Industry Volume (Million) Forecast, by Application 2020 & 2033
- Table 35: Mexico Fullerene Industry Revenue (Million) Forecast, by Application 2020 & 2033
- Table 36: Mexico Fullerene Industry Volume (Million) Forecast, by Application 2020 & 2033
- Table 37: Global Fullerene Industry Revenue Million Forecast, by Product Type 2020 & 2033
- Table 38: Global Fullerene Industry Volume Million Forecast, by Product Type 2020 & 2033
- Table 39: Global Fullerene Industry Revenue Million Forecast, by End-user Industry 2020 & 2033
- Table 40: Global Fullerene Industry Volume Million Forecast, by End-user Industry 2020 & 2033
- Table 41: Global Fullerene Industry Revenue Million Forecast, by Country 2020 & 2033
- Table 42: Global Fullerene Industry Volume Million Forecast, by Country 2020 & 2033
- Table 43: Germany Fullerene Industry Revenue (Million) Forecast, by Application 2020 & 2033
- Table 44: Germany Fullerene Industry Volume (Million) Forecast, by Application 2020 & 2033
- Table 45: United Kingdom Fullerene Industry Revenue (Million) Forecast, by Application 2020 & 2033
- Table 46: United Kingdom Fullerene Industry Volume (Million) Forecast, by Application 2020 & 2033
- Table 47: France Fullerene Industry Revenue (Million) Forecast, by Application 2020 & 2033
- Table 48: France Fullerene Industry Volume (Million) Forecast, by Application 2020 & 2033
- Table 49: Italy Fullerene Industry Revenue (Million) Forecast, by Application 2020 & 2033
- Table 50: Italy Fullerene Industry Volume (Million) Forecast, by Application 2020 & 2033
- Table 51: Rest of Europe Fullerene Industry Revenue (Million) Forecast, by Application 2020 & 2033
- Table 52: Rest of Europe Fullerene Industry Volume (Million) Forecast, by Application 2020 & 2033
- Table 53: Global Fullerene Industry Revenue Million Forecast, by Product Type 2020 & 2033
- Table 54: Global Fullerene Industry Volume Million Forecast, by Product Type 2020 & 2033
- Table 55: Global Fullerene Industry Revenue Million Forecast, by End-user Industry 2020 & 2033
- Table 56: Global Fullerene Industry Volume Million Forecast, by End-user Industry 2020 & 2033
- Table 57: Global Fullerene Industry Revenue Million Forecast, by Country 2020 & 2033
- Table 58: Global Fullerene Industry Volume Million Forecast, by Country 2020 & 2033
- Table 59: Brazil Fullerene Industry Revenue (Million) Forecast, by Application 2020 & 2033
- Table 60: Brazil Fullerene Industry Volume (Million) Forecast, by Application 2020 & 2033
- Table 61: Argentina Fullerene Industry Revenue (Million) Forecast, by Application 2020 & 2033
- Table 62: Argentina Fullerene Industry Volume (Million) Forecast, by Application 2020 & 2033
- Table 63: Rest of South America Fullerene Industry Revenue (Million) Forecast, by Application 2020 & 2033
- Table 64: Rest of South America Fullerene Industry Volume (Million) Forecast, by Application 2020 & 2033
- Table 65: Global Fullerene Industry Revenue Million Forecast, by Product Type 2020 & 2033
- Table 66: Global Fullerene Industry Volume Million Forecast, by Product Type 2020 & 2033
- Table 67: Global Fullerene Industry Revenue Million Forecast, by End-user Industry 2020 & 2033
- Table 68: Global Fullerene Industry Volume Million Forecast, by End-user Industry 2020 & 2033
- Table 69: Global Fullerene Industry Revenue Million Forecast, by Country 2020 & 2033
- Table 70: Global Fullerene Industry Volume Million Forecast, by Country 2020 & 2033
- Table 71: Saudi Arabia Fullerene Industry Revenue (Million) Forecast, by Application 2020 & 2033
- Table 72: Saudi Arabia Fullerene Industry Volume (Million) Forecast, by Application 2020 & 2033
- Table 73: South Africa Fullerene Industry Revenue (Million) Forecast, by Application 2020 & 2033
- Table 74: South Africa Fullerene Industry Volume (Million) Forecast, by Application 2020 & 2033
- Table 75: Rest of Middle East and Africa Fullerene Industry Revenue (Million) Forecast, by Application 2020 & 2033
- Table 76: Rest of Middle East and Africa Fullerene Industry Volume (Million) Forecast, by Application 2020 & 2033
Frequently Asked Questions
1. What is the projected Compound Annual Growth Rate (CAGR) of the Fullerene Industry?
The projected CAGR is approximately 8.97%.
2. Which companies are prominent players in the Fullerene Industry?
Key companies in the market include NanoMaterials Ltd, IoLiTec - Ionic Liquid Tecgnologies GmbH, Luna Industries Incorporated, Mitsubishi Corporation, Nano-C, Nanotech Industrial Solutions, SES Research Inc, POWDER NANO, Nanografi Nano technology*List Not Exhaustive.
3. What are the main segments of the Fullerene Industry?
The market segments include Product Type, End-user Industry.
4. Can you provide details about the market size?
The market size is estimated to be USD 546.35 Million as of 2022.
5. What are some drivers contributing to market growth?
Increased usage in the Pharmaceutical Industry; Penetration in Surface Coatings Industry due to Strong Metal Matrix; Growing Demand of Fullerene as an Optical Limiter; Other Drivers.
6. What are the notable trends driving market growth?
Increasing Demand from Medical and Pharmaceutical Industry..
7. Are there any restraints impacting market growth?
Increased usage in the Pharmaceutical Industry; Penetration in Surface Coatings Industry due to Strong Metal Matrix; Growing Demand of Fullerene as an Optical Limiter; Other Drivers.
8. Can you provide examples of recent developments in the market?
Recent developments pertaining to the market studied will be covered in the complete report.
9. What pricing options are available for accessing the report?
Pricing options include single-user, multi-user, and enterprise licenses priced at USD 4750, USD 5250, and USD 8750 respectively.
10. Is the market size provided in terms of value or volume?
The market size is provided in terms of value, measured in Million and volume, measured in Million.
11. Are there any specific market keywords associated with the report?
Yes, the market keyword associated with the report is "Fullerene Industry," which aids in identifying and referencing the specific market segment covered.
12. How do I determine which pricing option suits my needs best?
The pricing options vary based on user requirements and access needs. Individual users may opt for single-user licenses, while businesses requiring broader access may choose multi-user or enterprise licenses for cost-effective access to the report.
13. Are there any additional resources or data provided in the Fullerene Industry report?
While the report offers comprehensive insights, it's advisable to review the specific contents or supplementary materials provided to ascertain if additional resources or data are available.
14. How can I stay updated on further developments or reports in the Fullerene Industry?
To stay informed about further developments, trends, and reports in the Fullerene Industry, consider subscribing to industry newsletters, following relevant companies and organizations, or regularly checking reputable industry news sources and publications.
Methodology
Step 1 - Identification of Relevant Samples Size from Population Database


Step 2 - Approaches for Defining Global Market Size (Value, Volume* & Price*)

Note*: In applicable scenarios
Step 3 - Data Sources
Primary Research
- Web Analytics
- Survey Reports
- Research Institute
- Latest Research Reports
- Opinion Leaders
Secondary Research
- Annual Reports
- White Paper
- Latest Press Release
- Industry Association
- Paid Database
- Investor Presentations

Step 4 - Data Triangulation
Involves using different sources of information in order to increase the validity of a study
These sources are likely to be stakeholders in a program - participants, other researchers, program staff, other community members, and so on.
Then we put all data in single framework & apply various statistical tools to find out the dynamic on the market.
During the analysis stage, feedback from the stakeholder groups would be compared to determine areas of agreement as well as areas of divergence