

Key Insights
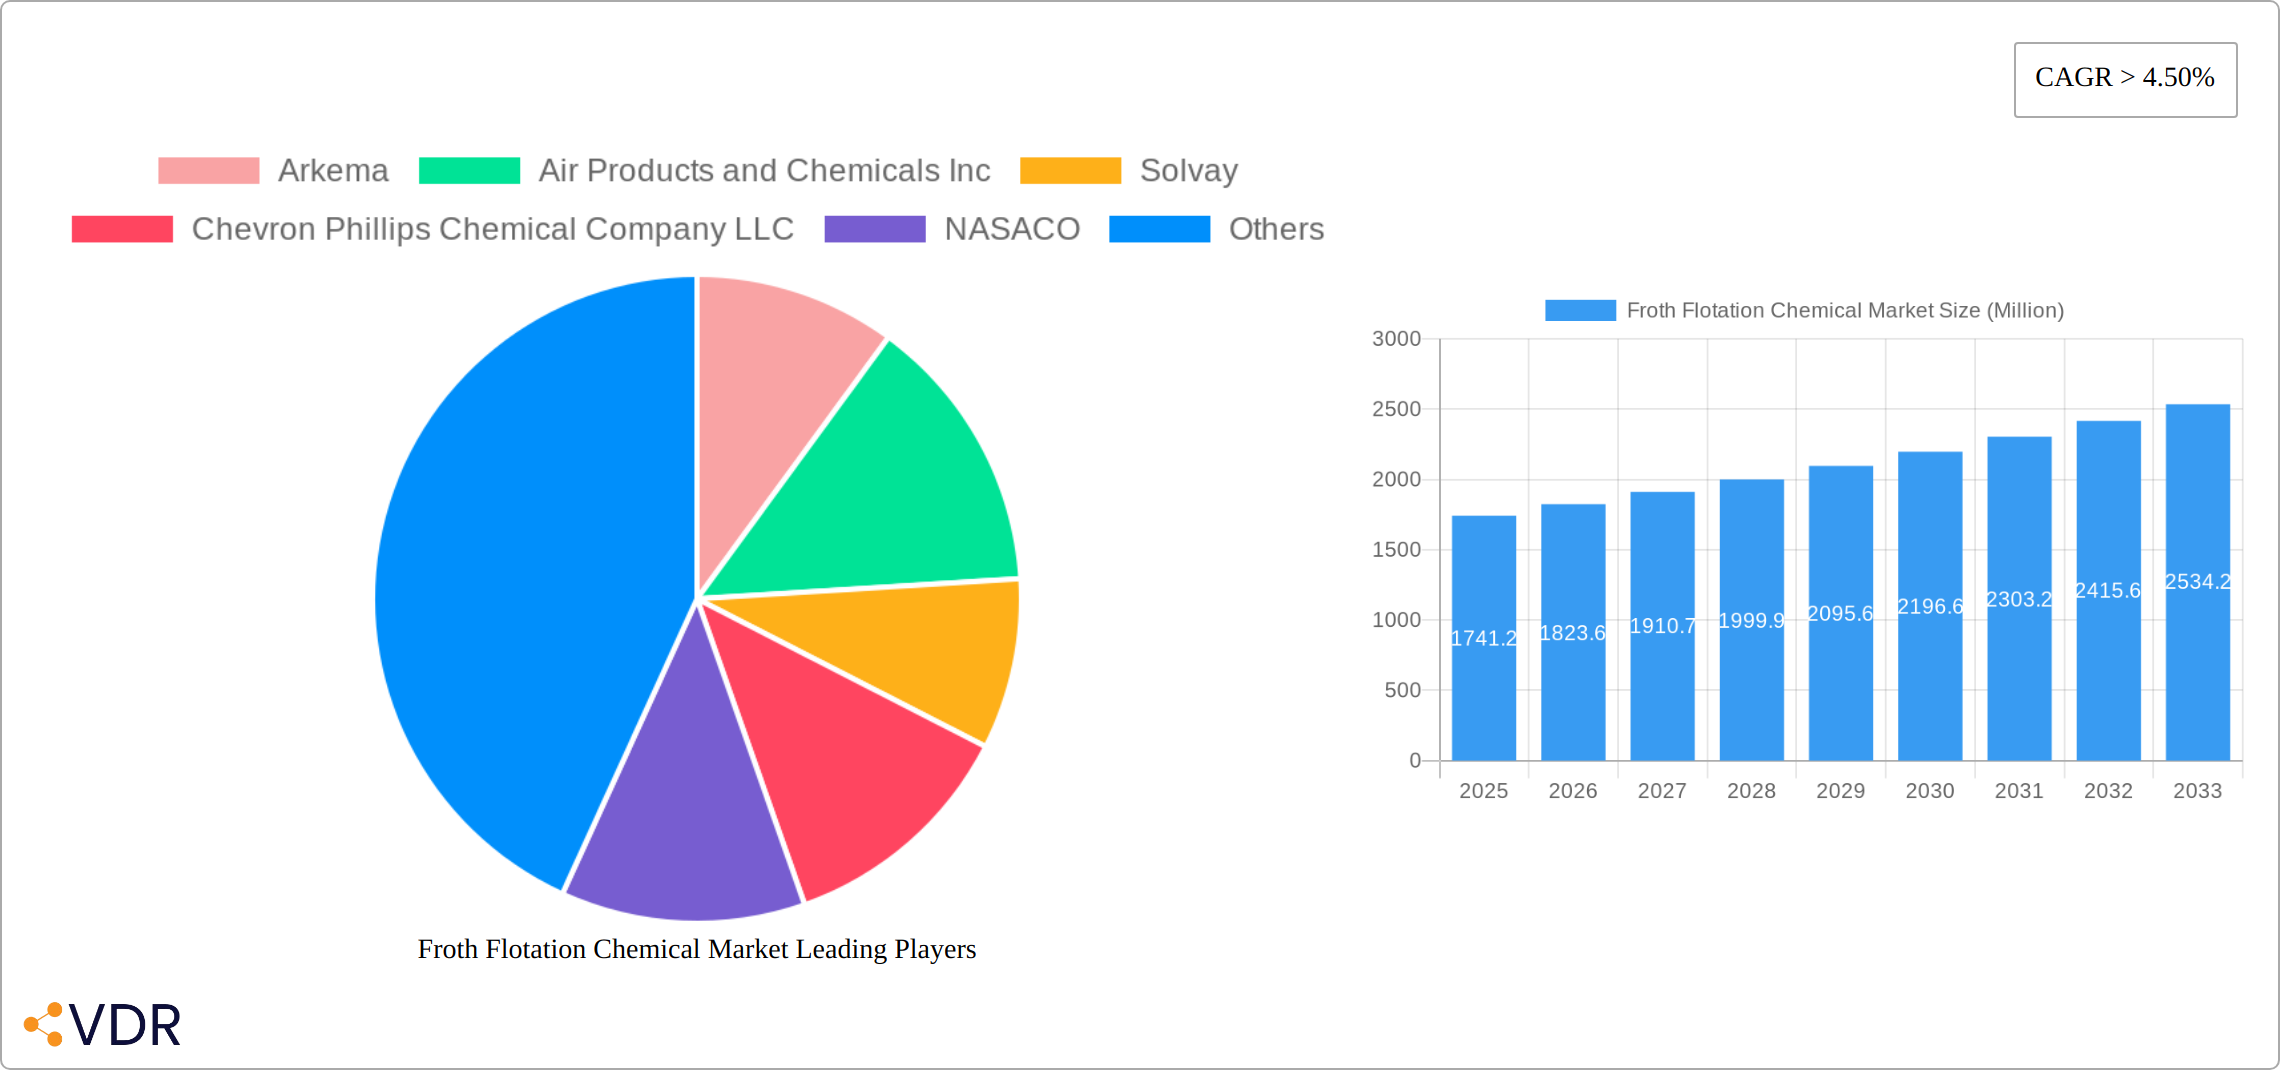
The Froth Flotation Chemical market, valued at $1741.2 million in 2025, is projected to experience robust growth with a CAGR exceeding 4.50% from 2025 to 2033. This expansion is driven by the increasing demand for efficient mineral processing techniques in the mining industry, particularly for base metals and precious minerals. The pulp and paper industry's reliance on froth flotation for fiber separation and wastewater treatment also contributes significantly to market growth. Furthermore, the rising adoption of sustainable and environmentally friendly froth flotation chemicals is shaping market trends, leading to the development of innovative reagents with improved selectivity and reduced environmental impact. Stringent environmental regulations globally are pushing companies to adopt cleaner technologies, further fueling market expansion. Key segments contributing to market growth include collectors and frothers, with collectors holding a larger market share due to their crucial role in mineral separation. Geographically, the Asia-Pacific region, driven by significant mining activities in China, India, and other countries, is expected to dominate the market, followed by North America and Europe.
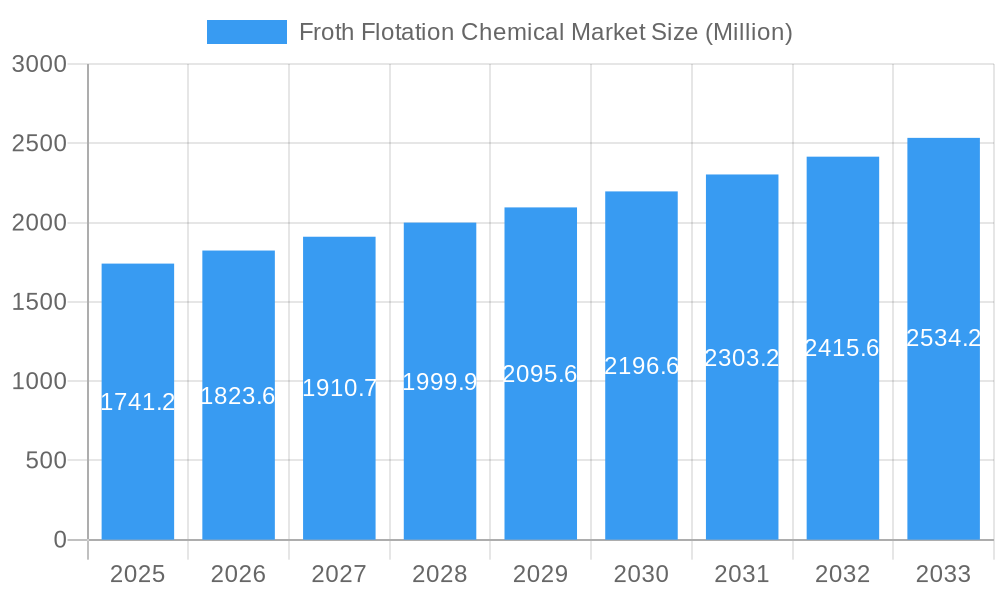
Froth Flotation Chemical Market Market Size (In Billion)
The market's growth trajectory is also influenced by several factors. Technological advancements leading to improved reagent performance and enhanced efficiency are key drivers. However, fluctuations in raw material prices and potential supply chain disruptions pose challenges. Competition among established players like Arkema, Air Products and Chemicals Inc., Solvay, and BASF SE, alongside the emergence of regional players, could influence pricing strategies and market share dynamics. The ongoing focus on optimizing energy consumption during froth flotation processes and the adoption of digital technologies for process control and optimization are likely to further shape the future of this market. The industry is constantly striving for improved selectivity and recovery rates, resulting in ongoing innovation in reagent chemistry and process design.
Froth Flotation Chemical Market Company Market Share
Froth Flotation Chemical Market Report: A Comprehensive Analysis (2019-2033)
This comprehensive report provides an in-depth analysis of the Froth Flotation Chemical market, encompassing market dynamics, growth trends, regional dominance, product landscape, challenges, opportunities, and key players. The study period covers 2019-2033, with a base year of 2025 and a forecast period of 2025-2033. The report is crucial for industry professionals, investors, and researchers seeking a thorough understanding of this vital sector within the broader chemical and mining industries. The market is segmented by reagent type (Collectors, Non-ionic: Frothers), neutral modifiers, deactivators, other reagent types, and end-user industry (Mining, Pulp and Paper, Industrial Waste and Sewage Treatment, Other End-user Industries).
Froth Flotation Chemical Market Market Dynamics & Structure
The Froth Flotation Chemical market exhibits a moderately concentrated structure, with key players such as Arkema, Air Products and Chemicals Inc., Solvay, Chevron Phillips Chemical Company LLC, NASACO, Nouryon, BASF SE, Kemira, Dow, and Clariant holding substantial market share. This market's dynamics are intricately shaped by several factors: rapid technological innovation, increasingly stringent environmental regulations globally, and the emergence of competitive substitute technologies. The mining industry continues to be the dominant end-user, driving a significant portion of the market demand. Mergers and acquisitions (M&A) activity remains at a moderate level, primarily focused on strengthening existing market positions and expanding product portfolios to offer more comprehensive solutions to clients.
Historically (2019-2024), the market demonstrated a Compound Annual Growth Rate (CAGR) of [Insert CAGR Percentage]%, resulting in a market size of [Insert Market Size in Millions] in 2025. Looking ahead, the forecast period (2025-2033) projects a CAGR of [Insert CAGR Percentage]%, with an anticipated market value of [Insert Projected Market Value in Millions] by 2033. This growth trajectory is fueled by several key factors detailed below.
- Market Concentration: Moderately concentrated, with the top 10 players commanding approximately [Insert Market Share Percentage]% of the market.
- Technological Innovation: A strong emphasis is placed on developing environmentally benign and highly efficient reagents. However, significant innovation barriers persist, including substantial R&D investments and navigating complex regulatory approval processes.
- Regulatory Frameworks: Stringent environmental regulations significantly influence reagent composition, production processes, and disposal methods, necessitating continuous adaptation by market players.
- Competitive Substitutes: The market faces competitive pressure from alternative mineral extraction techniques and the increasing adoption of bio-based reagents, prompting the need for continuous innovation and improvement.
- End-User Demographics: While the mining industry remains the primary driver, expanding demand from the pulp and paper, and wastewater treatment sectors presents promising new avenues for growth.
- M&A Trends: Moderate M&A activity is observed, predominantly driven by strategic acquisitions aimed at enhancing technological capabilities and expanding market reach. Approximately [Insert Number] M&A deals were recorded between 2019 and 2024.
Froth Flotation Chemical Market Growth Trends & Insights
The Froth Flotation Chemical market exhibits a steady growth trajectory, driven by increasing mining activities globally, expansion of the pulp and paper industry, and the growing need for efficient wastewater treatment. Technological advancements, including the introduction of AI-powered reagent optimization systems like Solvay's SmartFloat, are enhancing process efficiency and reducing operational costs. Consumer behavior shifts towards sustainable practices are also influencing demand for eco-friendly reagents. Market penetration within emerging economies is steadily increasing, further fueling market expansion. The market size is expected to grow from xx Million in 2025 to xx Million by 2033, reflecting a healthy CAGR of xx%. Adoption rates of advanced froth flotation technologies are increasing at a CAGR of xx%, driven primarily by cost reduction and efficiency improvements. Disruptive technologies such as AI-driven process optimization are significantly enhancing market dynamics and growth.
Dominant Regions, Countries, or Segments in Froth Flotation Chemical Market
The mining sector, particularly in regions with substantial mineral reserves like North America, Asia-Pacific and South America, drives the dominant segment of the froth flotation chemical market. Within reagent types, collectors hold the largest market share, followed by frothers.
- Key Drivers:
- Strong growth in mining and mineral extraction activities, especially in developing economies.
- Increasing demand for sustainable and environmentally friendly reagents.
- Technological advancements leading to improved efficiency and cost reduction.
- Favorable government policies promoting responsible mining practices.
- Dominant Regions: North America and Asia-Pacific hold the largest market share due to significant mining activities and robust industrial growth.
Froth Flotation Chemical Market Product Landscape
The Froth Flotation Chemical market offers a diverse range of products, including collectors, frothers, and modifiers, each tailored to specific mineral types and processing requirements. Recent innovations focus on enhancing selectivity, reducing reagent consumption, and minimizing environmental impact. Key features include improved performance metrics such as increased recovery rates, reduced reagent dosage, and enhanced selectivity for target minerals. Unique selling propositions emphasize environmental friendliness, cost-effectiveness, and superior performance.
Key Drivers, Barriers & Challenges in Froth Flotation Chemical Market
Key Drivers:
- Growing demand from the mining and mineral processing industry.
- Increasing focus on sustainable and environmentally friendly reagents.
- Technological advancements leading to improved efficiency and selectivity.
- Expansion of the pulp and paper and wastewater treatment sectors.
Key Challenges & Restraints:
- Fluctuations in raw material prices impacting production costs.
- Stringent environmental regulations and compliance requirements.
- Intense competition from existing and emerging players.
- Potential supply chain disruptions due to geopolitical instability. This resulted in a xx% increase in reagent costs in 2022.
Emerging Opportunities in Froth Flotation Chemical Market
- Expanding into untapped markets in developing economies.
- Development of novel reagents with enhanced selectivity and efficiency.
- Focus on circular economy principles to reduce waste and promote sustainability.
- Growing demand for AI-powered process optimization solutions.
- Increased use of bio-based reagents to address environmental concerns.
Growth Accelerators in the Froth Flotation Chemical Market Industry
Long-term growth will be fueled by technological breakthroughs in reagent design, strategic partnerships for market expansion, and investments in R&D to develop more sustainable and efficient products. The adoption of advanced analytics and AI-driven optimization tools will further enhance efficiency and reduce operational costs. Expansion into new geographical markets, particularly in emerging economies, presents a significant opportunity for growth.
Key Players Shaping the Froth Flotation Chemical Market Market
Notable Milestones in Froth Flotation Chemical Market Sector
- October 2022: Solvay launched 'SmartFloat,' an AI-based reagent optimization system, significantly improving froth flotation process efficiency and data utilization in the mining industry.
In-Depth Froth Flotation Chemical Market Market Outlook
The Froth Flotation Chemical market is poised for sustained growth, driven by technological innovations, increasing demand from various end-user industries, and the global focus on sustainable practices. Strategic partnerships, investments in R&D, and market expansion initiatives will play a crucial role in shaping the market's future. The market's potential is vast, with opportunities in developing eco-friendly reagents and leveraging digital solutions to optimize processes and reduce operational costs. This presents significant strategic opportunities for established players and new entrants alike.
Froth Flotation Chemical Market Segmentation
-
1. Reagent Type
-
1.1. Collectors
- 1.1.1. Cationic
- 1.1.2. Anionic
- 1.1.3. Non-ionic
-
1.2. Frothers
- 1.2.1. Acidic
- 1.2.2. Basic
- 1.2.3. Neutral
-
1.3. Modifiers
- 1.3.1. Acidic Depressants
- 1.3.2. pH modifiers
- 1.3.3. Activators
- 1.3.4. Deactivators
- 1.4. Other Reagent Types
-
1.1. Collectors
-
2. End-user Industry
- 2.1. Mining
- 2.2. Pulp and Paper
- 2.3. Industrial Waste and Sewage Treatment
- 2.4. Other End-user Industries
Froth Flotation Chemical Market Segmentation By Geography
-
1. Asia Pacific
- 1.1. China
- 1.2. India
- 1.3. Japan
- 1.4. South Korea
- 1.5. Rest of Asia Pacific
-
2. North America
- 2.1. United States
- 2.2. Canada
- 2.3. Mexico
-
3. Europe
- 3.1. Germany
- 3.2. United Kingdom
- 3.3. France
- 3.4. Italy
- 3.5. Rest of Europe
-
4. South America
- 4.1. Brazil
- 4.2. Argentina
- 4.3. Rest of South America
-
5. Middle East and Africa
- 5.1. Saudi Arabia
- 5.2. South Africa
- 5.3. Rest of Middle East and Africa
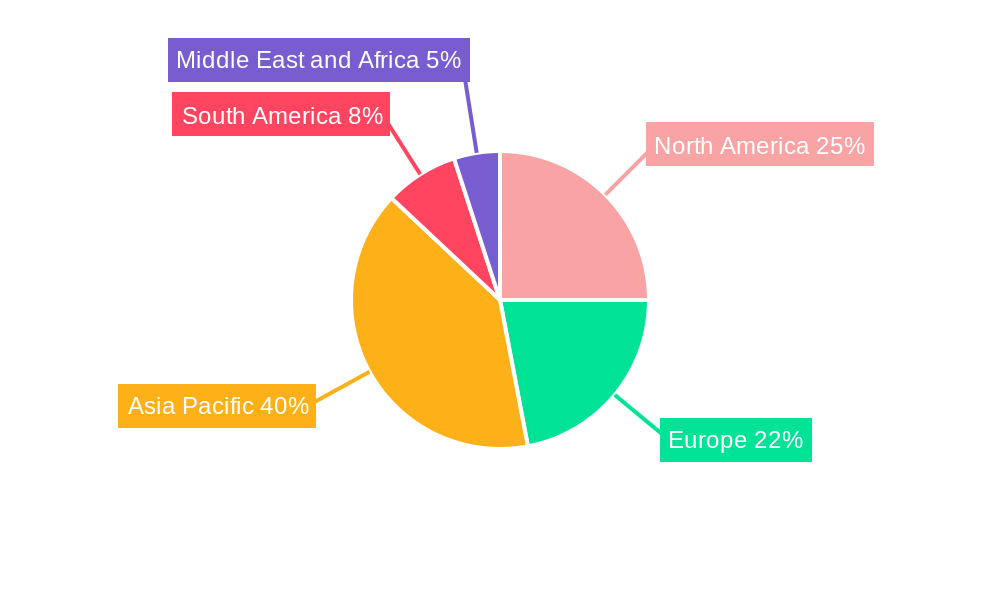
Froth Flotation Chemical Market Regional Market Share
Geographic Coverage of Froth Flotation Chemical Market
Froth Flotation Chemical Market REPORT HIGHLIGHTS
| Aspects | Details |
|---|---|
| Study Period | 2020-2034 |
| Base Year | 2025 |
| Estimated Year | 2026 |
| Forecast Period | 2026-2034 |
| Historical Period | 2020-2025 |
| Growth Rate | CAGR of > 4.50% from 2020-2034 |
| Segmentation |
|
Table of Contents
- 1. Introduction
- 1.1. Research Scope
- 1.2. Market Segmentation
- 1.3. Research Objective
- 1.4. Definitions and Assumptions
- 2. Executive Summary
- 2.1. Market Snapshot
- 3. Market Dynamics
- 3.1. Market Drivers
- 3.2. Market Restrains
- 3.3. Market Trends
- 3.4. Market Opportunities
- 4. Market Factor Analysis
- 4.1. Porters Five Forces
- 4.1.1. Bargaining Power of Suppliers
- 4.1.2. Bargaining Power of Buyers
- 4.1.3. Threat of New Entrants
- 4.1.4. Threat of Substitutes
- 4.1.5. Competitive Rivalry
- 4.2. PESTEL analysis
- 4.3. BCG Analysis
- 4.3.1. Stars (High Growth, High Market Share)
- 4.3.2. Cash Cows (Low Growth, High Market Share)
- 4.3.3. Question Mark (High Growth, Low Market Share)
- 4.3.4. Dogs (Low Growth, Low Market Share)
- 4.4. Ansoff Matrix Analysis
- 4.5. Supply Chain Analysis
- 4.6. Regulatory Landscape
- 4.7. Current Market Potential and Opportunity Assessment (TAM–SAM–SOM Framework)
- 4.8. VDR Analyst Note
- 4.1. Porters Five Forces
- 5. Market Analysis, Insights and Forecast 2021-2033
- 5.1. Market Analysis, Insights and Forecast - by Reagent Type
- 5.1.1. Collectors
- 5.1.1.1. Cationic
- 5.1.1.2. Anionic
- 5.1.1.3. Non-ionic
- 5.1.2. Frothers
- 5.1.2.1. Acidic
- 5.1.2.2. Basic
- 5.1.2.3. Neutral
- 5.1.3. Modifiers
- 5.1.3.1. Acidic Depressants
- 5.1.3.2. pH modifiers
- 5.1.3.3. Activators
- 5.1.3.4. Deactivators
- 5.1.4. Other Reagent Types
- 5.1.1. Collectors
- 5.2. Market Analysis, Insights and Forecast - by End-user Industry
- 5.2.1. Mining
- 5.2.2. Pulp and Paper
- 5.2.3. Industrial Waste and Sewage Treatment
- 5.2.4. Other End-user Industries
- 5.3. Market Analysis, Insights and Forecast - by Region
- 5.3.1. Asia Pacific
- 5.3.2. North America
- 5.3.3. Europe
- 5.3.4. South America
- 5.3.5. Middle East and Africa
- 5.1. Market Analysis, Insights and Forecast - by Reagent Type
- 6. Global Froth Flotation Chemical Market Analysis, Insights and Forecast, 2021-2033
- 6.1. Market Analysis, Insights and Forecast - by Reagent Type
- 6.1.1. Collectors
- 6.1.1.1. Cationic
- 6.1.1.2. Anionic
- 6.1.1.3. Non-ionic
- 6.1.2. Frothers
- 6.1.2.1. Acidic
- 6.1.2.2. Basic
- 6.1.2.3. Neutral
- 6.1.3. Modifiers
- 6.1.3.1. Acidic Depressants
- 6.1.3.2. pH modifiers
- 6.1.3.3. Activators
- 6.1.3.4. Deactivators
- 6.1.4. Other Reagent Types
- 6.1.1. Collectors
- 6.2. Market Analysis, Insights and Forecast - by End-user Industry
- 6.2.1. Mining
- 6.2.2. Pulp and Paper
- 6.2.3. Industrial Waste and Sewage Treatment
- 6.2.4. Other End-user Industries
- 6.1. Market Analysis, Insights and Forecast - by Reagent Type
- 7. Asia Pacific Froth Flotation Chemical Market Analysis, Insights and Forecast, 2021-2033
- 7.1. Market Analysis, Insights and Forecast - by Reagent Type
- 7.1.1. Collectors
- 7.1.1.1. Cationic
- 7.1.1.2. Anionic
- 7.1.1.3. Non-ionic
- 7.1.2. Frothers
- 7.1.2.1. Acidic
- 7.1.2.2. Basic
- 7.1.2.3. Neutral
- 7.1.3. Modifiers
- 7.1.3.1. Acidic Depressants
- 7.1.3.2. pH modifiers
- 7.1.3.3. Activators
- 7.1.3.4. Deactivators
- 7.1.4. Other Reagent Types
- 7.1.1. Collectors
- 7.2. Market Analysis, Insights and Forecast - by End-user Industry
- 7.2.1. Mining
- 7.2.2. Pulp and Paper
- 7.2.3. Industrial Waste and Sewage Treatment
- 7.2.4. Other End-user Industries
- 7.1. Market Analysis, Insights and Forecast - by Reagent Type
- 8. North America Froth Flotation Chemical Market Analysis, Insights and Forecast, 2021-2033
- 8.1. Market Analysis, Insights and Forecast - by Reagent Type
- 8.1.1. Collectors
- 8.1.1.1. Cationic
- 8.1.1.2. Anionic
- 8.1.1.3. Non-ionic
- 8.1.2. Frothers
- 8.1.2.1. Acidic
- 8.1.2.2. Basic
- 8.1.2.3. Neutral
- 8.1.3. Modifiers
- 8.1.3.1. Acidic Depressants
- 8.1.3.2. pH modifiers
- 8.1.3.3. Activators
- 8.1.3.4. Deactivators
- 8.1.4. Other Reagent Types
- 8.1.1. Collectors
- 8.2. Market Analysis, Insights and Forecast - by End-user Industry
- 8.2.1. Mining
- 8.2.2. Pulp and Paper
- 8.2.3. Industrial Waste and Sewage Treatment
- 8.2.4. Other End-user Industries
- 8.1. Market Analysis, Insights and Forecast - by Reagent Type
- 9. Europe Froth Flotation Chemical Market Analysis, Insights and Forecast, 2021-2033
- 9.1. Market Analysis, Insights and Forecast - by Reagent Type
- 9.1.1. Collectors
- 9.1.1.1. Cationic
- 9.1.1.2. Anionic
- 9.1.1.3. Non-ionic
- 9.1.2. Frothers
- 9.1.2.1. Acidic
- 9.1.2.2. Basic
- 9.1.2.3. Neutral
- 9.1.3. Modifiers
- 9.1.3.1. Acidic Depressants
- 9.1.3.2. pH modifiers
- 9.1.3.3. Activators
- 9.1.3.4. Deactivators
- 9.1.4. Other Reagent Types
- 9.1.1. Collectors
- 9.2. Market Analysis, Insights and Forecast - by End-user Industry
- 9.2.1. Mining
- 9.2.2. Pulp and Paper
- 9.2.3. Industrial Waste and Sewage Treatment
- 9.2.4. Other End-user Industries
- 9.1. Market Analysis, Insights and Forecast - by Reagent Type
- 10. South America Froth Flotation Chemical Market Analysis, Insights and Forecast, 2021-2033
- 10.1. Market Analysis, Insights and Forecast - by Reagent Type
- 10.1.1. Collectors
- 10.1.1.1. Cationic
- 10.1.1.2. Anionic
- 10.1.1.3. Non-ionic
- 10.1.2. Frothers
- 10.1.2.1. Acidic
- 10.1.2.2. Basic
- 10.1.2.3. Neutral
- 10.1.3. Modifiers
- 10.1.3.1. Acidic Depressants
- 10.1.3.2. pH modifiers
- 10.1.3.3. Activators
- 10.1.3.4. Deactivators
- 10.1.4. Other Reagent Types
- 10.1.1. Collectors
- 10.2. Market Analysis, Insights and Forecast - by End-user Industry
- 10.2.1. Mining
- 10.2.2. Pulp and Paper
- 10.2.3. Industrial Waste and Sewage Treatment
- 10.2.4. Other End-user Industries
- 10.1. Market Analysis, Insights and Forecast - by Reagent Type
- 11. Middle East and Africa Froth Flotation Chemical Market Analysis, Insights and Forecast, 2021-2033
- 11.1. Market Analysis, Insights and Forecast - by Reagent Type
- 11.1.1. Collectors
- 11.1.1.1. Cationic
- 11.1.1.2. Anionic
- 11.1.1.3. Non-ionic
- 11.1.2. Frothers
- 11.1.2.1. Acidic
- 11.1.2.2. Basic
- 11.1.2.3. Neutral
- 11.1.3. Modifiers
- 11.1.3.1. Acidic Depressants
- 11.1.3.2. pH modifiers
- 11.1.3.3. Activators
- 11.1.3.4. Deactivators
- 11.1.4. Other Reagent Types
- 11.1.1. Collectors
- 11.2. Market Analysis, Insights and Forecast - by End-user Industry
- 11.2.1. Mining
- 11.2.2. Pulp and Paper
- 11.2.3. Industrial Waste and Sewage Treatment
- 11.2.4. Other End-user Industries
- 11.1. Market Analysis, Insights and Forecast - by Reagent Type
- 12. Competitive Analysis
- 12.1. Company Profiles
- 12.1.1 Arkema
- 12.1.1.1. Company Overview
- 12.1.1.2. Products
- 12.1.1.3. Company Financials
- 12.1.1.4. SWOT Analysis
- 12.1.2 Air Products and Chemicals Inc
- 12.1.2.1. Company Overview
- 12.1.2.2. Products
- 12.1.2.3. Company Financials
- 12.1.2.4. SWOT Analysis
- 12.1.3 Solvay
- 12.1.3.1. Company Overview
- 12.1.3.2. Products
- 12.1.3.3. Company Financials
- 12.1.3.4. SWOT Analysis
- 12.1.4 Chevron Phillips Chemical Company LLC
- 12.1.4.1. Company Overview
- 12.1.4.2. Products
- 12.1.4.3. Company Financials
- 12.1.4.4. SWOT Analysis
- 12.1.5 NASACO
- 12.1.5.1. Company Overview
- 12.1.5.2. Products
- 12.1.5.3. Company Financials
- 12.1.5.4. SWOT Analysis
- 12.1.6 Nouryon*List Not Exhaustive
- 12.1.6.1. Company Overview
- 12.1.6.2. Products
- 12.1.6.3. Company Financials
- 12.1.6.4. SWOT Analysis
- 12.1.7 BASF SE
- 12.1.7.1. Company Overview
- 12.1.7.2. Products
- 12.1.7.3. Company Financials
- 12.1.7.4. SWOT Analysis
- 12.1.8 Kemira
- 12.1.8.1. Company Overview
- 12.1.8.2. Products
- 12.1.8.3. Company Financials
- 12.1.8.4. SWOT Analysis
- 12.1.9 Dow
- 12.1.9.1. Company Overview
- 12.1.9.2. Products
- 12.1.9.3. Company Financials
- 12.1.9.4. SWOT Analysis
- 12.1.10 CLARIANT
- 12.1.10.1. Company Overview
- 12.1.10.2. Products
- 12.1.10.3. Company Financials
- 12.1.10.4. SWOT Analysis
- 12.1.1 Arkema
- 12.2. Market Entropy
- 12.2.1 Company's Key Areas Served
- 12.2.2 Recent Developments
- 12.3. Company Market Share Analysis 2025
- 12.3.1 Top 5 Companies Market Share Analysis
- 12.3.2 Top 3 Companies Market Share Analysis
- 12.4. List of Potential Customers
- 13. Research Methodology
List of Figures
- Figure 1: Global Froth Flotation Chemical Market Revenue Breakdown (Million, %) by Region 2025 & 2033
- Figure 2: Global Froth Flotation Chemical Market Volume Breakdown (K Tons, %) by Region 2025 & 2033
- Figure 3: Asia Pacific Froth Flotation Chemical Market Revenue (Million), by Reagent Type 2025 & 2033
- Figure 4: Asia Pacific Froth Flotation Chemical Market Volume (K Tons), by Reagent Type 2025 & 2033
- Figure 5: Asia Pacific Froth Flotation Chemical Market Revenue Share (%), by Reagent Type 2025 & 2033
- Figure 6: Asia Pacific Froth Flotation Chemical Market Volume Share (%), by Reagent Type 2025 & 2033
- Figure 7: Asia Pacific Froth Flotation Chemical Market Revenue (Million), by End-user Industry 2025 & 2033
- Figure 8: Asia Pacific Froth Flotation Chemical Market Volume (K Tons), by End-user Industry 2025 & 2033
- Figure 9: Asia Pacific Froth Flotation Chemical Market Revenue Share (%), by End-user Industry 2025 & 2033
- Figure 10: Asia Pacific Froth Flotation Chemical Market Volume Share (%), by End-user Industry 2025 & 2033
- Figure 11: Asia Pacific Froth Flotation Chemical Market Revenue (Million), by Country 2025 & 2033
- Figure 12: Asia Pacific Froth Flotation Chemical Market Volume (K Tons), by Country 2025 & 2033
- Figure 13: Asia Pacific Froth Flotation Chemical Market Revenue Share (%), by Country 2025 & 2033
- Figure 14: Asia Pacific Froth Flotation Chemical Market Volume Share (%), by Country 2025 & 2033
- Figure 15: North America Froth Flotation Chemical Market Revenue (Million), by Reagent Type 2025 & 2033
- Figure 16: North America Froth Flotation Chemical Market Volume (K Tons), by Reagent Type 2025 & 2033
- Figure 17: North America Froth Flotation Chemical Market Revenue Share (%), by Reagent Type 2025 & 2033
- Figure 18: North America Froth Flotation Chemical Market Volume Share (%), by Reagent Type 2025 & 2033
- Figure 19: North America Froth Flotation Chemical Market Revenue (Million), by End-user Industry 2025 & 2033
- Figure 20: North America Froth Flotation Chemical Market Volume (K Tons), by End-user Industry 2025 & 2033
- Figure 21: North America Froth Flotation Chemical Market Revenue Share (%), by End-user Industry 2025 & 2033
- Figure 22: North America Froth Flotation Chemical Market Volume Share (%), by End-user Industry 2025 & 2033
- Figure 23: North America Froth Flotation Chemical Market Revenue (Million), by Country 2025 & 2033
- Figure 24: North America Froth Flotation Chemical Market Volume (K Tons), by Country 2025 & 2033
- Figure 25: North America Froth Flotation Chemical Market Revenue Share (%), by Country 2025 & 2033
- Figure 26: North America Froth Flotation Chemical Market Volume Share (%), by Country 2025 & 2033
- Figure 27: Europe Froth Flotation Chemical Market Revenue (Million), by Reagent Type 2025 & 2033
- Figure 28: Europe Froth Flotation Chemical Market Volume (K Tons), by Reagent Type 2025 & 2033
- Figure 29: Europe Froth Flotation Chemical Market Revenue Share (%), by Reagent Type 2025 & 2033
- Figure 30: Europe Froth Flotation Chemical Market Volume Share (%), by Reagent Type 2025 & 2033
- Figure 31: Europe Froth Flotation Chemical Market Revenue (Million), by End-user Industry 2025 & 2033
- Figure 32: Europe Froth Flotation Chemical Market Volume (K Tons), by End-user Industry 2025 & 2033
- Figure 33: Europe Froth Flotation Chemical Market Revenue Share (%), by End-user Industry 2025 & 2033
- Figure 34: Europe Froth Flotation Chemical Market Volume Share (%), by End-user Industry 2025 & 2033
- Figure 35: Europe Froth Flotation Chemical Market Revenue (Million), by Country 2025 & 2033
- Figure 36: Europe Froth Flotation Chemical Market Volume (K Tons), by Country 2025 & 2033
- Figure 37: Europe Froth Flotation Chemical Market Revenue Share (%), by Country 2025 & 2033
- Figure 38: Europe Froth Flotation Chemical Market Volume Share (%), by Country 2025 & 2033
- Figure 39: South America Froth Flotation Chemical Market Revenue (Million), by Reagent Type 2025 & 2033
- Figure 40: South America Froth Flotation Chemical Market Volume (K Tons), by Reagent Type 2025 & 2033
- Figure 41: South America Froth Flotation Chemical Market Revenue Share (%), by Reagent Type 2025 & 2033
- Figure 42: South America Froth Flotation Chemical Market Volume Share (%), by Reagent Type 2025 & 2033
- Figure 43: South America Froth Flotation Chemical Market Revenue (Million), by End-user Industry 2025 & 2033
- Figure 44: South America Froth Flotation Chemical Market Volume (K Tons), by End-user Industry 2025 & 2033
- Figure 45: South America Froth Flotation Chemical Market Revenue Share (%), by End-user Industry 2025 & 2033
- Figure 46: South America Froth Flotation Chemical Market Volume Share (%), by End-user Industry 2025 & 2033
- Figure 47: South America Froth Flotation Chemical Market Revenue (Million), by Country 2025 & 2033
- Figure 48: South America Froth Flotation Chemical Market Volume (K Tons), by Country 2025 & 2033
- Figure 49: South America Froth Flotation Chemical Market Revenue Share (%), by Country 2025 & 2033
- Figure 50: South America Froth Flotation Chemical Market Volume Share (%), by Country 2025 & 2033
- Figure 51: Middle East and Africa Froth Flotation Chemical Market Revenue (Million), by Reagent Type 2025 & 2033
- Figure 52: Middle East and Africa Froth Flotation Chemical Market Volume (K Tons), by Reagent Type 2025 & 2033
- Figure 53: Middle East and Africa Froth Flotation Chemical Market Revenue Share (%), by Reagent Type 2025 & 2033
- Figure 54: Middle East and Africa Froth Flotation Chemical Market Volume Share (%), by Reagent Type 2025 & 2033
- Figure 55: Middle East and Africa Froth Flotation Chemical Market Revenue (Million), by End-user Industry 2025 & 2033
- Figure 56: Middle East and Africa Froth Flotation Chemical Market Volume (K Tons), by End-user Industry 2025 & 2033
- Figure 57: Middle East and Africa Froth Flotation Chemical Market Revenue Share (%), by End-user Industry 2025 & 2033
- Figure 58: Middle East and Africa Froth Flotation Chemical Market Volume Share (%), by End-user Industry 2025 & 2033
- Figure 59: Middle East and Africa Froth Flotation Chemical Market Revenue (Million), by Country 2025 & 2033
- Figure 60: Middle East and Africa Froth Flotation Chemical Market Volume (K Tons), by Country 2025 & 2033
- Figure 61: Middle East and Africa Froth Flotation Chemical Market Revenue Share (%), by Country 2025 & 2033
- Figure 62: Middle East and Africa Froth Flotation Chemical Market Volume Share (%), by Country 2025 & 2033
List of Tables
- Table 1: Global Froth Flotation Chemical Market Revenue Million Forecast, by Reagent Type 2020 & 2033
- Table 2: Global Froth Flotation Chemical Market Volume K Tons Forecast, by Reagent Type 2020 & 2033
- Table 3: Global Froth Flotation Chemical Market Revenue Million Forecast, by End-user Industry 2020 & 2033
- Table 4: Global Froth Flotation Chemical Market Volume K Tons Forecast, by End-user Industry 2020 & 2033
- Table 5: Global Froth Flotation Chemical Market Revenue Million Forecast, by Region 2020 & 2033
- Table 6: Global Froth Flotation Chemical Market Volume K Tons Forecast, by Region 2020 & 2033
- Table 7: Global Froth Flotation Chemical Market Revenue Million Forecast, by Reagent Type 2020 & 2033
- Table 8: Global Froth Flotation Chemical Market Volume K Tons Forecast, by Reagent Type 2020 & 2033
- Table 9: Global Froth Flotation Chemical Market Revenue Million Forecast, by End-user Industry 2020 & 2033
- Table 10: Global Froth Flotation Chemical Market Volume K Tons Forecast, by End-user Industry 2020 & 2033
- Table 11: Global Froth Flotation Chemical Market Revenue Million Forecast, by Country 2020 & 2033
- Table 12: Global Froth Flotation Chemical Market Volume K Tons Forecast, by Country 2020 & 2033
- Table 13: China Froth Flotation Chemical Market Revenue (Million) Forecast, by Application 2020 & 2033
- Table 14: China Froth Flotation Chemical Market Volume (K Tons) Forecast, by Application 2020 & 2033
- Table 15: India Froth Flotation Chemical Market Revenue (Million) Forecast, by Application 2020 & 2033
- Table 16: India Froth Flotation Chemical Market Volume (K Tons) Forecast, by Application 2020 & 2033
- Table 17: Japan Froth Flotation Chemical Market Revenue (Million) Forecast, by Application 2020 & 2033
- Table 18: Japan Froth Flotation Chemical Market Volume (K Tons) Forecast, by Application 2020 & 2033
- Table 19: South Korea Froth Flotation Chemical Market Revenue (Million) Forecast, by Application 2020 & 2033
- Table 20: South Korea Froth Flotation Chemical Market Volume (K Tons) Forecast, by Application 2020 & 2033
- Table 21: Rest of Asia Pacific Froth Flotation Chemical Market Revenue (Million) Forecast, by Application 2020 & 2033
- Table 22: Rest of Asia Pacific Froth Flotation Chemical Market Volume (K Tons) Forecast, by Application 2020 & 2033
- Table 23: Global Froth Flotation Chemical Market Revenue Million Forecast, by Reagent Type 2020 & 2033
- Table 24: Global Froth Flotation Chemical Market Volume K Tons Forecast, by Reagent Type 2020 & 2033
- Table 25: Global Froth Flotation Chemical Market Revenue Million Forecast, by End-user Industry 2020 & 2033
- Table 26: Global Froth Flotation Chemical Market Volume K Tons Forecast, by End-user Industry 2020 & 2033
- Table 27: Global Froth Flotation Chemical Market Revenue Million Forecast, by Country 2020 & 2033
- Table 28: Global Froth Flotation Chemical Market Volume K Tons Forecast, by Country 2020 & 2033
- Table 29: United States Froth Flotation Chemical Market Revenue (Million) Forecast, by Application 2020 & 2033
- Table 30: United States Froth Flotation Chemical Market Volume (K Tons) Forecast, by Application 2020 & 2033
- Table 31: Canada Froth Flotation Chemical Market Revenue (Million) Forecast, by Application 2020 & 2033
- Table 32: Canada Froth Flotation Chemical Market Volume (K Tons) Forecast, by Application 2020 & 2033
- Table 33: Mexico Froth Flotation Chemical Market Revenue (Million) Forecast, by Application 2020 & 2033
- Table 34: Mexico Froth Flotation Chemical Market Volume (K Tons) Forecast, by Application 2020 & 2033
- Table 35: Global Froth Flotation Chemical Market Revenue Million Forecast, by Reagent Type 2020 & 2033
- Table 36: Global Froth Flotation Chemical Market Volume K Tons Forecast, by Reagent Type 2020 & 2033
- Table 37: Global Froth Flotation Chemical Market Revenue Million Forecast, by End-user Industry 2020 & 2033
- Table 38: Global Froth Flotation Chemical Market Volume K Tons Forecast, by End-user Industry 2020 & 2033
- Table 39: Global Froth Flotation Chemical Market Revenue Million Forecast, by Country 2020 & 2033
- Table 40: Global Froth Flotation Chemical Market Volume K Tons Forecast, by Country 2020 & 2033
- Table 41: Germany Froth Flotation Chemical Market Revenue (Million) Forecast, by Application 2020 & 2033
- Table 42: Germany Froth Flotation Chemical Market Volume (K Tons) Forecast, by Application 2020 & 2033
- Table 43: United Kingdom Froth Flotation Chemical Market Revenue (Million) Forecast, by Application 2020 & 2033
- Table 44: United Kingdom Froth Flotation Chemical Market Volume (K Tons) Forecast, by Application 2020 & 2033
- Table 45: France Froth Flotation Chemical Market Revenue (Million) Forecast, by Application 2020 & 2033
- Table 46: France Froth Flotation Chemical Market Volume (K Tons) Forecast, by Application 2020 & 2033
- Table 47: Italy Froth Flotation Chemical Market Revenue (Million) Forecast, by Application 2020 & 2033
- Table 48: Italy Froth Flotation Chemical Market Volume (K Tons) Forecast, by Application 2020 & 2033
- Table 49: Rest of Europe Froth Flotation Chemical Market Revenue (Million) Forecast, by Application 2020 & 2033
- Table 50: Rest of Europe Froth Flotation Chemical Market Volume (K Tons) Forecast, by Application 2020 & 2033
- Table 51: Global Froth Flotation Chemical Market Revenue Million Forecast, by Reagent Type 2020 & 2033
- Table 52: Global Froth Flotation Chemical Market Volume K Tons Forecast, by Reagent Type 2020 & 2033
- Table 53: Global Froth Flotation Chemical Market Revenue Million Forecast, by End-user Industry 2020 & 2033
- Table 54: Global Froth Flotation Chemical Market Volume K Tons Forecast, by End-user Industry 2020 & 2033
- Table 55: Global Froth Flotation Chemical Market Revenue Million Forecast, by Country 2020 & 2033
- Table 56: Global Froth Flotation Chemical Market Volume K Tons Forecast, by Country 2020 & 2033
- Table 57: Brazil Froth Flotation Chemical Market Revenue (Million) Forecast, by Application 2020 & 2033
- Table 58: Brazil Froth Flotation Chemical Market Volume (K Tons) Forecast, by Application 2020 & 2033
- Table 59: Argentina Froth Flotation Chemical Market Revenue (Million) Forecast, by Application 2020 & 2033
- Table 60: Argentina Froth Flotation Chemical Market Volume (K Tons) Forecast, by Application 2020 & 2033
- Table 61: Rest of South America Froth Flotation Chemical Market Revenue (Million) Forecast, by Application 2020 & 2033
- Table 62: Rest of South America Froth Flotation Chemical Market Volume (K Tons) Forecast, by Application 2020 & 2033
- Table 63: Global Froth Flotation Chemical Market Revenue Million Forecast, by Reagent Type 2020 & 2033
- Table 64: Global Froth Flotation Chemical Market Volume K Tons Forecast, by Reagent Type 2020 & 2033
- Table 65: Global Froth Flotation Chemical Market Revenue Million Forecast, by End-user Industry 2020 & 2033
- Table 66: Global Froth Flotation Chemical Market Volume K Tons Forecast, by End-user Industry 2020 & 2033
- Table 67: Global Froth Flotation Chemical Market Revenue Million Forecast, by Country 2020 & 2033
- Table 68: Global Froth Flotation Chemical Market Volume K Tons Forecast, by Country 2020 & 2033
- Table 69: Saudi Arabia Froth Flotation Chemical Market Revenue (Million) Forecast, by Application 2020 & 2033
- Table 70: Saudi Arabia Froth Flotation Chemical Market Volume (K Tons) Forecast, by Application 2020 & 2033
- Table 71: South Africa Froth Flotation Chemical Market Revenue (Million) Forecast, by Application 2020 & 2033
- Table 72: South Africa Froth Flotation Chemical Market Volume (K Tons) Forecast, by Application 2020 & 2033
- Table 73: Rest of Middle East and Africa Froth Flotation Chemical Market Revenue (Million) Forecast, by Application 2020 & 2033
- Table 74: Rest of Middle East and Africa Froth Flotation Chemical Market Volume (K Tons) Forecast, by Application 2020 & 2033
Frequently Asked Questions
1. What is the projected Compound Annual Growth Rate (CAGR) of the Froth Flotation Chemical Market?
The projected CAGR is approximately > 4.50%.
2. Which companies are prominent players in the Froth Flotation Chemical Market?
Key companies in the market include Arkema, Air Products and Chemicals Inc, Solvay, Chevron Phillips Chemical Company LLC, NASACO, Nouryon*List Not Exhaustive, BASF SE, Kemira, Dow, CLARIANT.
3. What are the main segments of the Froth Flotation Chemical Market?
The market segments include Reagent Type, End-user Industry.
4. Can you provide details about the market size?
The market size is estimated to be USD 1741.2 Million as of 2022.
5. What are some drivers contributing to market growth?
Rising Demand for Froth Flotation Chemicals in Asia-Pacific; Increasing Mining Activities in Canada and Mexico; Other Drivers.
6. What are the notable trends driving market growth?
Rising Demand from the Mining Industry.
7. Are there any restraints impacting market growth?
Stringent Policies and Changing Regulatory Landscape Exist in North America and Europe; Other Restraints.
8. Can you provide examples of recent developments in the market?
October 2022: Solvay launched a digital mining solution, 'SmartFloat,' an AI-based reagent optimization system. It helps mining companies capture more value from their data and optimize froth flotation processes.
9. What pricing options are available for accessing the report?
Pricing options include single-user, multi-user, and enterprise licenses priced at USD 4750, USD 5250, and USD 8750 respectively.
10. Is the market size provided in terms of value or volume?
The market size is provided in terms of value, measured in Million and volume, measured in K Tons.
11. Are there any specific market keywords associated with the report?
Yes, the market keyword associated with the report is "Froth Flotation Chemical Market," which aids in identifying and referencing the specific market segment covered.
12. How do I determine which pricing option suits my needs best?
The pricing options vary based on user requirements and access needs. Individual users may opt for single-user licenses, while businesses requiring broader access may choose multi-user or enterprise licenses for cost-effective access to the report.
13. Are there any additional resources or data provided in the Froth Flotation Chemical Market report?
While the report offers comprehensive insights, it's advisable to review the specific contents or supplementary materials provided to ascertain if additional resources or data are available.
14. How can I stay updated on further developments or reports in the Froth Flotation Chemical Market?
To stay informed about further developments, trends, and reports in the Froth Flotation Chemical Market, consider subscribing to industry newsletters, following relevant companies and organizations, or regularly checking reputable industry news sources and publications.
Methodology
Step 1 - Identification of Relevant Samples Size from Population Database


Step 2 - Approaches for Defining Global Market Size (Value, Volume* & Price*)

Note*: In applicable scenarios
Step 3 - Data Sources
Primary Research
- Web Analytics
- Survey Reports
- Research Institute
- Latest Research Reports
- Opinion Leaders
Secondary Research
- Annual Reports
- White Paper
- Latest Press Release
- Industry Association
- Paid Database
- Investor Presentations

Step 4 - Data Triangulation
Involves using different sources of information in order to increase the validity of a study
These sources are likely to be stakeholders in a program - participants, other researchers, program staff, other community members, and so on.
Then we put all data in single framework & apply various statistical tools to find out the dynamic on the market.
During the analysis stage, feedback from the stakeholder groups would be compared to determine areas of agreement as well as areas of divergence