
Key Insights
The global frac stack market, encompassing equipment and services for hydraulic fracturing, is experiencing robust growth, driven by the persistent demand for oil and gas extraction, particularly in unconventional reservoirs like shale formations. The market's Compound Annual Growth Rate (CAGR) exceeding 5% indicates a significant expansion projected through 2033. Key drivers include the increasing adoption of advanced fracturing technologies to enhance well productivity, the exploration and development of new shale reserves across North America, Europe, and Asia-Pacific, and the ongoing global energy demand. The market is segmented by location (onshore and offshore) and well type (horizontal/deviated and vertical), reflecting variations in technological requirements and operational complexities. Onshore operations currently dominate, given the extensive shale gas reserves and established infrastructure. However, offshore fracturing is expected to see growth driven by deepwater exploration. Horizontal and deviated well types are expected to continue driving market demand due to their higher production efficiency compared to vertical wells. Major players, including Halliburton, Baker Hughes, Schlumberger, and others, are actively investing in research and development to enhance efficiency, reduce costs, and develop environmentally friendly fracturing techniques.
While the market exhibits significant growth potential, certain restraints exist. Fluctuations in oil and gas prices directly impact investment in exploration and production, potentially slowing down market growth. Environmental concerns related to water usage and induced seismicity are leading to stricter regulations and potentially higher operational costs. Competition among major players also keeps margins under pressure. Nevertheless, the long-term outlook remains positive, fueled by sustained global energy demands, technological advancements in fracturing techniques, and exploration of new unconventional resources. The increasing adoption of automation and digitalization in fracturing operations will further shape the market landscape, optimizing efficiency and cost-effectiveness. The geographical distribution of market share is likely skewed towards North America in the near term, given its established shale gas industry. However, growing exploration activities in Asia-Pacific and other regions are anticipated to diversify the market geography over the forecast period.
Frac Stack Industry Market Report: 2019-2033
This comprehensive report provides an in-depth analysis of the global Frac Stack industry, offering invaluable insights for industry professionals, investors, and strategic decision-makers. Covering the period from 2019 to 2033, with a focus on 2025, this report meticulously examines market dynamics, growth trends, regional dominance, product landscapes, and key players shaping this dynamic sector. The report also analyzes the parent market (Oil and Gas Services) and the child market (Hydraulic Fracturing Equipment).
Frac Stack Industry Market Dynamics & Structure
This section analyzes the Frac Stack market's competitive landscape, technological advancements, regulatory influences, and market trends. The market is characterized by a moderate level of concentration, with key players holding significant market shares. However, the emergence of smaller, specialized providers is also noteworthy.
- Market Concentration: The top 10 companies account for approximately xx% of the global market share in 2025 (estimated).
- Technological Innovation: Continuous improvement in pump technology, automation, and data analytics drives efficiency gains and reduces operational costs. However, high initial investment costs present a barrier to entry for some smaller players.
- Regulatory Framework: Stringent environmental regulations and safety standards significantly influence operational practices and technological choices. Compliance costs represent a substantial factor for companies.
- Competitive Product Substitutes: While frac stacks remain the dominant technology, alternative fracturing methods are emerging, though their market penetration remains limited (xx% in 2025, estimated).
- M&A Trends: The industry has witnessed a wave of mergers and acquisitions (M&A) activity, particularly during 2020-2021, driven by the need to consolidate market share, access technology, and improve economies of scale. The total M&A deal value during this period is estimated at $xx million. Deal volume increased significantly during this time.
Frac Stack Industry Growth Trends & Insights
The global frac stack market experienced substantial growth during the historical period (2019-2024), driven primarily by increased oil and gas production activities. The market size is projected to reach $xx million in 2025 (estimated), exhibiting a CAGR of xx% during the forecast period (2025-2033). This growth is fueled by increasing exploration and production activities in key regions, particularly North America and the Middle East. Technological advancements in hydraulic fracturing techniques continue to enhance efficiency and reduce costs, further stimulating market growth. The adoption rate of advanced frac stack technologies is expected to increase steadily, driven by the need for improved performance and reduced environmental impact.
Dominant Regions, Countries, or Segments in Frac Stack Industry
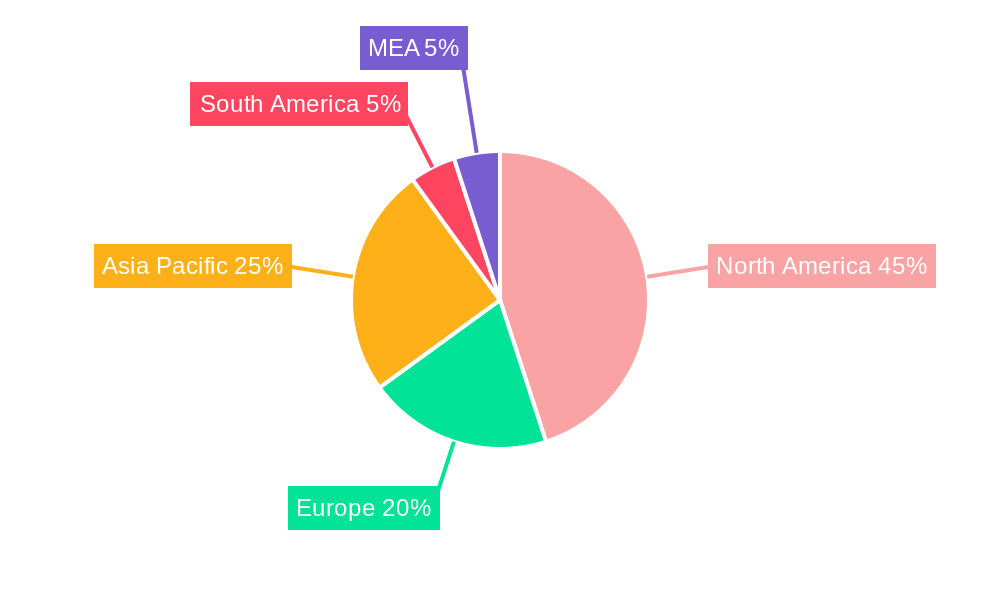
The North American market, especially the United States, remains the dominant region in the frac stack industry, accounting for approximately xx% of the global market share in 2025 (estimated). This dominance is largely attributed to extensive shale gas reserves and robust oil and gas production activities. The Middle East and Asia-Pacific regions are also experiencing significant growth, driven by investments in oil and gas infrastructure and increasing energy demands.
- Onshore vs. Offshore: Onshore deployments dominate the market (xx% in 2025, estimated) due to the higher concentration of oil and gas wells in these areas.
- Horizontal and Deviated vs. Vertical Wells: The vast majority of frac stack applications are in horizontal and deviated wells (xx% in 2025, estimated), reflecting the prevalent trend towards exploiting unconventional oil and gas reservoirs.
- Key Drivers:
- Abundant shale gas reserves in North America.
- Investments in oil and gas exploration and production.
- Government policies supporting domestic energy production.
- Technological advancements improving efficiency and cost-effectiveness.
Frac Stack Industry Product Landscape
Frac stack technology continues to evolve, with improvements focused on increasing efficiency, reducing environmental impact, and enhancing safety. Innovations include advanced pump designs, automated control systems, and the integration of data analytics for real-time monitoring and optimization. These advancements are aimed at maximizing production, minimizing downtime, and improving the overall cost-effectiveness of hydraulic fracturing operations. The industry is also witnessing an increasing adoption of environmentally friendly proppants and fluids to address environmental concerns.
Key Drivers, Barriers & Challenges in Frac Stack Industry
Key Drivers: Increased demand for oil and gas, technological advancements (automation, data analytics), and government incentives for energy production are primary drivers.
Key Challenges: Fluctuating oil and gas prices, stringent environmental regulations, and intense competition among service providers pose significant challenges. Supply chain disruptions can also impact operations and costs (estimated xx% increase in costs in 2022 due to supply chain issues).
Emerging Opportunities in Frac Stack Industry
Emerging markets in developing countries, particularly in Asia and Africa, present significant opportunities for market expansion. Technological advancements like advanced materials and improved automation offer potential for further efficiency gains and cost reductions. The growing focus on sustainability also presents opportunities for providers offering eco-friendly solutions.
Growth Accelerators in the Frac Stack Industry Industry
Continued investments in R&D to develop more efficient and sustainable frac stack technologies are crucial for long-term growth. Strategic partnerships and collaborations between equipment manufacturers and service providers can enhance market penetration and innovation. Expansion into new geographical markets and diversification of service offerings also contribute to sustained growth.
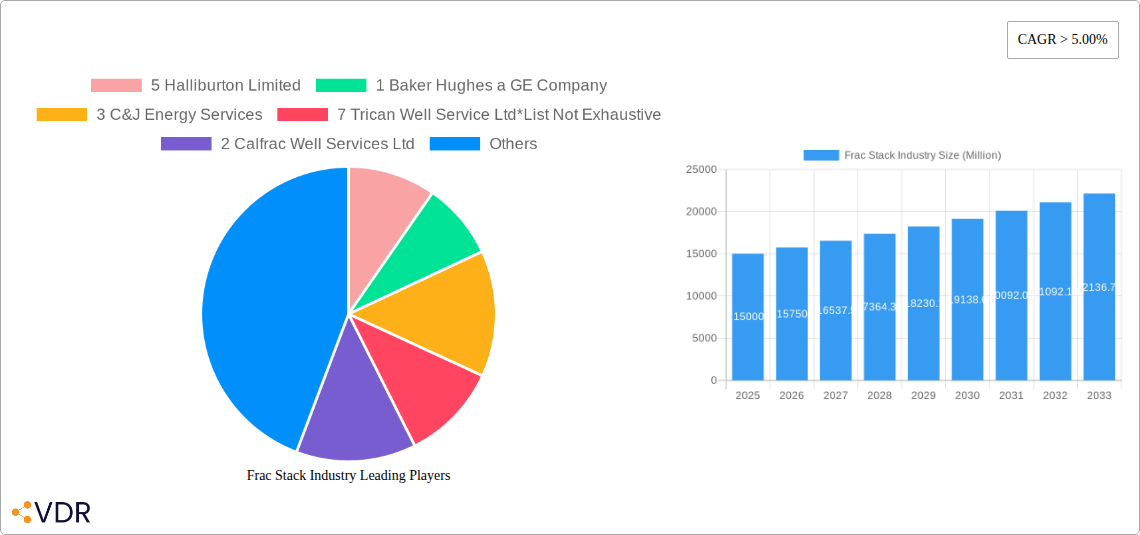
Key Players Shaping the Frac Stack Industry Market
- Halliburton Limited (Halliburton)
- Baker Hughes a GE Company (Baker Hughes)
- C&J Energy Services
- Covenant Testing Technologies LLC
- Calfrac Well Services Ltd
- The Weir Group PLC (The Weir Group)
- Yantai Jereh Petroleum Equipment & Technologies Co
- Trican Well Service Ltd
- Schlumberger Limited (Schlumberger)
- CCSC Petroleum Equipment Ltd Co
- FTS International Inc
- Oil States Energy Services
Notable Milestones in Frac Stack Industry Sector
- November 2021: Regiment LLC expands its Permian Basin operations by acquiring significant pressure pumping equipment, increasing its hydraulic HP capacity to over 75,000.
- September 2021: Regiment LLC acquires a fleet of pumps and high-specification frac stack equipment.
- August 2020: Covenant Testing Technologies LLC merges with Stuart Pressure Control, broadening its service portfolio in key shale plays.
In-Depth Frac Stack Industry Market Outlook
The future of the frac stack industry is bright, driven by continued demand for oil and gas, especially in developing economies. Technological innovation, strategic partnerships, and expansion into new markets will be key drivers of growth. Companies that prioritize sustainability, efficiency, and safety will be well-positioned to capitalize on emerging opportunities and achieve long-term success. The market is expected to continue its growth trajectory, with significant potential for expansion in emerging economies and further technological advancement.
Frac Stack Industry Segmentation
-
1. Location of Deployment
- 1.1. Onshore
- 1.2. Offshore
-
2. Well Type
- 2.1. Horizontal and Deviated
- 2.2. Vertical
Frac Stack Industry Segmentation By Geography
- 1. North America
- 2. Europe
- 3. Asia Pacific
- 4. South America
- 5. Middle East and Africa
Frac Stack Industry REPORT HIGHLIGHTS
| Aspects | Details |
|---|---|
| Study Period | 2019-2033 |
| Base Year | 2024 |
| Estimated Year | 2025 |
| Forecast Period | 2025-2033 |
| Historical Period | 2019-2024 |
| Growth Rate | CAGR of > 5.00% from 2019-2033 |
| Segmentation |
|
Table of Contents
- 1. Introduction
- 1.1. Research Scope
- 1.2. Market Segmentation
- 1.3. Research Methodology
- 1.4. Definitions and Assumptions
- 2. Executive Summary
- 2.1. Introduction
- 3. Market Dynamics
- 3.1. Introduction
- 3.2. Market Drivers
- 3.2.1. 4.; Increasing Demand for Wood Pellets in Clean Energy Generation4.; Growing Wood Pellet Manufacturing Infrastructure
- 3.3. Market Restrains
- 3.3.1. 4.; The Adoption and Increasing Deployment of Alternative Renewable Energy
- 3.4. Market Trends
- 3.4.1. The Onshore Sector is Expected to Dominate the Market
- 4. Market Factor Analysis
- 4.1. Porters Five Forces
- 4.2. Supply/Value Chain
- 4.3. PESTEL analysis
- 4.4. Market Entropy
- 4.5. Patent/Trademark Analysis
- 5. Global Frac Stack Industry Analysis, Insights and Forecast, 2019-2031
- 5.1. Market Analysis, Insights and Forecast - by Location of Deployment
- 5.1.1. Onshore
- 5.1.2. Offshore
- 5.2. Market Analysis, Insights and Forecast - by Well Type
- 5.2.1. Horizontal and Deviated
- 5.2.2. Vertical
- 5.3. Market Analysis, Insights and Forecast - by Region
- 5.3.1. North America
- 5.3.2. Europe
- 5.3.3. Asia Pacific
- 5.3.4. South America
- 5.3.5. Middle East and Africa
- 5.1. Market Analysis, Insights and Forecast - by Location of Deployment
- 6. North America Frac Stack Industry Analysis, Insights and Forecast, 2019-2031
- 6.1. Market Analysis, Insights and Forecast - by Location of Deployment
- 6.1.1. Onshore
- 6.1.2. Offshore
- 6.2. Market Analysis, Insights and Forecast - by Well Type
- 6.2.1. Horizontal and Deviated
- 6.2.2. Vertical
- 6.1. Market Analysis, Insights and Forecast - by Location of Deployment
- 7. Europe Frac Stack Industry Analysis, Insights and Forecast, 2019-2031
- 7.1. Market Analysis, Insights and Forecast - by Location of Deployment
- 7.1.1. Onshore
- 7.1.2. Offshore
- 7.2. Market Analysis, Insights and Forecast - by Well Type
- 7.2.1. Horizontal and Deviated
- 7.2.2. Vertical
- 7.1. Market Analysis, Insights and Forecast - by Location of Deployment
- 8. Asia Pacific Frac Stack Industry Analysis, Insights and Forecast, 2019-2031
- 8.1. Market Analysis, Insights and Forecast - by Location of Deployment
- 8.1.1. Onshore
- 8.1.2. Offshore
- 8.2. Market Analysis, Insights and Forecast - by Well Type
- 8.2.1. Horizontal and Deviated
- 8.2.2. Vertical
- 8.1. Market Analysis, Insights and Forecast - by Location of Deployment
- 9. South America Frac Stack Industry Analysis, Insights and Forecast, 2019-2031
- 9.1. Market Analysis, Insights and Forecast - by Location of Deployment
- 9.1.1. Onshore
- 9.1.2. Offshore
- 9.2. Market Analysis, Insights and Forecast - by Well Type
- 9.2.1. Horizontal and Deviated
- 9.2.2. Vertical
- 9.1. Market Analysis, Insights and Forecast - by Location of Deployment
- 10. Middle East and Africa Frac Stack Industry Analysis, Insights and Forecast, 2019-2031
- 10.1. Market Analysis, Insights and Forecast - by Location of Deployment
- 10.1.1. Onshore
- 10.1.2. Offshore
- 10.2. Market Analysis, Insights and Forecast - by Well Type
- 10.2.1. Horizontal and Deviated
- 10.2.2. Vertical
- 10.1. Market Analysis, Insights and Forecast - by Location of Deployment
- 11. North America Frac Stack Industry Analysis, Insights and Forecast, 2019-2031
- 11.1. Market Analysis, Insights and Forecast - By Country/Sub-region
- 11.1.1 United States
- 11.1.2 Canada
- 11.1.3 Mexico
- 12. Europe Frac Stack Industry Analysis, Insights and Forecast, 2019-2031
- 12.1. Market Analysis, Insights and Forecast - By Country/Sub-region
- 12.1.1 Germany
- 12.1.2 United Kingdom
- 12.1.3 France
- 12.1.4 Spain
- 12.1.5 Italy
- 12.1.6 Spain
- 12.1.7 Belgium
- 12.1.8 Netherland
- 12.1.9 Nordics
- 12.1.10 Rest of Europe
- 13. Asia Pacific Frac Stack Industry Analysis, Insights and Forecast, 2019-2031
- 13.1. Market Analysis, Insights and Forecast - By Country/Sub-region
- 13.1.1 China
- 13.1.2 Japan
- 13.1.3 India
- 13.1.4 South Korea
- 13.1.5 Southeast Asia
- 13.1.6 Australia
- 13.1.7 Indonesia
- 13.1.8 Phillipes
- 13.1.9 Singapore
- 13.1.10 Thailandc
- 13.1.11 Rest of Asia Pacific
- 14. South America Frac Stack Industry Analysis, Insights and Forecast, 2019-2031
- 14.1. Market Analysis, Insights and Forecast - By Country/Sub-region
- 14.1.1 Brazil
- 14.1.2 Argentina
- 14.1.3 Peru
- 14.1.4 Chile
- 14.1.5 Colombia
- 14.1.6 Ecuador
- 14.1.7 Venezuela
- 14.1.8 Rest of South America
- 15. North America Frac Stack Industry Analysis, Insights and Forecast, 2019-2031
- 15.1. Market Analysis, Insights and Forecast - By Country/Sub-region
- 15.1.1 United States
- 15.1.2 Canada
- 15.1.3 Mexico
- 16. MEA Frac Stack Industry Analysis, Insights and Forecast, 2019-2031
- 16.1. Market Analysis, Insights and Forecast - By Country/Sub-region
- 16.1.1 United Arab Emirates
- 16.1.2 Saudi Arabia
- 16.1.3 South Africa
- 16.1.4 Rest of Middle East and Africa
- 17. Competitive Analysis
- 17.1. Global Market Share Analysis 2024
- 17.2. Company Profiles
- 17.2.1 5 Halliburton Limited
- 17.2.1.1. Overview
- 17.2.1.2. Products
- 17.2.1.3. SWOT Analysis
- 17.2.1.4. Recent Developments
- 17.2.1.5. Financials (Based on Availability)
- 17.2.2 1 Baker Hughes a GE Company
- 17.2.2.1. Overview
- 17.2.2.2. Products
- 17.2.2.3. SWOT Analysis
- 17.2.2.4. Recent Developments
- 17.2.2.5. Financials (Based on Availability)
- 17.2.3 3 C&J Energy Services
- 17.2.3.1. Overview
- 17.2.3.2. Products
- 17.2.3.3. SWOT Analysis
- 17.2.3.4. Recent Developments
- 17.2.3.5. Financials (Based on Availability)
- 17.2.4 7 Trican Well Service Ltd*List Not Exhaustive
- 17.2.4.1. Overview
- 17.2.4.2. Products
- 17.2.4.3. SWOT Analysis
- 17.2.4.4. Recent Developments
- 17.2.4.5. Financials (Based on Availability)
- 17.2.5 2 Calfrac Well Services Ltd
- 17.2.5.1. Overview
- 17.2.5.2. Products
- 17.2.5.3. SWOT Analysis
- 17.2.5.4. Recent Developments
- 17.2.5.5. Financials (Based on Availability)
- 17.2.6 5 The Weir Group PLC
- 17.2.6.1. Overview
- 17.2.6.2. Products
- 17.2.6.3. SWOT Analysis
- 17.2.6.4. Recent Developments
- 17.2.6.5. Financials (Based on Availability)
- 17.2.7 6 Yantai Jereh Petroleum Equipment & Technologies Co
- 17.2.7.1. Overview
- 17.2.7.2. Products
- 17.2.7.3. SWOT Analysis
- 17.2.7.4. Recent Developments
- 17.2.7.5. Financials (Based on Availability)
- 17.2.8 4 Covenant Testing Technologies LLC
- 17.2.8.1. Overview
- 17.2.8.2. Products
- 17.2.8.3. SWOT Analysis
- 17.2.8.4. Recent Developments
- 17.2.8.5. Financials (Based on Availability)
- 17.2.9 Fracturing Service Providers
- 17.2.9.1. Overview
- 17.2.9.2. Products
- 17.2.9.3. SWOT Analysis
- 17.2.9.4. Recent Developments
- 17.2.9.5. Financials (Based on Availability)
- 17.2.10 6 Schlumberger Limited
- 17.2.10.1. Overview
- 17.2.10.2. Products
- 17.2.10.3. SWOT Analysis
- 17.2.10.4. Recent Developments
- 17.2.10.5. Financials (Based on Availability)
- 17.2.11 1 CCSC Petroleum Equipment Ltd Co
- 17.2.11.1. Overview
- 17.2.11.2. Products
- 17.2.11.3. SWOT Analysis
- 17.2.11.4. Recent Developments
- 17.2.11.5. Financials (Based on Availability)
- 17.2.12 3 Schlumberger Limited
- 17.2.12.1. Overview
- 17.2.12.2. Products
- 17.2.12.3. SWOT Analysis
- 17.2.12.4. Recent Developments
- 17.2.12.5. Financials (Based on Availability)
- 17.2.13 4 FTS International Inc
- 17.2.13.1. Overview
- 17.2.13.2. Products
- 17.2.13.3. SWOT Analysis
- 17.2.13.4. Recent Developments
- 17.2.13.5. Financials (Based on Availability)
- 17.2.14 2 Oil States Energy Services
- 17.2.14.1. Overview
- 17.2.14.2. Products
- 17.2.14.3. SWOT Analysis
- 17.2.14.4. Recent Developments
- 17.2.14.5. Financials (Based on Availability)
- 17.2.15 Equipment Manufacturers
- 17.2.15.1. Overview
- 17.2.15.2. Products
- 17.2.15.3. SWOT Analysis
- 17.2.15.4. Recent Developments
- 17.2.15.5. Financials (Based on Availability)
- 17.2.1 5 Halliburton Limited
List of Figures
- Figure 1: Global Frac Stack Industry Revenue Breakdown (Million, %) by Region 2024 & 2032
- Figure 2: Global Frac Stack Industry Volume Breakdown (K Unit, %) by Region 2024 & 2032
- Figure 3: North America Frac Stack Industry Revenue (Million), by Country 2024 & 2032
- Figure 4: North America Frac Stack Industry Volume (K Unit), by Country 2024 & 2032
- Figure 5: North America Frac Stack Industry Revenue Share (%), by Country 2024 & 2032
- Figure 6: North America Frac Stack Industry Volume Share (%), by Country 2024 & 2032
- Figure 7: Europe Frac Stack Industry Revenue (Million), by Country 2024 & 2032
- Figure 8: Europe Frac Stack Industry Volume (K Unit), by Country 2024 & 2032
- Figure 9: Europe Frac Stack Industry Revenue Share (%), by Country 2024 & 2032
- Figure 10: Europe Frac Stack Industry Volume Share (%), by Country 2024 & 2032
- Figure 11: Asia Pacific Frac Stack Industry Revenue (Million), by Country 2024 & 2032
- Figure 12: Asia Pacific Frac Stack Industry Volume (K Unit), by Country 2024 & 2032
- Figure 13: Asia Pacific Frac Stack Industry Revenue Share (%), by Country 2024 & 2032
- Figure 14: Asia Pacific Frac Stack Industry Volume Share (%), by Country 2024 & 2032
- Figure 15: South America Frac Stack Industry Revenue (Million), by Country 2024 & 2032
- Figure 16: South America Frac Stack Industry Volume (K Unit), by Country 2024 & 2032
- Figure 17: South America Frac Stack Industry Revenue Share (%), by Country 2024 & 2032
- Figure 18: South America Frac Stack Industry Volume Share (%), by Country 2024 & 2032
- Figure 19: North America Frac Stack Industry Revenue (Million), by Country 2024 & 2032
- Figure 20: North America Frac Stack Industry Volume (K Unit), by Country 2024 & 2032
- Figure 21: North America Frac Stack Industry Revenue Share (%), by Country 2024 & 2032
- Figure 22: North America Frac Stack Industry Volume Share (%), by Country 2024 & 2032
- Figure 23: MEA Frac Stack Industry Revenue (Million), by Country 2024 & 2032
- Figure 24: MEA Frac Stack Industry Volume (K Unit), by Country 2024 & 2032
- Figure 25: MEA Frac Stack Industry Revenue Share (%), by Country 2024 & 2032
- Figure 26: MEA Frac Stack Industry Volume Share (%), by Country 2024 & 2032
- Figure 27: North America Frac Stack Industry Revenue (Million), by Location of Deployment 2024 & 2032
- Figure 28: North America Frac Stack Industry Volume (K Unit), by Location of Deployment 2024 & 2032
- Figure 29: North America Frac Stack Industry Revenue Share (%), by Location of Deployment 2024 & 2032
- Figure 30: North America Frac Stack Industry Volume Share (%), by Location of Deployment 2024 & 2032
- Figure 31: North America Frac Stack Industry Revenue (Million), by Well Type 2024 & 2032
- Figure 32: North America Frac Stack Industry Volume (K Unit), by Well Type 2024 & 2032
- Figure 33: North America Frac Stack Industry Revenue Share (%), by Well Type 2024 & 2032
- Figure 34: North America Frac Stack Industry Volume Share (%), by Well Type 2024 & 2032
- Figure 35: North America Frac Stack Industry Revenue (Million), by Country 2024 & 2032
- Figure 36: North America Frac Stack Industry Volume (K Unit), by Country 2024 & 2032
- Figure 37: North America Frac Stack Industry Revenue Share (%), by Country 2024 & 2032
- Figure 38: North America Frac Stack Industry Volume Share (%), by Country 2024 & 2032
- Figure 39: Europe Frac Stack Industry Revenue (Million), by Location of Deployment 2024 & 2032
- Figure 40: Europe Frac Stack Industry Volume (K Unit), by Location of Deployment 2024 & 2032
- Figure 41: Europe Frac Stack Industry Revenue Share (%), by Location of Deployment 2024 & 2032
- Figure 42: Europe Frac Stack Industry Volume Share (%), by Location of Deployment 2024 & 2032
- Figure 43: Europe Frac Stack Industry Revenue (Million), by Well Type 2024 & 2032
- Figure 44: Europe Frac Stack Industry Volume (K Unit), by Well Type 2024 & 2032
- Figure 45: Europe Frac Stack Industry Revenue Share (%), by Well Type 2024 & 2032
- Figure 46: Europe Frac Stack Industry Volume Share (%), by Well Type 2024 & 2032
- Figure 47: Europe Frac Stack Industry Revenue (Million), by Country 2024 & 2032
- Figure 48: Europe Frac Stack Industry Volume (K Unit), by Country 2024 & 2032
- Figure 49: Europe Frac Stack Industry Revenue Share (%), by Country 2024 & 2032
- Figure 50: Europe Frac Stack Industry Volume Share (%), by Country 2024 & 2032
- Figure 51: Asia Pacific Frac Stack Industry Revenue (Million), by Location of Deployment 2024 & 2032
- Figure 52: Asia Pacific Frac Stack Industry Volume (K Unit), by Location of Deployment 2024 & 2032
- Figure 53: Asia Pacific Frac Stack Industry Revenue Share (%), by Location of Deployment 2024 & 2032
- Figure 54: Asia Pacific Frac Stack Industry Volume Share (%), by Location of Deployment 2024 & 2032
- Figure 55: Asia Pacific Frac Stack Industry Revenue (Million), by Well Type 2024 & 2032
- Figure 56: Asia Pacific Frac Stack Industry Volume (K Unit), by Well Type 2024 & 2032
- Figure 57: Asia Pacific Frac Stack Industry Revenue Share (%), by Well Type 2024 & 2032
- Figure 58: Asia Pacific Frac Stack Industry Volume Share (%), by Well Type 2024 & 2032
- Figure 59: Asia Pacific Frac Stack Industry Revenue (Million), by Country 2024 & 2032
- Figure 60: Asia Pacific Frac Stack Industry Volume (K Unit), by Country 2024 & 2032
- Figure 61: Asia Pacific Frac Stack Industry Revenue Share (%), by Country 2024 & 2032
- Figure 62: Asia Pacific Frac Stack Industry Volume Share (%), by Country 2024 & 2032
- Figure 63: South America Frac Stack Industry Revenue (Million), by Location of Deployment 2024 & 2032
- Figure 64: South America Frac Stack Industry Volume (K Unit), by Location of Deployment 2024 & 2032
- Figure 65: South America Frac Stack Industry Revenue Share (%), by Location of Deployment 2024 & 2032
- Figure 66: South America Frac Stack Industry Volume Share (%), by Location of Deployment 2024 & 2032
- Figure 67: South America Frac Stack Industry Revenue (Million), by Well Type 2024 & 2032
- Figure 68: South America Frac Stack Industry Volume (K Unit), by Well Type 2024 & 2032
- Figure 69: South America Frac Stack Industry Revenue Share (%), by Well Type 2024 & 2032
- Figure 70: South America Frac Stack Industry Volume Share (%), by Well Type 2024 & 2032
- Figure 71: South America Frac Stack Industry Revenue (Million), by Country 2024 & 2032
- Figure 72: South America Frac Stack Industry Volume (K Unit), by Country 2024 & 2032
- Figure 73: South America Frac Stack Industry Revenue Share (%), by Country 2024 & 2032
- Figure 74: South America Frac Stack Industry Volume Share (%), by Country 2024 & 2032
- Figure 75: Middle East and Africa Frac Stack Industry Revenue (Million), by Location of Deployment 2024 & 2032
- Figure 76: Middle East and Africa Frac Stack Industry Volume (K Unit), by Location of Deployment 2024 & 2032
- Figure 77: Middle East and Africa Frac Stack Industry Revenue Share (%), by Location of Deployment 2024 & 2032
- Figure 78: Middle East and Africa Frac Stack Industry Volume Share (%), by Location of Deployment 2024 & 2032
- Figure 79: Middle East and Africa Frac Stack Industry Revenue (Million), by Well Type 2024 & 2032
- Figure 80: Middle East and Africa Frac Stack Industry Volume (K Unit), by Well Type 2024 & 2032
- Figure 81: Middle East and Africa Frac Stack Industry Revenue Share (%), by Well Type 2024 & 2032
- Figure 82: Middle East and Africa Frac Stack Industry Volume Share (%), by Well Type 2024 & 2032
- Figure 83: Middle East and Africa Frac Stack Industry Revenue (Million), by Country 2024 & 2032
- Figure 84: Middle East and Africa Frac Stack Industry Volume (K Unit), by Country 2024 & 2032
- Figure 85: Middle East and Africa Frac Stack Industry Revenue Share (%), by Country 2024 & 2032
- Figure 86: Middle East and Africa Frac Stack Industry Volume Share (%), by Country 2024 & 2032
List of Tables
- Table 1: Global Frac Stack Industry Revenue Million Forecast, by Region 2019 & 2032
- Table 2: Global Frac Stack Industry Volume K Unit Forecast, by Region 2019 & 2032
- Table 3: Global Frac Stack Industry Revenue Million Forecast, by Location of Deployment 2019 & 2032
- Table 4: Global Frac Stack Industry Volume K Unit Forecast, by Location of Deployment 2019 & 2032
- Table 5: Global Frac Stack Industry Revenue Million Forecast, by Well Type 2019 & 2032
- Table 6: Global Frac Stack Industry Volume K Unit Forecast, by Well Type 2019 & 2032
- Table 7: Global Frac Stack Industry Revenue Million Forecast, by Region 2019 & 2032
- Table 8: Global Frac Stack Industry Volume K Unit Forecast, by Region 2019 & 2032
- Table 9: Global Frac Stack Industry Revenue Million Forecast, by Country 2019 & 2032
- Table 10: Global Frac Stack Industry Volume K Unit Forecast, by Country 2019 & 2032
- Table 11: United States Frac Stack Industry Revenue (Million) Forecast, by Application 2019 & 2032
- Table 12: United States Frac Stack Industry Volume (K Unit) Forecast, by Application 2019 & 2032
- Table 13: Canada Frac Stack Industry Revenue (Million) Forecast, by Application 2019 & 2032
- Table 14: Canada Frac Stack Industry Volume (K Unit) Forecast, by Application 2019 & 2032
- Table 15: Mexico Frac Stack Industry Revenue (Million) Forecast, by Application 2019 & 2032
- Table 16: Mexico Frac Stack Industry Volume (K Unit) Forecast, by Application 2019 & 2032
- Table 17: Global Frac Stack Industry Revenue Million Forecast, by Country 2019 & 2032
- Table 18: Global Frac Stack Industry Volume K Unit Forecast, by Country 2019 & 2032
- Table 19: Germany Frac Stack Industry Revenue (Million) Forecast, by Application 2019 & 2032
- Table 20: Germany Frac Stack Industry Volume (K Unit) Forecast, by Application 2019 & 2032
- Table 21: United Kingdom Frac Stack Industry Revenue (Million) Forecast, by Application 2019 & 2032
- Table 22: United Kingdom Frac Stack Industry Volume (K Unit) Forecast, by Application 2019 & 2032
- Table 23: France Frac Stack Industry Revenue (Million) Forecast, by Application 2019 & 2032
- Table 24: France Frac Stack Industry Volume (K Unit) Forecast, by Application 2019 & 2032
- Table 25: Spain Frac Stack Industry Revenue (Million) Forecast, by Application 2019 & 2032
- Table 26: Spain Frac Stack Industry Volume (K Unit) Forecast, by Application 2019 & 2032
- Table 27: Italy Frac Stack Industry Revenue (Million) Forecast, by Application 2019 & 2032
- Table 28: Italy Frac Stack Industry Volume (K Unit) Forecast, by Application 2019 & 2032
- Table 29: Spain Frac Stack Industry Revenue (Million) Forecast, by Application 2019 & 2032
- Table 30: Spain Frac Stack Industry Volume (K Unit) Forecast, by Application 2019 & 2032
- Table 31: Belgium Frac Stack Industry Revenue (Million) Forecast, by Application 2019 & 2032
- Table 32: Belgium Frac Stack Industry Volume (K Unit) Forecast, by Application 2019 & 2032
- Table 33: Netherland Frac Stack Industry Revenue (Million) Forecast, by Application 2019 & 2032
- Table 34: Netherland Frac Stack Industry Volume (K Unit) Forecast, by Application 2019 & 2032
- Table 35: Nordics Frac Stack Industry Revenue (Million) Forecast, by Application 2019 & 2032
- Table 36: Nordics Frac Stack Industry Volume (K Unit) Forecast, by Application 2019 & 2032
- Table 37: Rest of Europe Frac Stack Industry Revenue (Million) Forecast, by Application 2019 & 2032
- Table 38: Rest of Europe Frac Stack Industry Volume (K Unit) Forecast, by Application 2019 & 2032
- Table 39: Global Frac Stack Industry Revenue Million Forecast, by Country 2019 & 2032
- Table 40: Global Frac Stack Industry Volume K Unit Forecast, by Country 2019 & 2032
- Table 41: China Frac Stack Industry Revenue (Million) Forecast, by Application 2019 & 2032
- Table 42: China Frac Stack Industry Volume (K Unit) Forecast, by Application 2019 & 2032
- Table 43: Japan Frac Stack Industry Revenue (Million) Forecast, by Application 2019 & 2032
- Table 44: Japan Frac Stack Industry Volume (K Unit) Forecast, by Application 2019 & 2032
- Table 45: India Frac Stack Industry Revenue (Million) Forecast, by Application 2019 & 2032
- Table 46: India Frac Stack Industry Volume (K Unit) Forecast, by Application 2019 & 2032
- Table 47: South Korea Frac Stack Industry Revenue (Million) Forecast, by Application 2019 & 2032
- Table 48: South Korea Frac Stack Industry Volume (K Unit) Forecast, by Application 2019 & 2032
- Table 49: Southeast Asia Frac Stack Industry Revenue (Million) Forecast, by Application 2019 & 2032
- Table 50: Southeast Asia Frac Stack Industry Volume (K Unit) Forecast, by Application 2019 & 2032
- Table 51: Australia Frac Stack Industry Revenue (Million) Forecast, by Application 2019 & 2032
- Table 52: Australia Frac Stack Industry Volume (K Unit) Forecast, by Application 2019 & 2032
- Table 53: Indonesia Frac Stack Industry Revenue (Million) Forecast, by Application 2019 & 2032
- Table 54: Indonesia Frac Stack Industry Volume (K Unit) Forecast, by Application 2019 & 2032
- Table 55: Phillipes Frac Stack Industry Revenue (Million) Forecast, by Application 2019 & 2032
- Table 56: Phillipes Frac Stack Industry Volume (K Unit) Forecast, by Application 2019 & 2032
- Table 57: Singapore Frac Stack Industry Revenue (Million) Forecast, by Application 2019 & 2032
- Table 58: Singapore Frac Stack Industry Volume (K Unit) Forecast, by Application 2019 & 2032
- Table 59: Thailandc Frac Stack Industry Revenue (Million) Forecast, by Application 2019 & 2032
- Table 60: Thailandc Frac Stack Industry Volume (K Unit) Forecast, by Application 2019 & 2032
- Table 61: Rest of Asia Pacific Frac Stack Industry Revenue (Million) Forecast, by Application 2019 & 2032
- Table 62: Rest of Asia Pacific Frac Stack Industry Volume (K Unit) Forecast, by Application 2019 & 2032
- Table 63: Global Frac Stack Industry Revenue Million Forecast, by Country 2019 & 2032
- Table 64: Global Frac Stack Industry Volume K Unit Forecast, by Country 2019 & 2032
- Table 65: Brazil Frac Stack Industry Revenue (Million) Forecast, by Application 2019 & 2032
- Table 66: Brazil Frac Stack Industry Volume (K Unit) Forecast, by Application 2019 & 2032
- Table 67: Argentina Frac Stack Industry Revenue (Million) Forecast, by Application 2019 & 2032
- Table 68: Argentina Frac Stack Industry Volume (K Unit) Forecast, by Application 2019 & 2032
- Table 69: Peru Frac Stack Industry Revenue (Million) Forecast, by Application 2019 & 2032
- Table 70: Peru Frac Stack Industry Volume (K Unit) Forecast, by Application 2019 & 2032
- Table 71: Chile Frac Stack Industry Revenue (Million) Forecast, by Application 2019 & 2032
- Table 72: Chile Frac Stack Industry Volume (K Unit) Forecast, by Application 2019 & 2032
- Table 73: Colombia Frac Stack Industry Revenue (Million) Forecast, by Application 2019 & 2032
- Table 74: Colombia Frac Stack Industry Volume (K Unit) Forecast, by Application 2019 & 2032
- Table 75: Ecuador Frac Stack Industry Revenue (Million) Forecast, by Application 2019 & 2032
- Table 76: Ecuador Frac Stack Industry Volume (K Unit) Forecast, by Application 2019 & 2032
- Table 77: Venezuela Frac Stack Industry Revenue (Million) Forecast, by Application 2019 & 2032
- Table 78: Venezuela Frac Stack Industry Volume (K Unit) Forecast, by Application 2019 & 2032
- Table 79: Rest of South America Frac Stack Industry Revenue (Million) Forecast, by Application 2019 & 2032
- Table 80: Rest of South America Frac Stack Industry Volume (K Unit) Forecast, by Application 2019 & 2032
- Table 81: Global Frac Stack Industry Revenue Million Forecast, by Country 2019 & 2032
- Table 82: Global Frac Stack Industry Volume K Unit Forecast, by Country 2019 & 2032
- Table 83: United States Frac Stack Industry Revenue (Million) Forecast, by Application 2019 & 2032
- Table 84: United States Frac Stack Industry Volume (K Unit) Forecast, by Application 2019 & 2032
- Table 85: Canada Frac Stack Industry Revenue (Million) Forecast, by Application 2019 & 2032
- Table 86: Canada Frac Stack Industry Volume (K Unit) Forecast, by Application 2019 & 2032
- Table 87: Mexico Frac Stack Industry Revenue (Million) Forecast, by Application 2019 & 2032
- Table 88: Mexico Frac Stack Industry Volume (K Unit) Forecast, by Application 2019 & 2032
- Table 89: Global Frac Stack Industry Revenue Million Forecast, by Country 2019 & 2032
- Table 90: Global Frac Stack Industry Volume K Unit Forecast, by Country 2019 & 2032
- Table 91: United Arab Emirates Frac Stack Industry Revenue (Million) Forecast, by Application 2019 & 2032
- Table 92: United Arab Emirates Frac Stack Industry Volume (K Unit) Forecast, by Application 2019 & 2032
- Table 93: Saudi Arabia Frac Stack Industry Revenue (Million) Forecast, by Application 2019 & 2032
- Table 94: Saudi Arabia Frac Stack Industry Volume (K Unit) Forecast, by Application 2019 & 2032
- Table 95: South Africa Frac Stack Industry Revenue (Million) Forecast, by Application 2019 & 2032
- Table 96: South Africa Frac Stack Industry Volume (K Unit) Forecast, by Application 2019 & 2032
- Table 97: Rest of Middle East and Africa Frac Stack Industry Revenue (Million) Forecast, by Application 2019 & 2032
- Table 98: Rest of Middle East and Africa Frac Stack Industry Volume (K Unit) Forecast, by Application 2019 & 2032
- Table 99: Global Frac Stack Industry Revenue Million Forecast, by Location of Deployment 2019 & 2032
- Table 100: Global Frac Stack Industry Volume K Unit Forecast, by Location of Deployment 2019 & 2032
- Table 101: Global Frac Stack Industry Revenue Million Forecast, by Well Type 2019 & 2032
- Table 102: Global Frac Stack Industry Volume K Unit Forecast, by Well Type 2019 & 2032
- Table 103: Global Frac Stack Industry Revenue Million Forecast, by Country 2019 & 2032
- Table 104: Global Frac Stack Industry Volume K Unit Forecast, by Country 2019 & 2032
- Table 105: Global Frac Stack Industry Revenue Million Forecast, by Location of Deployment 2019 & 2032
- Table 106: Global Frac Stack Industry Volume K Unit Forecast, by Location of Deployment 2019 & 2032
- Table 107: Global Frac Stack Industry Revenue Million Forecast, by Well Type 2019 & 2032
- Table 108: Global Frac Stack Industry Volume K Unit Forecast, by Well Type 2019 & 2032
- Table 109: Global Frac Stack Industry Revenue Million Forecast, by Country 2019 & 2032
- Table 110: Global Frac Stack Industry Volume K Unit Forecast, by Country 2019 & 2032
- Table 111: Global Frac Stack Industry Revenue Million Forecast, by Location of Deployment 2019 & 2032
- Table 112: Global Frac Stack Industry Volume K Unit Forecast, by Location of Deployment 2019 & 2032
- Table 113: Global Frac Stack Industry Revenue Million Forecast, by Well Type 2019 & 2032
- Table 114: Global Frac Stack Industry Volume K Unit Forecast, by Well Type 2019 & 2032
- Table 115: Global Frac Stack Industry Revenue Million Forecast, by Country 2019 & 2032
- Table 116: Global Frac Stack Industry Volume K Unit Forecast, by Country 2019 & 2032
- Table 117: Global Frac Stack Industry Revenue Million Forecast, by Location of Deployment 2019 & 2032
- Table 118: Global Frac Stack Industry Volume K Unit Forecast, by Location of Deployment 2019 & 2032
- Table 119: Global Frac Stack Industry Revenue Million Forecast, by Well Type 2019 & 2032
- Table 120: Global Frac Stack Industry Volume K Unit Forecast, by Well Type 2019 & 2032
- Table 121: Global Frac Stack Industry Revenue Million Forecast, by Country 2019 & 2032
- Table 122: Global Frac Stack Industry Volume K Unit Forecast, by Country 2019 & 2032
- Table 123: Global Frac Stack Industry Revenue Million Forecast, by Location of Deployment 2019 & 2032
- Table 124: Global Frac Stack Industry Volume K Unit Forecast, by Location of Deployment 2019 & 2032
- Table 125: Global Frac Stack Industry Revenue Million Forecast, by Well Type 2019 & 2032
- Table 126: Global Frac Stack Industry Volume K Unit Forecast, by Well Type 2019 & 2032
- Table 127: Global Frac Stack Industry Revenue Million Forecast, by Country 2019 & 2032
- Table 128: Global Frac Stack Industry Volume K Unit Forecast, by Country 2019 & 2032
Frequently Asked Questions
1. What is the projected Compound Annual Growth Rate (CAGR) of the Frac Stack Industry?
The projected CAGR is approximately > 5.00%.
2. Which companies are prominent players in the Frac Stack Industry?
Key companies in the market include 5 Halliburton Limited, 1 Baker Hughes a GE Company, 3 C&J Energy Services, 7 Trican Well Service Ltd*List Not Exhaustive, 2 Calfrac Well Services Ltd, 5 The Weir Group PLC, 6 Yantai Jereh Petroleum Equipment & Technologies Co, 4 Covenant Testing Technologies LLC, Fracturing Service Providers, 6 Schlumberger Limited, 1 CCSC Petroleum Equipment Ltd Co, 3 Schlumberger Limited, 4 FTS International Inc, 2 Oil States Energy Services, Equipment Manufacturers.
3. What are the main segments of the Frac Stack Industry?
The market segments include Location of Deployment, Well Type.
4. Can you provide details about the market size?
The market size is estimated to be USD XX Million as of 2022.
5. What are some drivers contributing to market growth?
4.; Increasing Demand for Wood Pellets in Clean Energy Generation4.; Growing Wood Pellet Manufacturing Infrastructure.
6. What are the notable trends driving market growth?
The Onshore Sector is Expected to Dominate the Market.
7. Are there any restraints impacting market growth?
4.; The Adoption and Increasing Deployment of Alternative Renewable Energy.
8. Can you provide examples of recent developments in the market?
In November 2021, Regiment LLC, a Texas-based oilfield service provider that operates in Permian Basin and the Eagleford shale, announced that it had completed two recent transactions to consolidate its position in the regional fracking market. In September 2021, it acquired a fleet of pumps and high specification frac stack equipment from a private pressure pumper. In November 2021, it acquired additional pressure pumping equipment with a Permian operator, following which the company increased its total asset base to more than 75,000 hydraulic HP.
9. What pricing options are available for accessing the report?
Pricing options include single-user, multi-user, and enterprise licenses priced at USD 4750, USD 5250, and USD 8750 respectively.
10. Is the market size provided in terms of value or volume?
The market size is provided in terms of value, measured in Million and volume, measured in K Unit.
11. Are there any specific market keywords associated with the report?
Yes, the market keyword associated with the report is "Frac Stack Industry," which aids in identifying and referencing the specific market segment covered.
12. How do I determine which pricing option suits my needs best?
The pricing options vary based on user requirements and access needs. Individual users may opt for single-user licenses, while businesses requiring broader access may choose multi-user or enterprise licenses for cost-effective access to the report.
13. Are there any additional resources or data provided in the Frac Stack Industry report?
While the report offers comprehensive insights, it's advisable to review the specific contents or supplementary materials provided to ascertain if additional resources or data are available.
14. How can I stay updated on further developments or reports in the Frac Stack Industry?
To stay informed about further developments, trends, and reports in the Frac Stack Industry, consider subscribing to industry newsletters, following relevant companies and organizations, or regularly checking reputable industry news sources and publications.
Methodology
Step 1 - Identification of Relevant Samples Size from Population Database


Step 2 - Approaches for Defining Global Market Size (Value, Volume* & Price*)

Note*: In applicable scenarios
Step 3 - Data Sources
Primary Research
- Web Analytics
- Survey Reports
- Research Institute
- Latest Research Reports
- Opinion Leaders
Secondary Research
- Annual Reports
- White Paper
- Latest Press Release
- Industry Association
- Paid Database
- Investor Presentations

Step 4 - Data Triangulation
Involves using different sources of information in order to increase the validity of a study
These sources are likely to be stakeholders in a program - participants, other researchers, program staff, other community members, and so on.
Then we put all data in single framework & apply various statistical tools to find out the dynamic on the market.
During the analysis stage, feedback from the stakeholder groups would be compared to determine areas of agreement as well as areas of divergence


