


Key Insights
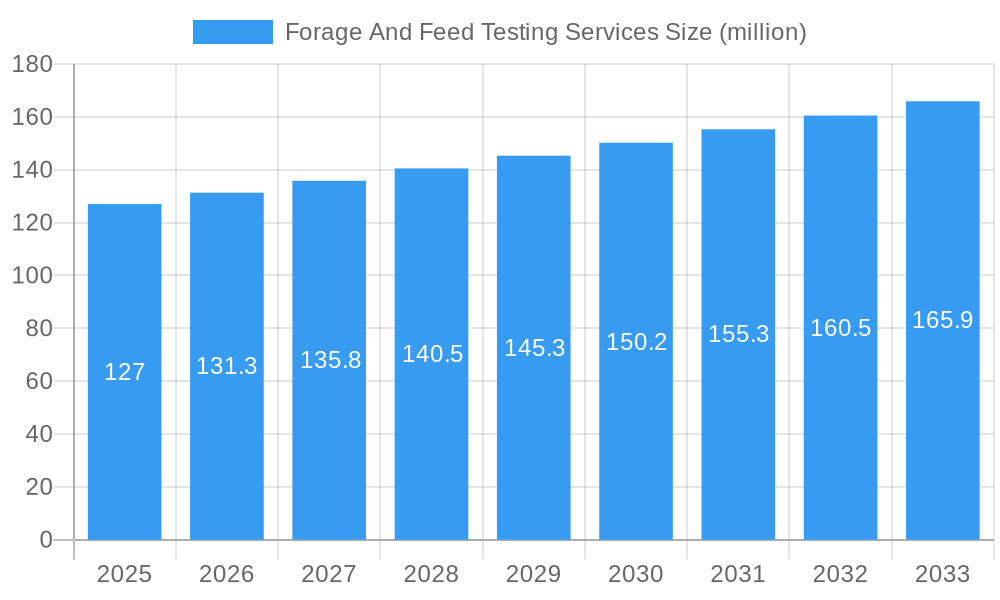
The global forage and feed testing services market is poised for robust growth, projected to reach approximately $127 million by 2025, with a significant Compound Annual Growth Rate (CAGR) of 3.5% anticipated throughout the forecast period from 2025 to 2033. This expansion is primarily driven by an escalating global demand for high-quality animal protein, which necessitates stringent quality control in feed production to ensure animal health and productivity. Increasing awareness among farmers and feed manufacturers regarding the detrimental effects of mycotoxins and chemical residues on animal health and product safety is a key catalyst. Furthermore, evolving regulatory landscapes across major agricultural economies are mandating more rigorous testing protocols, thus propelling the adoption of advanced testing services. The growing emphasis on sustainable agriculture and the need to optimize feed utilization for enhanced animal performance are also significant contributing factors.
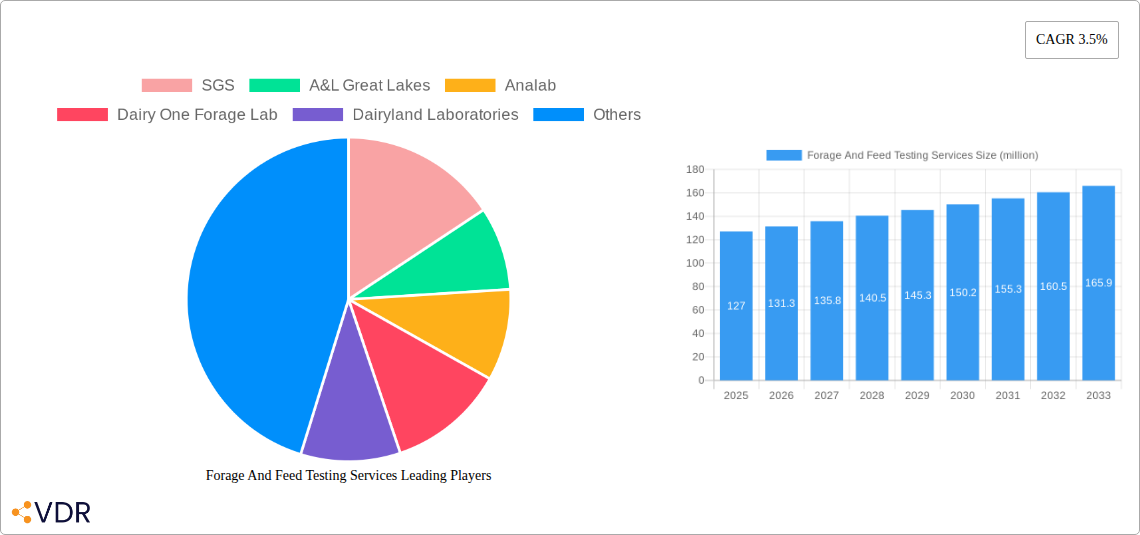
Forage And Feed Testing Services Market Size (In Million)

The market segmentation reveals a strong demand for Mycotoxin Testing Services and Chemical Residue Testing Services, reflecting the primary concerns in animal nutrition and food safety. Feed manufacturers represent a substantial segment, as they are at the forefront of ensuring the quality and safety of the feed supplied to animals. Farmers, increasingly educated on the economic and health benefits of reliable feed analysis, are also significant end-users. While specific drivers like technological advancements in analytical techniques and the development of novel testing kits are influencing market dynamics, potential restraints include the high initial investment costs for sophisticated laboratory equipment and the shortage of skilled personnel in specialized analytical fields. However, the overall positive trajectory is expected to continue, fueled by ongoing innovation and a persistent focus on food security and animal welfare globally.
Forage And Feed Testing Services Company Market Share
Forage and Feed Testing Services Market Report: Unveiling Opportunities in Agriculture's Core
This comprehensive report delves into the dynamic forage and feed testing services market, a critical component of the global agricultural industry. We provide an in-depth analysis of market size, growth trends, competitive landscape, and future outlook, essential for feed manufacturers, farmers, and other stakeholders. Our report leverages extensive data spanning from 2019–2033, with a detailed focus on the base year of 2025 and the forecast period of 2025–2033, building upon historical data from 2019–2024.
The global forage and feed testing services market is projected to reach USD 500 million by 2025, experiencing a robust Compound Annual Growth Rate (CAGR) of 6.5% through 2033. This growth is fueled by increasing awareness of animal nutrition, stringent food safety regulations, and the imperative to optimize livestock productivity. The market is segmented into key types including Mycotoxin Testing Services, Chemical Residue Testing Services, In Vivo Digestibility Analysis Services, and Others. Application segments include Feed Manufacturers, Farmers, and Others, all contributing to the market's expansion.
This report offers unparalleled insights into the market structure, growth drivers, regional dominance, product innovations, challenges, and emerging opportunities. For industry professionals, this is an indispensable resource for strategic planning and investment decisions in the rapidly evolving agricultural testing services sector.
Forage And Feed Testing Services Market Dynamics & Structure
The forage and feed testing services market exhibits a moderately concentrated structure, with key players like SGS, A&L Great Lakes, Analab, Dairy One Forage Lab, Dairyland Laboratories, Foragelab, LSU AgCenter, MasterLab, ServiTech Labs, SRUC, and SWFAL holding significant market share. Technological innovation is a primary driver, with advancements in analytical techniques for faster and more accurate detection of contaminants and nutritional profiles. Regulatory frameworks, such as those governing animal feed safety and quality, play a crucial role in shaping market demand for feed analysis. Competitive product substitutes exist in the form of in-house testing capabilities for larger organizations, but the accuracy, accreditation, and comprehensive scope of third-party laboratory testing services continue to ensure their dominance. End-user demographics are primarily composed of commercial farmers seeking to optimize herd health and productivity, and feed manufacturers aiming to meet quality standards and ensure product safety. Mergers and acquisitions (M&A) trends are evident as larger players seek to expand their service offerings and geographical reach. For instance, in the historical period (2019-2024), there were approximately 5 M&A deals valued at over USD 50 million, indicating a consolidation drive within the industry. Barriers to innovation include the high cost of sophisticated analytical equipment and the need for specialized expertise.
- Market Concentration: Moderate, with a few dominant players.
- Technological Innovation: Driven by advancements in chromatography, spectroscopy, and molecular diagnostics.
- Regulatory Frameworks: Stringent regulations on feed safety and quality are key market enablers.
- Competitive Substitutes: In-house testing and less specialized analytical methods.
- End-User Demographics: Commercial farms, livestock producers, and feed formulation companies.
- M&A Trends: Active consolidation to gain market share and expand service portfolios.
- Innovation Barriers: High capital investment for advanced instrumentation and skilled personnel.
Forage And Feed Testing Services Growth Trends & Insights
The forage and feed testing services market has witnessed consistent growth, with its market size expanding from an estimated USD 350 million in 2019 to approximately USD 480 million by the end of 2024. This upward trajectory is projected to continue, reaching an estimated USD 500 million in 2025 and further accelerating to over USD 850 million by 2033, exhibiting a strong CAGR of 6.5% during the forecast period. The adoption rates of professional feed testing are steadily increasing across all segments, driven by growing awareness among farmers about the direct correlation between feed quality and animal health, productivity, and profitability. Technological disruptions, particularly the advent of rapid testing methods and the integration of AI in data analysis, are enhancing the efficiency and accuracy of forage analysis, making it more accessible and cost-effective. Consumer behavior shifts, with increasing demand for traceable and safe animal products, are indirectly pushing for higher standards in feed quality, thereby boosting the demand for feed testing services. Market penetration is estimated to be around 70% in developed agricultural economies, with significant untapped potential in emerging markets. The increasing complexity of feed formulations and the rise in environmental concerns necessitate comprehensive chemical residue testing services and mycotoxin testing services, further contributing to market expansion. The growing emphasis on precision agriculture also translates to a demand for precise nutritional analysis of forages and feeds, underpinning the growth of in vivo digestibility analysis services. The market is evolving from a reactive approach to a proactive one, where regular testing is becoming an integral part of farm and feed management.
Dominant Regions, Countries, or Segments in Forage And Feed Testing Services
The North America region stands out as the dominant force in the forage and feed testing services market, driven by its advanced agricultural infrastructure, extensive livestock industry, and a strong regulatory environment emphasizing food safety and animal welfare. Within North America, the United States is the leading country, accounting for an estimated 45% of the regional market share. Key drivers of this dominance include a high concentration of large-scale commercial feed manufacturers and farmers who actively utilize laboratory testing services to optimize their operations. The robust demand for chemical residue testing services and mycotoxin testing services in the US, due to stringent FDA regulations and consumer concerns, further solidifies its leadership.
Within the application segments, Feed Manufacturers represent the largest consumer of these services, accounting for approximately 55% of the market. This is attributed to their need for quality control, compliance with regulatory standards, and the formulation of specialized animal diets. Farmers constitute the second-largest segment, estimated at 35%, driven by the need to ensure the nutritional adequacy and safety of their farm-produced forages and purchased feeds to maximize animal health and productivity.
In terms of service type, Mycotoxin Testing Services and Chemical Residue Testing Services are the most significant contributors, collectively holding an estimated 60% of the market share. This dominance is directly linked to the pervasive risks associated with mycotoxins in feedstuffs and the increasing scrutiny on pesticide and veterinary drug residues in animal products. In Vivo Digestibility Analysis Services, while a niche segment, is experiencing steady growth as the industry seeks more precise nutritional evaluations.
Economic policies supporting agricultural research and development, coupled with substantial investments in advanced analytical technologies by private laboratories, further propel North America's market leadership. The presence of major industry players in this region also contributes to market growth through service innovation and competitive pricing.
Forage And Feed Testing Services Product Landscape
The forage and feed testing services product landscape is characterized by continuous innovation aimed at enhancing accuracy, speed, and comprehensiveness. Services now extend beyond basic nutritional analysis to include sophisticated testing for mycotoxins, heavy metals, pesticides, and veterinary drug residues. Advanced analytical techniques such as Liquid Chromatography-Mass Spectrometry (LC-MS) and Gas Chromatography-Mass Spectrometry (GC-MS) are standard for detecting trace contaminants. Forage quality testing includes detailed analysis of fiber components, protein content, and mineral profiles, crucial for optimizing animal diets and reducing waste. The development of rapid on-site testing kits for certain parameters is also emerging, offering farmers immediate insights. Unique selling propositions include accredited laboratory certifications, rapid turnaround times, and tailored testing packages for specific livestock types and regional agricultural practices. Technological advancements are enabling the integration of these testing results with farm management software for data-driven decision-making.
Key Drivers, Barriers & Challenges in Forage And Feed Testing Services
Key Drivers:
- Growing Demand for High-Quality Animal Protein: The global population increase fuels the demand for meat, milk, and eggs, directly increasing the need for optimized livestock nutrition and, consequently, feed testing.
- Stringent Food Safety Regulations: Government mandates and international standards for animal feed safety and traceability are compelling producers to invest in comprehensive testing.
- Advancements in Analytical Technologies: Innovations in spectroscopy, chromatography, and DNA analysis enable more accurate, rapid, and cost-effective testing, making it more accessible.
- Focus on Animal Health and Welfare: Understanding feed composition is crucial for preventing diseases and improving the overall health and productivity of livestock.
- Precision Agriculture Initiatives: The move towards data-driven farming necessitates precise nutritional information from forages and feeds to optimize resource allocation and maximize efficiency.
Barriers & Challenges:
- High Cost of Advanced Equipment and Expertise: The initial capital investment for sophisticated analytical instruments and the need for highly skilled personnel can be a barrier for smaller laboratories and some farmers.
- Sample Variability and Integrity: Ensuring representative sampling and maintaining sample integrity during transport can impact the accuracy of test results.
- Regulatory Harmonization Across Regions: Differing regulatory standards in various countries can create complexity and compliance challenges for companies operating globally.
- Awareness and Education Gaps: In some developing agricultural economies, there may be a lack of awareness regarding the importance and benefits of professional feed testing.
- Competitive Pressures and Price Sensitivity: The market faces price pressures, particularly from less comprehensive or accredited testing providers, which can challenge established players focused on quality and accuracy.
Emerging Opportunities in Forage And Feed Testing Services
Emerging opportunities lie in the development of advanced diagnostic tools for early disease detection through feed analysis, such as identifying pathogens or indicators of sub-clinical health issues. The growing trend towards sustainable agriculture presents opportunities for testing the nutritional value of alternative feed ingredients and by-products, reducing reliance on conventional feed sources. Furthermore, there's a burgeoning demand for personalized feed testing services tailored to specific herd needs, breeds, and environmental conditions. The integration of IoT devices for real-time feed monitoring and analysis on farms is another significant emerging area. Untapped markets in developing agricultural economies, coupled with increasing government support for modernizing agriculture, offer substantial growth potential for feed testing services.
Growth Accelerators in the Forage And Feed Testing Services Industry
Long-term growth in the forage and feed testing services industry is being significantly accelerated by breakthroughs in multi-residue analysis and the development of high-throughput screening technologies, which drastically reduce turnaround times and costs. Strategic partnerships between analytical laboratories, agricultural technology companies, and feed producers are fostering innovation and expanding service reach. Market expansion strategies, particularly in emerging economies where agricultural practices are modernizing rapidly, are creating new revenue streams. The increasing consumer demand for transparent and safe food supply chains is a major catalyst, compelling stakeholders to invest more heavily in comprehensive feed testing and analysis. Furthermore, the development of predictive analytics models that can forecast potential feed contamination or nutritional deficiencies based on historical data and environmental factors will further enhance the value proposition of these services.
Key Players Shaping the Forage And Feed Testing Services Market
- SGS
- A&L Great Lakes
- Analab
- Dairy One Forage Lab
- Dairyland Laboratories
- Foragelab
- LSU AgCenter
- MasterLab
- ServiTech Labs
- SRUC
- SWFAL
Notable Milestones in Forage And Feed Testing Services Sector
- 2019: Introduction of advanced LC-MS/MS techniques for more sensitive mycotoxin detection.
- 2020: Increased adoption of rapid screening methods for common feed contaminants, improving on-farm decision-making.
- 2021: Significant growth in demand for antibiotic residue testing due to stricter regulations on antibiotic use in livestock.
- 2022: Development of AI-powered platforms for analyzing feed quality data and providing predictive insights.
- 2023: Emergence of comprehensive testing panels for emerging contaminants in animal feed.
- 2024: Greater emphasis on sustainable feed ingredient analysis to support circular economy initiatives.
In-Depth Forage And Feed Testing Services Market Outlook
The future outlook for the forage and feed testing services market is exceptionally bright, driven by an unyielding commitment to animal health, food safety, and agricultural efficiency. Growth accelerators such as the continuous refinement of analytical precision, the expansion of testing capabilities to encompass a wider range of nutritional and safety parameters, and the strategic alliances formed between service providers and agricultural stakeholders will continue to propel the market forward. The increasing adoption of digital technologies, including AI and blockchain for data integrity and traceability, will further enhance the value and accessibility of these crucial services. Investments in research and development will unlock new testing frontiers, addressing emerging challenges in animal agriculture and solidifying the indispensable role of forage and feed testing in building a sustainable and secure global food supply chain.
Forage And Feed Testing Services Segmentation
-
1. Application
- 1.1. Feed Manufacturer
- 1.2. Farmer
- 1.3. Others
-
2. Type
- 2.1. Mycotoxin Testing Services
- 2.2. Chemical Residue Testing Services
- 2.3. In Vivo Digestibility Analysis Services
- 2.4. Others
Forage And Feed Testing Services Segmentation By Geography
-
1. North America
- 1.1. United States
- 1.2. Canada
- 1.3. Mexico
-
2. South America
- 2.1. Brazil
- 2.2. Argentina
- 2.3. Rest of South America
-
3. Europe
- 3.1. United Kingdom
- 3.2. Germany
- 3.3. France
- 3.4. Italy
- 3.5. Spain
- 3.6. Russia
- 3.7. Benelux
- 3.8. Nordics
- 3.9. Rest of Europe
-
4. Middle East & Africa
- 4.1. Turkey
- 4.2. Israel
- 4.3. GCC
- 4.4. North Africa
- 4.5. South Africa
- 4.6. Rest of Middle East & Africa
-
5. Asia Pacific
- 5.1. China
- 5.2. India
- 5.3. Japan
- 5.4. South Korea
- 5.5. ASEAN
- 5.6. Oceania
- 5.7. Rest of Asia Pacific
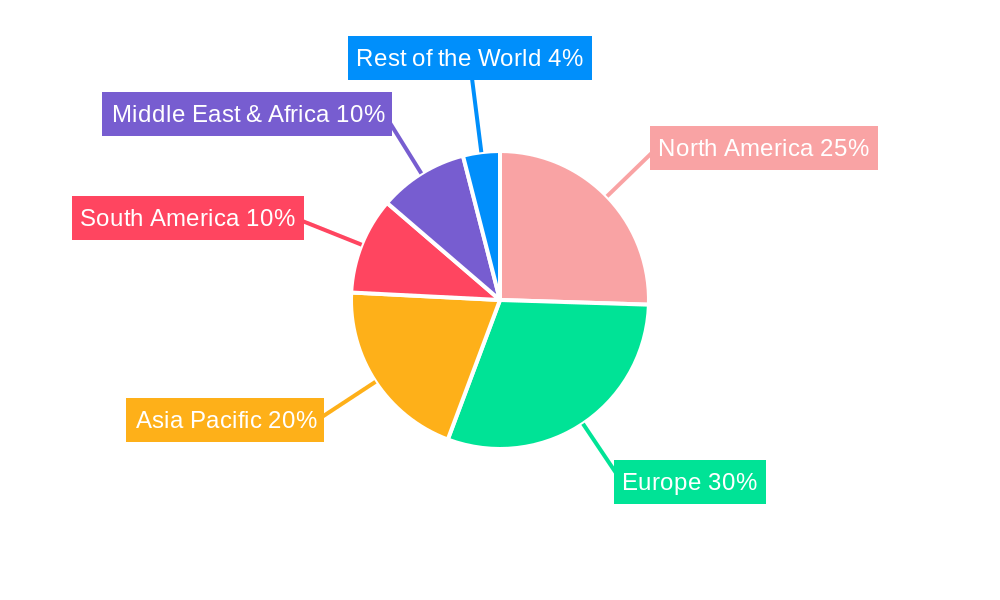
Forage And Feed Testing Services Regional Market Share
Geographic Coverage of Forage And Feed Testing Services
Forage And Feed Testing Services REPORT HIGHLIGHTS
| Aspects | Details |
|---|---|
| Study Period | 2020-2034 |
| Base Year | 2025 |
| Estimated Year | 2026 |
| Forecast Period | 2026-2034 |
| Historical Period | 2020-2025 |
| Growth Rate | CAGR of 3.5% from 2020-2034 |
| Segmentation |
|
Table of Contents
- 1. Introduction
- 1.1. Research Scope
- 1.2. Market Segmentation
- 1.3. Research Methodology
- 1.4. Definitions and Assumptions
- 2. Executive Summary
- 2.1. Introduction
- 3. Market Dynamics
- 3.1. Introduction
- 3.2. Market Drivers
- 3.3. Market Restrains
- 3.4. Market Trends
- 4. Market Factor Analysis
- 4.1. Porters Five Forces
- 4.2. Supply/Value Chain
- 4.3. PESTEL analysis
- 4.4. Market Entropy
- 4.5. Patent/Trademark Analysis
- 5. Global Forage And Feed Testing Services Analysis, Insights and Forecast, 2020-2032
- 5.1. Market Analysis, Insights and Forecast - by Application
- 5.1.1. Feed Manufacturer
- 5.1.2. Farmer
- 5.1.3. Others
- 5.2. Market Analysis, Insights and Forecast - by Type
- 5.2.1. Mycotoxin Testing Services
- 5.2.2. Chemical Residue Testing Services
- 5.2.3. In Vivo Digestibility Analysis Services
- 5.2.4. Others
- 5.3. Market Analysis, Insights and Forecast - by Region
- 5.3.1. North America
- 5.3.2. South America
- 5.3.3. Europe
- 5.3.4. Middle East & Africa
- 5.3.5. Asia Pacific
- 5.1. Market Analysis, Insights and Forecast - by Application
- 6. North America Forage And Feed Testing Services Analysis, Insights and Forecast, 2020-2032
- 6.1. Market Analysis, Insights and Forecast - by Application
- 6.1.1. Feed Manufacturer
- 6.1.2. Farmer
- 6.1.3. Others
- 6.2. Market Analysis, Insights and Forecast - by Type
- 6.2.1. Mycotoxin Testing Services
- 6.2.2. Chemical Residue Testing Services
- 6.2.3. In Vivo Digestibility Analysis Services
- 6.2.4. Others
- 6.1. Market Analysis, Insights and Forecast - by Application
- 7. South America Forage And Feed Testing Services Analysis, Insights and Forecast, 2020-2032
- 7.1. Market Analysis, Insights and Forecast - by Application
- 7.1.1. Feed Manufacturer
- 7.1.2. Farmer
- 7.1.3. Others
- 7.2. Market Analysis, Insights and Forecast - by Type
- 7.2.1. Mycotoxin Testing Services
- 7.2.2. Chemical Residue Testing Services
- 7.2.3. In Vivo Digestibility Analysis Services
- 7.2.4. Others
- 7.1. Market Analysis, Insights and Forecast - by Application
- 8. Europe Forage And Feed Testing Services Analysis, Insights and Forecast, 2020-2032
- 8.1. Market Analysis, Insights and Forecast - by Application
- 8.1.1. Feed Manufacturer
- 8.1.2. Farmer
- 8.1.3. Others
- 8.2. Market Analysis, Insights and Forecast - by Type
- 8.2.1. Mycotoxin Testing Services
- 8.2.2. Chemical Residue Testing Services
- 8.2.3. In Vivo Digestibility Analysis Services
- 8.2.4. Others
- 8.1. Market Analysis, Insights and Forecast - by Application
- 9. Middle East & Africa Forage And Feed Testing Services Analysis, Insights and Forecast, 2020-2032
- 9.1. Market Analysis, Insights and Forecast - by Application
- 9.1.1. Feed Manufacturer
- 9.1.2. Farmer
- 9.1.3. Others
- 9.2. Market Analysis, Insights and Forecast - by Type
- 9.2.1. Mycotoxin Testing Services
- 9.2.2. Chemical Residue Testing Services
- 9.2.3. In Vivo Digestibility Analysis Services
- 9.2.4. Others
- 9.1. Market Analysis, Insights and Forecast - by Application
- 10. Asia Pacific Forage And Feed Testing Services Analysis, Insights and Forecast, 2020-2032
- 10.1. Market Analysis, Insights and Forecast - by Application
- 10.1.1. Feed Manufacturer
- 10.1.2. Farmer
- 10.1.3. Others
- 10.2. Market Analysis, Insights and Forecast - by Type
- 10.2.1. Mycotoxin Testing Services
- 10.2.2. Chemical Residue Testing Services
- 10.2.3. In Vivo Digestibility Analysis Services
- 10.2.4. Others
- 10.1. Market Analysis, Insights and Forecast - by Application
- 11. Competitive Analysis
- 11.1. Global Market Share Analysis 2025
- 11.2. Company Profiles
- 11.2.1 SGS
- 11.2.1.1. Overview
- 11.2.1.2. Products
- 11.2.1.3. SWOT Analysis
- 11.2.1.4. Recent Developments
- 11.2.1.5. Financials (Based on Availability)
- 11.2.2 A&L Great Lakes
- 11.2.2.1. Overview
- 11.2.2.2. Products
- 11.2.2.3. SWOT Analysis
- 11.2.2.4. Recent Developments
- 11.2.2.5. Financials (Based on Availability)
- 11.2.3 Analab
- 11.2.3.1. Overview
- 11.2.3.2. Products
- 11.2.3.3. SWOT Analysis
- 11.2.3.4. Recent Developments
- 11.2.3.5. Financials (Based on Availability)
- 11.2.4 Dairy One Forage Lab
- 11.2.4.1. Overview
- 11.2.4.2. Products
- 11.2.4.3. SWOT Analysis
- 11.2.4.4. Recent Developments
- 11.2.4.5. Financials (Based on Availability)
- 11.2.5 Dairyland Laboratories
- 11.2.5.1. Overview
- 11.2.5.2. Products
- 11.2.5.3. SWOT Analysis
- 11.2.5.4. Recent Developments
- 11.2.5.5. Financials (Based on Availability)
- 11.2.6 Foragelab
- 11.2.6.1. Overview
- 11.2.6.2. Products
- 11.2.6.3. SWOT Analysis
- 11.2.6.4. Recent Developments
- 11.2.6.5. Financials (Based on Availability)
- 11.2.7 LSU AgCenter
- 11.2.7.1. Overview
- 11.2.7.2. Products
- 11.2.7.3. SWOT Analysis
- 11.2.7.4. Recent Developments
- 11.2.7.5. Financials (Based on Availability)
- 11.2.8 MasterLab
- 11.2.8.1. Overview
- 11.2.8.2. Products
- 11.2.8.3. SWOT Analysis
- 11.2.8.4. Recent Developments
- 11.2.8.5. Financials (Based on Availability)
- 11.2.9 ServiTech Labs
- 11.2.9.1. Overview
- 11.2.9.2. Products
- 11.2.9.3. SWOT Analysis
- 11.2.9.4. Recent Developments
- 11.2.9.5. Financials (Based on Availability)
- 11.2.10 SRUC
- 11.2.10.1. Overview
- 11.2.10.2. Products
- 11.2.10.3. SWOT Analysis
- 11.2.10.4. Recent Developments
- 11.2.10.5. Financials (Based on Availability)
- 11.2.11 SWFAL
- 11.2.11.1. Overview
- 11.2.11.2. Products
- 11.2.11.3. SWOT Analysis
- 11.2.11.4. Recent Developments
- 11.2.11.5. Financials (Based on Availability)
- 11.2.1 SGS
List of Figures
- Figure 1: Global Forage And Feed Testing Services Revenue Breakdown (million, %) by Region 2025 & 2033
- Figure 2: North America Forage And Feed Testing Services Revenue (million), by Application 2025 & 2033
- Figure 3: North America Forage And Feed Testing Services Revenue Share (%), by Application 2025 & 2033
- Figure 4: North America Forage And Feed Testing Services Revenue (million), by Type 2025 & 2033
- Figure 5: North America Forage And Feed Testing Services Revenue Share (%), by Type 2025 & 2033
- Figure 6: North America Forage And Feed Testing Services Revenue (million), by Country 2025 & 2033
- Figure 7: North America Forage And Feed Testing Services Revenue Share (%), by Country 2025 & 2033
- Figure 8: South America Forage And Feed Testing Services Revenue (million), by Application 2025 & 2033
- Figure 9: South America Forage And Feed Testing Services Revenue Share (%), by Application 2025 & 2033
- Figure 10: South America Forage And Feed Testing Services Revenue (million), by Type 2025 & 2033
- Figure 11: South America Forage And Feed Testing Services Revenue Share (%), by Type 2025 & 2033
- Figure 12: South America Forage And Feed Testing Services Revenue (million), by Country 2025 & 2033
- Figure 13: South America Forage And Feed Testing Services Revenue Share (%), by Country 2025 & 2033
- Figure 14: Europe Forage And Feed Testing Services Revenue (million), by Application 2025 & 2033
- Figure 15: Europe Forage And Feed Testing Services Revenue Share (%), by Application 2025 & 2033
- Figure 16: Europe Forage And Feed Testing Services Revenue (million), by Type 2025 & 2033
- Figure 17: Europe Forage And Feed Testing Services Revenue Share (%), by Type 2025 & 2033
- Figure 18: Europe Forage And Feed Testing Services Revenue (million), by Country 2025 & 2033
- Figure 19: Europe Forage And Feed Testing Services Revenue Share (%), by Country 2025 & 2033
- Figure 20: Middle East & Africa Forage And Feed Testing Services Revenue (million), by Application 2025 & 2033
- Figure 21: Middle East & Africa Forage And Feed Testing Services Revenue Share (%), by Application 2025 & 2033
- Figure 22: Middle East & Africa Forage And Feed Testing Services Revenue (million), by Type 2025 & 2033
- Figure 23: Middle East & Africa Forage And Feed Testing Services Revenue Share (%), by Type 2025 & 2033
- Figure 24: Middle East & Africa Forage And Feed Testing Services Revenue (million), by Country 2025 & 2033
- Figure 25: Middle East & Africa Forage And Feed Testing Services Revenue Share (%), by Country 2025 & 2033
- Figure 26: Asia Pacific Forage And Feed Testing Services Revenue (million), by Application 2025 & 2033
- Figure 27: Asia Pacific Forage And Feed Testing Services Revenue Share (%), by Application 2025 & 2033
- Figure 28: Asia Pacific Forage And Feed Testing Services Revenue (million), by Type 2025 & 2033
- Figure 29: Asia Pacific Forage And Feed Testing Services Revenue Share (%), by Type 2025 & 2033
- Figure 30: Asia Pacific Forage And Feed Testing Services Revenue (million), by Country 2025 & 2033
- Figure 31: Asia Pacific Forage And Feed Testing Services Revenue Share (%), by Country 2025 & 2033
List of Tables
- Table 1: Global Forage And Feed Testing Services Revenue million Forecast, by Application 2020 & 2033
- Table 2: Global Forage And Feed Testing Services Revenue million Forecast, by Type 2020 & 2033
- Table 3: Global Forage And Feed Testing Services Revenue million Forecast, by Region 2020 & 2033
- Table 4: Global Forage And Feed Testing Services Revenue million Forecast, by Application 2020 & 2033
- Table 5: Global Forage And Feed Testing Services Revenue million Forecast, by Type 2020 & 2033
- Table 6: Global Forage And Feed Testing Services Revenue million Forecast, by Country 2020 & 2033
- Table 7: United States Forage And Feed Testing Services Revenue (million) Forecast, by Application 2020 & 2033
- Table 8: Canada Forage And Feed Testing Services Revenue (million) Forecast, by Application 2020 & 2033
- Table 9: Mexico Forage And Feed Testing Services Revenue (million) Forecast, by Application 2020 & 2033
- Table 10: Global Forage And Feed Testing Services Revenue million Forecast, by Application 2020 & 2033
- Table 11: Global Forage And Feed Testing Services Revenue million Forecast, by Type 2020 & 2033
- Table 12: Global Forage And Feed Testing Services Revenue million Forecast, by Country 2020 & 2033
- Table 13: Brazil Forage And Feed Testing Services Revenue (million) Forecast, by Application 2020 & 2033
- Table 14: Argentina Forage And Feed Testing Services Revenue (million) Forecast, by Application 2020 & 2033
- Table 15: Rest of South America Forage And Feed Testing Services Revenue (million) Forecast, by Application 2020 & 2033
- Table 16: Global Forage And Feed Testing Services Revenue million Forecast, by Application 2020 & 2033
- Table 17: Global Forage And Feed Testing Services Revenue million Forecast, by Type 2020 & 2033
- Table 18: Global Forage And Feed Testing Services Revenue million Forecast, by Country 2020 & 2033
- Table 19: United Kingdom Forage And Feed Testing Services Revenue (million) Forecast, by Application 2020 & 2033
- Table 20: Germany Forage And Feed Testing Services Revenue (million) Forecast, by Application 2020 & 2033
- Table 21: France Forage And Feed Testing Services Revenue (million) Forecast, by Application 2020 & 2033
- Table 22: Italy Forage And Feed Testing Services Revenue (million) Forecast, by Application 2020 & 2033
- Table 23: Spain Forage And Feed Testing Services Revenue (million) Forecast, by Application 2020 & 2033
- Table 24: Russia Forage And Feed Testing Services Revenue (million) Forecast, by Application 2020 & 2033
- Table 25: Benelux Forage And Feed Testing Services Revenue (million) Forecast, by Application 2020 & 2033
- Table 26: Nordics Forage And Feed Testing Services Revenue (million) Forecast, by Application 2020 & 2033
- Table 27: Rest of Europe Forage And Feed Testing Services Revenue (million) Forecast, by Application 2020 & 2033
- Table 28: Global Forage And Feed Testing Services Revenue million Forecast, by Application 2020 & 2033
- Table 29: Global Forage And Feed Testing Services Revenue million Forecast, by Type 2020 & 2033
- Table 30: Global Forage And Feed Testing Services Revenue million Forecast, by Country 2020 & 2033
- Table 31: Turkey Forage And Feed Testing Services Revenue (million) Forecast, by Application 2020 & 2033
- Table 32: Israel Forage And Feed Testing Services Revenue (million) Forecast, by Application 2020 & 2033
- Table 33: GCC Forage And Feed Testing Services Revenue (million) Forecast, by Application 2020 & 2033
- Table 34: North Africa Forage And Feed Testing Services Revenue (million) Forecast, by Application 2020 & 2033
- Table 35: South Africa Forage And Feed Testing Services Revenue (million) Forecast, by Application 2020 & 2033
- Table 36: Rest of Middle East & Africa Forage And Feed Testing Services Revenue (million) Forecast, by Application 2020 & 2033
- Table 37: Global Forage And Feed Testing Services Revenue million Forecast, by Application 2020 & 2033
- Table 38: Global Forage And Feed Testing Services Revenue million Forecast, by Type 2020 & 2033
- Table 39: Global Forage And Feed Testing Services Revenue million Forecast, by Country 2020 & 2033
- Table 40: China Forage And Feed Testing Services Revenue (million) Forecast, by Application 2020 & 2033
- Table 41: India Forage And Feed Testing Services Revenue (million) Forecast, by Application 2020 & 2033
- Table 42: Japan Forage And Feed Testing Services Revenue (million) Forecast, by Application 2020 & 2033
- Table 43: South Korea Forage And Feed Testing Services Revenue (million) Forecast, by Application 2020 & 2033
- Table 44: ASEAN Forage And Feed Testing Services Revenue (million) Forecast, by Application 2020 & 2033
- Table 45: Oceania Forage And Feed Testing Services Revenue (million) Forecast, by Application 2020 & 2033
- Table 46: Rest of Asia Pacific Forage And Feed Testing Services Revenue (million) Forecast, by Application 2020 & 2033
Frequently Asked Questions
1. What is the projected Compound Annual Growth Rate (CAGR) of the Forage And Feed Testing Services?
The projected CAGR is approximately 3.5%.
2. Which companies are prominent players in the Forage And Feed Testing Services?
Key companies in the market include SGS, A&L Great Lakes, Analab, Dairy One Forage Lab, Dairyland Laboratories, Foragelab, LSU AgCenter, MasterLab, ServiTech Labs, SRUC, SWFAL.
3. What are the main segments of the Forage And Feed Testing Services?
The market segments include Application, Type.
4. Can you provide details about the market size?
The market size is estimated to be USD 127 million as of 2022.
5. What are some drivers contributing to market growth?
N/A
6. What are the notable trends driving market growth?
N/A
7. Are there any restraints impacting market growth?
N/A
8. Can you provide examples of recent developments in the market?
N/A
9. What pricing options are available for accessing the report?
Pricing options include single-user, multi-user, and enterprise licenses priced at USD 3950.00, USD 5925.00, and USD 7900.00 respectively.
10. Is the market size provided in terms of value or volume?
The market size is provided in terms of value, measured in million.
11. Are there any specific market keywords associated with the report?
Yes, the market keyword associated with the report is "Forage And Feed Testing Services," which aids in identifying and referencing the specific market segment covered.
12. How do I determine which pricing option suits my needs best?
The pricing options vary based on user requirements and access needs. Individual users may opt for single-user licenses, while businesses requiring broader access may choose multi-user or enterprise licenses for cost-effective access to the report.
13. Are there any additional resources or data provided in the Forage And Feed Testing Services report?
While the report offers comprehensive insights, it's advisable to review the specific contents or supplementary materials provided to ascertain if additional resources or data are available.
14. How can I stay updated on further developments or reports in the Forage And Feed Testing Services?
To stay informed about further developments, trends, and reports in the Forage And Feed Testing Services, consider subscribing to industry newsletters, following relevant companies and organizations, or regularly checking reputable industry news sources and publications.
Methodology
Step 1 - Identification of Relevant Samples Size from Population Database


Step 2 - Approaches for Defining Global Market Size (Value, Volume* & Price*)

Note*: In applicable scenarios
Step 3 - Data Sources
Primary Research
- Web Analytics
- Survey Reports
- Research Institute
- Latest Research Reports
- Opinion Leaders
Secondary Research
- Annual Reports
- White Paper
- Latest Press Release
- Industry Association
- Paid Database
- Investor Presentations

Step 4 - Data Triangulation
Involves using different sources of information in order to increase the validity of a study
These sources are likely to be stakeholders in a program - participants, other researchers, program staff, other community members, and so on.
Then we put all data in single framework & apply various statistical tools to find out the dynamic on the market.
During the analysis stage, feedback from the stakeholder groups would be compared to determine areas of agreement as well as areas of divergence