
Key Insights
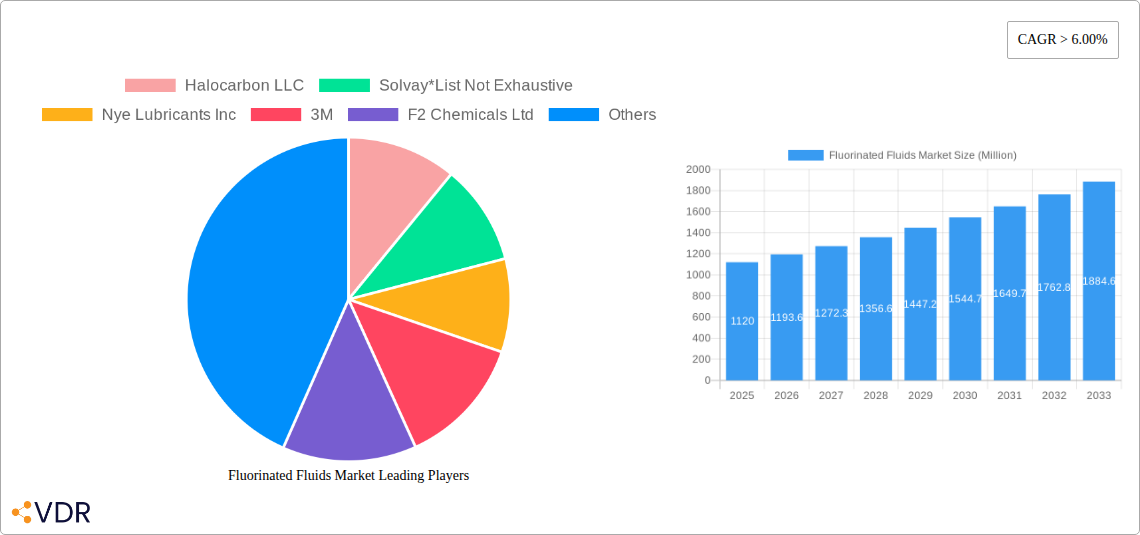
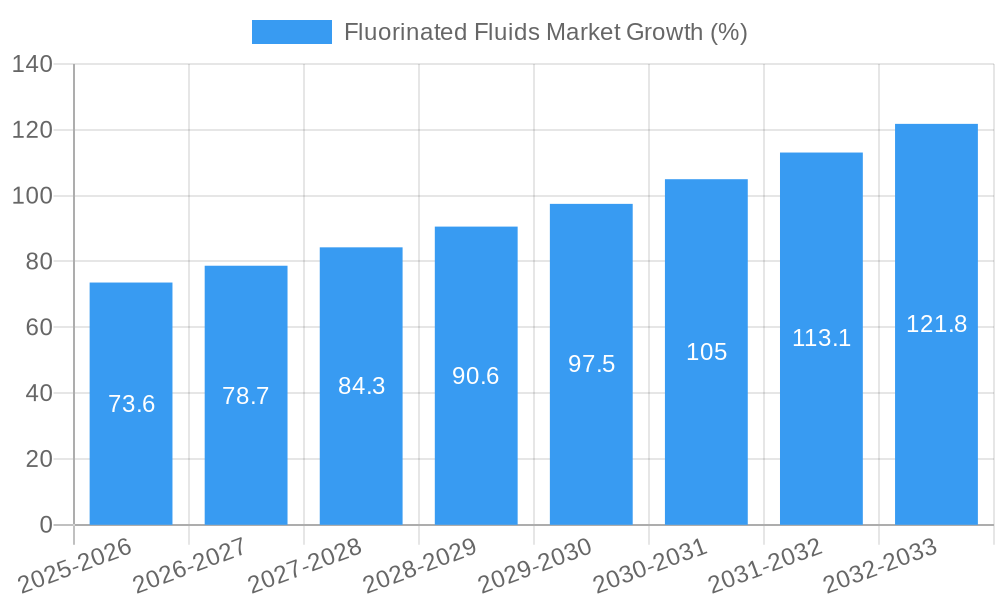
The fluorinated fluids market, valued at $1.12 billion in 2025, is projected to experience robust growth, exhibiting a Compound Annual Growth Rate (CAGR) exceeding 6.00% from 2025 to 2033. This expansion is driven by the increasing demand across diverse sectors, primarily fueled by the unique properties of fluorinated fluids—their exceptional thermal stability, chemical inertness, and dielectric strength. Key application areas include lubricants in high-performance machinery, heat transfer fluids in demanding industrial processes, and specialized solvents in electronics manufacturing. The automotive and electrical & electronics industries are significant end-user segments, contributing substantially to market growth. Furthermore, the burgeoning renewable energy sector and the increasing adoption of electric vehicles are further bolstering demand for fluorinated fluids with specialized performance characteristics. Growth is anticipated to be particularly strong in the Asia-Pacific region, driven by rapid industrialization and economic expansion in countries like China and India. While the market faces constraints such as stringent environmental regulations concerning the use of certain fluorinated compounds and the high cost associated with their production, the ongoing innovation in environmentally friendly fluorinated alternatives and the continued need for high-performance fluids in specialized applications are likely to mitigate these challenges and support sustained market expansion throughout the forecast period.
The competitive landscape is characterized by a mix of established global players and regional specialists. Major companies such as 3M, Solvay, and Halocarbon LLC hold significant market share, benefiting from established brand recognition and extensive distribution networks. However, smaller, specialized companies are also making inroads by focusing on niche applications and developing innovative product offerings. The market's future trajectory hinges on the balance between addressing environmental concerns through sustainable alternatives and meeting the ever-growing demand for high-performance fluids across a broad range of industries. Continuous research and development efforts focused on enhancing efficiency, reducing environmental impact, and developing specialized fluids tailored to specific applications will play a critical role in shaping the future growth of this dynamic market.
Fluorinated Fluids Market: A Comprehensive Report (2019-2033)
This comprehensive report provides a detailed analysis of the Fluorinated Fluids market, encompassing market dynamics, growth trends, regional insights, and key player strategies. With a focus on the parent market of specialty chemicals and the child market of industrial fluids, this report offers invaluable insights for industry professionals, investors, and strategic decision-makers. The study period covers 2019-2033, with 2025 as the base year and a forecast period of 2025-2033. The market size is presented in million units.
Fluorinated Fluids Market Market Dynamics & Structure
The fluorinated fluids market is characterized by moderate concentration, with several key players holding significant market share. Technological innovation, driven by the demand for high-performance fluids in diverse applications, is a major growth driver. Stringent environmental regulations, particularly concerning PFAS (per- and polyfluoroalkyl substances), are shaping the market landscape and influencing product development. The market witnesses continuous competition from alternative fluids, and M&A activity plays a significant role in market consolidation and expansion.
- Market Concentration: Moderately concentrated, with the top 5 players accounting for approximately xx% of the global market share in 2025.
- Technological Innovation: Focus on developing eco-friendly, high-performance fluids with improved thermal stability, chemical resistance, and lubricity.
- Regulatory Framework: Increasing scrutiny on PFAS usage is driving the search for sustainable alternatives.
- Competitive Product Substitutes: Silicone oils, hydrocarbon-based fluids, and other specialty chemicals pose competition.
- End-User Demographics: Diversified across various industries, with Electrical & Electronics and Automotive being major end-users.
- M&A Trends: Moderate M&A activity observed in recent years, driven by expansion into new markets and technological capabilities. xx M&A deals were recorded between 2019 and 2024.
Fluorinated Fluids Market Growth Trends & Insights
The fluorinated fluids market experienced steady growth during the historical period (2019-2024), driven by increasing demand from diverse end-user industries. The market size reached xx million units in 2024, exhibiting a CAGR of xx% during this period. The forecast period (2025-2033) projects continued growth, with the market size expected to reach xx million units by 2033, driven by technological advancements, increased adoption rates in emerging applications, and expansion into new geographical markets. The CAGR during the forecast period is estimated to be xx%. Market penetration across different end-user industries is also expected to increase significantly over the next decade. Technological advancements such as the development of fluorinated fluids with enhanced performance characteristics and improved sustainability profiles are expected to drive market growth. Furthermore, changing consumer preferences towards environmentally friendly products are expected to influence market dynamics. The emergence of novel applications will also contribute to market expansion.
Dominant Regions, Countries, or Segments in Fluorinated Fluids Market
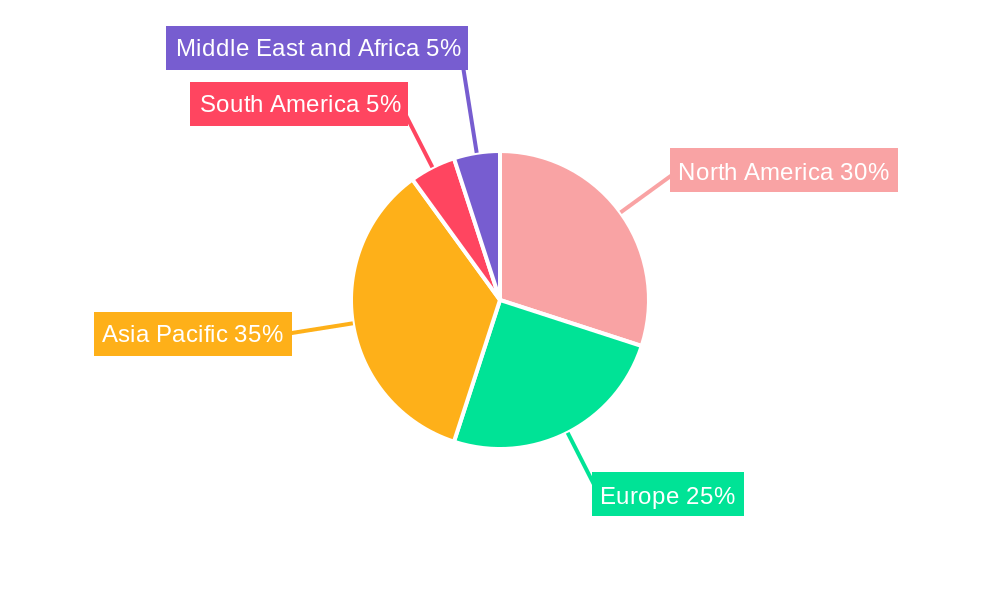
North America currently holds the largest market share in the fluorinated fluids market, followed by Europe and Asia Pacific. Within applications, Lubricants segment is currently dominant followed by Heat Transfer Fluids and Others (solvents etc.). The Electrical & Electronics and Automotive industries are the largest end-user segments. The dominance of North America is attributed to the strong presence of major players, advanced technological infrastructure, and high demand from various end-user industries. Europe is driven by robust automotive and chemical industries, while Asia Pacific shows strong growth potential due to rapid industrialization and increasing demand for high-performance materials.
- Key Drivers for North America: Established manufacturing base, strong R&D infrastructure, and stringent environmental regulations driving innovation.
- Key Drivers for Europe: Strong presence of automotive and chemical industries, supportive government policies, and focus on sustainability.
- Key Drivers for Asia Pacific: Rapid industrialization, growing demand for electronic products, and increasing investments in infrastructure.
- Application Segment Dominance: Lubricants account for xx% market share in 2025, driven by its wide range of applications across various industries.
- End-user Industry Dominance: Electrical & Electronics sector commands xx% market share, primarily driven by the demand for high-performance materials in electronic components.
Fluorinated Fluids Market Product Landscape
Fluorinated fluids encompass a wide range of products with varying chemical compositions and performance characteristics, catering to diverse applications. These include perfluoropolyethers (PFPEs), fluorinated hydrocarbons, and fluorinated ethers. Key product innovations focus on improved thermal stability, chemical resistance, lubricity, and reduced environmental impact. Unique selling propositions often center on enhanced performance in extreme conditions, such as high temperatures or pressures, as well as compliance with increasingly stringent environmental regulations. The development of bio-based fluorinated fluids represents a significant technological advancement aimed at minimizing environmental concerns.
Key Drivers, Barriers & Challenges in Fluorinated Fluids Market
Key Drivers:
- Growing demand from various end-user industries, particularly in the electronics and automotive sectors.
- Technological advancements in developing high-performance fluids with enhanced properties.
- Stringent environmental regulations driving the need for eco-friendly alternatives.
Key Challenges:
- Concerns regarding the environmental impact of some fluorinated fluids, particularly PFAS.
- Fluctuations in raw material prices and supply chain disruptions.
- Intense competition from alternative fluids and substitutes. The impact of these challenges has resulted in a xx% decrease in market growth in the past year.
Emerging Opportunities in Fluorinated Fluids Market
- Expanding applications in renewable energy technologies, such as solar panels and wind turbines.
- Development of bio-based fluorinated fluids to address environmental concerns.
- Increasing demand for high-performance fluids in emerging markets.
Growth Accelerators in the Fluorinated Fluids Market Industry
Technological breakthroughs in synthesizing novel fluorinated fluids with superior properties, coupled with strategic partnerships between manufacturers and end-users, are accelerating market growth. Expansion into emerging markets, coupled with focused marketing strategies emphasizing the benefits of high-performance fluorinated fluids, represents key growth catalysts. Furthermore, initiatives aimed at developing sustainable and environmentally friendly fluorinated fluids are paving the way for long-term market expansion.
Key Players Shaping the Fluorinated Fluids Market Market
- Halocarbon LLC
- Solvay
- Nye Lubricants Inc
- 3M
- F2 Chemicals Ltd
- Engineered Fluids
- AGC Chemicals Americas
- IKV Tribology Ltd
- Halocarbon
- Perstorp
- Lubrilog
Notable Milestones in Fluorinated Fluids Market Sector
- April 2023: Solvay launched the new Tecnoflon SHP, a new product line of fully fluorinated synthetic rubbers (FFKM) industrial, expanding its product portfolio and catering to the growing demand for high-performance materials in demanding applications.
- December 2022: 3M announced the exit of per- and polyfluoroalkyl substance (PFAS) manufacturing and work to discontinue the use of PFAS across its product portfolio by the end of 2025, signaling a significant shift towards more sustainable alternatives within the industry.
In-Depth Fluorinated Fluids Market Market Outlook
The fluorinated fluids market is poised for robust growth in the coming years, driven by technological innovation, expanding applications across diverse industries, and a growing focus on sustainability. Strategic partnerships, market expansion initiatives, and the development of new, high-performance fluids will continue to shape the market landscape. Companies focusing on environmentally friendly solutions and catering to the rising demand from emerging economies are expected to gain a competitive advantage. The market offers significant opportunities for players who can innovate and adapt to the evolving regulatory landscape and consumer preferences.
Fluorinated Fluids Market Segmentation
-
1. Application
- 1.1. Lubricants
- 1.2. Heat Transfer Fluids
- 1.3. Others (Solvents, etc.)
-
2. End-user Industry
- 2.1. Electrical & Electronics
- 2.2. Automotive
- 2.3. Chemical Industries
- 2.4. Power Generation
- 2.5. Oil and Gas
- 2.6. Others (Semiconductor, Aerospace, etc.)
Fluorinated Fluids Market Segmentation By Geography
-
1. Asia Pacific
- 1.1. China
- 1.2. India
- 1.3. Japan
- 1.4. South Korea
- 1.5. Rest of Asia Pacific
-
2. North America
- 2.1. United States
- 2.2. Canada
- 2.3. Mexico
-
3. Europe
- 3.1. Germany
- 3.2. United Kingdom
- 3.3. Italy
- 3.4. France
- 3.5. Rest of Europe
-
4. South America
- 4.1. Brazil
- 4.2. Argentina
- 4.3. Rest of South America
-
5. Middle East and Africa
- 5.1. Saudi Arabia
- 5.2. South Africa
- 5.3. Rest of Middle East and Africa
Fluorinated Fluids Market REPORT HIGHLIGHTS
| Aspects | Details |
|---|---|
| Study Period | 2019-2033 |
| Base Year | 2024 |
| Estimated Year | 2025 |
| Forecast Period | 2025-2033 |
| Historical Period | 2019-2024 |
| Growth Rate | CAGR of > 6.00% from 2019-2033 |
| Segmentation |
|
Table of Contents
- 1. Introduction
- 1.1. Research Scope
- 1.2. Market Segmentation
- 1.3. Research Methodology
- 1.4. Definitions and Assumptions
- 2. Executive Summary
- 2.1. Introduction
- 3. Market Dynamics
- 3.1. Introduction
- 3.2. Market Drivers
- 3.2.1. Growing Demand for High Performance Heat Transfer Fluids; Superior and Eco-friendly Properties of Engineered Fluids; Other Drivers
- 3.3. Market Restrains
- 3.3.1. Higher Manufacturing and Maintenance Costs; Other Restraints
- 3.4. Market Trends
- 3.4.1. Growing Demand for Lubricants from Automotive Sector
- 4. Market Factor Analysis
- 4.1. Porters Five Forces
- 4.2. Supply/Value Chain
- 4.3. PESTEL analysis
- 4.4. Market Entropy
- 4.5. Patent/Trademark Analysis
- 5. Global Fluorinated Fluids Market Analysis, Insights and Forecast, 2019-2031
- 5.1. Market Analysis, Insights and Forecast - by Application
- 5.1.1. Lubricants
- 5.1.2. Heat Transfer Fluids
- 5.1.3. Others (Solvents, etc.)
- 5.2. Market Analysis, Insights and Forecast - by End-user Industry
- 5.2.1. Electrical & Electronics
- 5.2.2. Automotive
- 5.2.3. Chemical Industries
- 5.2.4. Power Generation
- 5.2.5. Oil and Gas
- 5.2.6. Others (Semiconductor, Aerospace, etc.)
- 5.3. Market Analysis, Insights and Forecast - by Region
- 5.3.1. Asia Pacific
- 5.3.2. North America
- 5.3.3. Europe
- 5.3.4. South America
- 5.3.5. Middle East and Africa
- 5.1. Market Analysis, Insights and Forecast - by Application
- 6. Asia Pacific Fluorinated Fluids Market Analysis, Insights and Forecast, 2019-2031
- 6.1. Market Analysis, Insights and Forecast - by Application
- 6.1.1. Lubricants
- 6.1.2. Heat Transfer Fluids
- 6.1.3. Others (Solvents, etc.)
- 6.2. Market Analysis, Insights and Forecast - by End-user Industry
- 6.2.1. Electrical & Electronics
- 6.2.2. Automotive
- 6.2.3. Chemical Industries
- 6.2.4. Power Generation
- 6.2.5. Oil and Gas
- 6.2.6. Others (Semiconductor, Aerospace, etc.)
- 6.1. Market Analysis, Insights and Forecast - by Application
- 7. North America Fluorinated Fluids Market Analysis, Insights and Forecast, 2019-2031
- 7.1. Market Analysis, Insights and Forecast - by Application
- 7.1.1. Lubricants
- 7.1.2. Heat Transfer Fluids
- 7.1.3. Others (Solvents, etc.)
- 7.2. Market Analysis, Insights and Forecast - by End-user Industry
- 7.2.1. Electrical & Electronics
- 7.2.2. Automotive
- 7.2.3. Chemical Industries
- 7.2.4. Power Generation
- 7.2.5. Oil and Gas
- 7.2.6. Others (Semiconductor, Aerospace, etc.)
- 7.1. Market Analysis, Insights and Forecast - by Application
- 8. Europe Fluorinated Fluids Market Analysis, Insights and Forecast, 2019-2031
- 8.1. Market Analysis, Insights and Forecast - by Application
- 8.1.1. Lubricants
- 8.1.2. Heat Transfer Fluids
- 8.1.3. Others (Solvents, etc.)
- 8.2. Market Analysis, Insights and Forecast - by End-user Industry
- 8.2.1. Electrical & Electronics
- 8.2.2. Automotive
- 8.2.3. Chemical Industries
- 8.2.4. Power Generation
- 8.2.5. Oil and Gas
- 8.2.6. Others (Semiconductor, Aerospace, etc.)
- 8.1. Market Analysis, Insights and Forecast - by Application
- 9. South America Fluorinated Fluids Market Analysis, Insights and Forecast, 2019-2031
- 9.1. Market Analysis, Insights and Forecast - by Application
- 9.1.1. Lubricants
- 9.1.2. Heat Transfer Fluids
- 9.1.3. Others (Solvents, etc.)
- 9.2. Market Analysis, Insights and Forecast - by End-user Industry
- 9.2.1. Electrical & Electronics
- 9.2.2. Automotive
- 9.2.3. Chemical Industries
- 9.2.4. Power Generation
- 9.2.5. Oil and Gas
- 9.2.6. Others (Semiconductor, Aerospace, etc.)
- 9.1. Market Analysis, Insights and Forecast - by Application
- 10. Middle East and Africa Fluorinated Fluids Market Analysis, Insights and Forecast, 2019-2031
- 10.1. Market Analysis, Insights and Forecast - by Application
- 10.1.1. Lubricants
- 10.1.2. Heat Transfer Fluids
- 10.1.3. Others (Solvents, etc.)
- 10.2. Market Analysis, Insights and Forecast - by End-user Industry
- 10.2.1. Electrical & Electronics
- 10.2.2. Automotive
- 10.2.3. Chemical Industries
- 10.2.4. Power Generation
- 10.2.5. Oil and Gas
- 10.2.6. Others (Semiconductor, Aerospace, etc.)
- 10.1. Market Analysis, Insights and Forecast - by Application
- 11. Asia Pacific Fluorinated Fluids Market Analysis, Insights and Forecast, 2019-2031
- 11.1. Market Analysis, Insights and Forecast - By Country/Sub-region
- 11.1.1 China
- 11.1.2 India
- 11.1.3 Japan
- 11.1.4 South Korea
- 11.1.5 Rest of Asia Pacific
- 12. North America Fluorinated Fluids Market Analysis, Insights and Forecast, 2019-2031
- 12.1. Market Analysis, Insights and Forecast - By Country/Sub-region
- 12.1.1 United States
- 12.1.2 Canada
- 12.1.3 Mexico
- 13. Europe Fluorinated Fluids Market Analysis, Insights and Forecast, 2019-2031
- 13.1. Market Analysis, Insights and Forecast - By Country/Sub-region
- 13.1.1 Germany
- 13.1.2 United Kingdom
- 13.1.3 Italy
- 13.1.4 France
- 13.1.5 Rest of Europe
- 14. South America Fluorinated Fluids Market Analysis, Insights and Forecast, 2019-2031
- 14.1. Market Analysis, Insights and Forecast - By Country/Sub-region
- 14.1.1 Brazil
- 14.1.2 Argentina
- 14.1.3 Rest of South America
- 15. Middle East and Africa Fluorinated Fluids Market Analysis, Insights and Forecast, 2019-2031
- 15.1. Market Analysis, Insights and Forecast - By Country/Sub-region
- 15.1.1 Saudi Arabia
- 15.1.2 South Africa
- 15.1.3 Rest of Middle East and Africa
- 16. Competitive Analysis
- 16.1. Global Market Share Analysis 2024
- 16.2. Company Profiles
- 16.2.1 Halocarbon LLC
- 16.2.1.1. Overview
- 16.2.1.2. Products
- 16.2.1.3. SWOT Analysis
- 16.2.1.4. Recent Developments
- 16.2.1.5. Financials (Based on Availability)
- 16.2.2 Solvay*List Not Exhaustive
- 16.2.2.1. Overview
- 16.2.2.2. Products
- 16.2.2.3. SWOT Analysis
- 16.2.2.4. Recent Developments
- 16.2.2.5. Financials (Based on Availability)
- 16.2.3 Nye Lubricants Inc
- 16.2.3.1. Overview
- 16.2.3.2. Products
- 16.2.3.3. SWOT Analysis
- 16.2.3.4. Recent Developments
- 16.2.3.5. Financials (Based on Availability)
- 16.2.4 3M
- 16.2.4.1. Overview
- 16.2.4.2. Products
- 16.2.4.3. SWOT Analysis
- 16.2.4.4. Recent Developments
- 16.2.4.5. Financials (Based on Availability)
- 16.2.5 F2 Chemicals Ltd
- 16.2.5.1. Overview
- 16.2.5.2. Products
- 16.2.5.3. SWOT Analysis
- 16.2.5.4. Recent Developments
- 16.2.5.5. Financials (Based on Availability)
- 16.2.6 Engineered Fluids
- 16.2.6.1. Overview
- 16.2.6.2. Products
- 16.2.6.3. SWOT Analysis
- 16.2.6.4. Recent Developments
- 16.2.6.5. Financials (Based on Availability)
- 16.2.7 AGC Chemicals Americas
- 16.2.7.1. Overview
- 16.2.7.2. Products
- 16.2.7.3. SWOT Analysis
- 16.2.7.4. Recent Developments
- 16.2.7.5. Financials (Based on Availability)
- 16.2.8 IKV Tribology Ltd
- 16.2.8.1. Overview
- 16.2.8.2. Products
- 16.2.8.3. SWOT Analysis
- 16.2.8.4. Recent Developments
- 16.2.8.5. Financials (Based on Availability)
- 16.2.9 Halocarbon
- 16.2.9.1. Overview
- 16.2.9.2. Products
- 16.2.9.3. SWOT Analysis
- 16.2.9.4. Recent Developments
- 16.2.9.5. Financials (Based on Availability)
- 16.2.10 Perstorp
- 16.2.10.1. Overview
- 16.2.10.2. Products
- 16.2.10.3. SWOT Analysis
- 16.2.10.4. Recent Developments
- 16.2.10.5. Financials (Based on Availability)
- 16.2.11 Lubrilog
- 16.2.11.1. Overview
- 16.2.11.2. Products
- 16.2.11.3. SWOT Analysis
- 16.2.11.4. Recent Developments
- 16.2.11.5. Financials (Based on Availability)
- 16.2.1 Halocarbon LLC
List of Figures
- Figure 1: Global Fluorinated Fluids Market Revenue Breakdown (Million, %) by Region 2024 & 2032
- Figure 2: Asia Pacific Fluorinated Fluids Market Revenue (Million), by Country 2024 & 2032
- Figure 3: Asia Pacific Fluorinated Fluids Market Revenue Share (%), by Country 2024 & 2032
- Figure 4: North America Fluorinated Fluids Market Revenue (Million), by Country 2024 & 2032
- Figure 5: North America Fluorinated Fluids Market Revenue Share (%), by Country 2024 & 2032
- Figure 6: Europe Fluorinated Fluids Market Revenue (Million), by Country 2024 & 2032
- Figure 7: Europe Fluorinated Fluids Market Revenue Share (%), by Country 2024 & 2032
- Figure 8: South America Fluorinated Fluids Market Revenue (Million), by Country 2024 & 2032
- Figure 9: South America Fluorinated Fluids Market Revenue Share (%), by Country 2024 & 2032
- Figure 10: Middle East and Africa Fluorinated Fluids Market Revenue (Million), by Country 2024 & 2032
- Figure 11: Middle East and Africa Fluorinated Fluids Market Revenue Share (%), by Country 2024 & 2032
- Figure 12: Asia Pacific Fluorinated Fluids Market Revenue (Million), by Application 2024 & 2032
- Figure 13: Asia Pacific Fluorinated Fluids Market Revenue Share (%), by Application 2024 & 2032
- Figure 14: Asia Pacific Fluorinated Fluids Market Revenue (Million), by End-user Industry 2024 & 2032
- Figure 15: Asia Pacific Fluorinated Fluids Market Revenue Share (%), by End-user Industry 2024 & 2032
- Figure 16: Asia Pacific Fluorinated Fluids Market Revenue (Million), by Country 2024 & 2032
- Figure 17: Asia Pacific Fluorinated Fluids Market Revenue Share (%), by Country 2024 & 2032
- Figure 18: North America Fluorinated Fluids Market Revenue (Million), by Application 2024 & 2032
- Figure 19: North America Fluorinated Fluids Market Revenue Share (%), by Application 2024 & 2032
- Figure 20: North America Fluorinated Fluids Market Revenue (Million), by End-user Industry 2024 & 2032
- Figure 21: North America Fluorinated Fluids Market Revenue Share (%), by End-user Industry 2024 & 2032
- Figure 22: North America Fluorinated Fluids Market Revenue (Million), by Country 2024 & 2032
- Figure 23: North America Fluorinated Fluids Market Revenue Share (%), by Country 2024 & 2032
- Figure 24: Europe Fluorinated Fluids Market Revenue (Million), by Application 2024 & 2032
- Figure 25: Europe Fluorinated Fluids Market Revenue Share (%), by Application 2024 & 2032
- Figure 26: Europe Fluorinated Fluids Market Revenue (Million), by End-user Industry 2024 & 2032
- Figure 27: Europe Fluorinated Fluids Market Revenue Share (%), by End-user Industry 2024 & 2032
- Figure 28: Europe Fluorinated Fluids Market Revenue (Million), by Country 2024 & 2032
- Figure 29: Europe Fluorinated Fluids Market Revenue Share (%), by Country 2024 & 2032
- Figure 30: South America Fluorinated Fluids Market Revenue (Million), by Application 2024 & 2032
- Figure 31: South America Fluorinated Fluids Market Revenue Share (%), by Application 2024 & 2032
- Figure 32: South America Fluorinated Fluids Market Revenue (Million), by End-user Industry 2024 & 2032
- Figure 33: South America Fluorinated Fluids Market Revenue Share (%), by End-user Industry 2024 & 2032
- Figure 34: South America Fluorinated Fluids Market Revenue (Million), by Country 2024 & 2032
- Figure 35: South America Fluorinated Fluids Market Revenue Share (%), by Country 2024 & 2032
- Figure 36: Middle East and Africa Fluorinated Fluids Market Revenue (Million), by Application 2024 & 2032
- Figure 37: Middle East and Africa Fluorinated Fluids Market Revenue Share (%), by Application 2024 & 2032
- Figure 38: Middle East and Africa Fluorinated Fluids Market Revenue (Million), by End-user Industry 2024 & 2032
- Figure 39: Middle East and Africa Fluorinated Fluids Market Revenue Share (%), by End-user Industry 2024 & 2032
- Figure 40: Middle East and Africa Fluorinated Fluids Market Revenue (Million), by Country 2024 & 2032
- Figure 41: Middle East and Africa Fluorinated Fluids Market Revenue Share (%), by Country 2024 & 2032
List of Tables
- Table 1: Global Fluorinated Fluids Market Revenue Million Forecast, by Region 2019 & 2032
- Table 2: Global Fluorinated Fluids Market Revenue Million Forecast, by Application 2019 & 2032
- Table 3: Global Fluorinated Fluids Market Revenue Million Forecast, by End-user Industry 2019 & 2032
- Table 4: Global Fluorinated Fluids Market Revenue Million Forecast, by Region 2019 & 2032
- Table 5: Global Fluorinated Fluids Market Revenue Million Forecast, by Country 2019 & 2032
- Table 6: China Fluorinated Fluids Market Revenue (Million) Forecast, by Application 2019 & 2032
- Table 7: India Fluorinated Fluids Market Revenue (Million) Forecast, by Application 2019 & 2032
- Table 8: Japan Fluorinated Fluids Market Revenue (Million) Forecast, by Application 2019 & 2032
- Table 9: South Korea Fluorinated Fluids Market Revenue (Million) Forecast, by Application 2019 & 2032
- Table 10: Rest of Asia Pacific Fluorinated Fluids Market Revenue (Million) Forecast, by Application 2019 & 2032
- Table 11: Global Fluorinated Fluids Market Revenue Million Forecast, by Country 2019 & 2032
- Table 12: United States Fluorinated Fluids Market Revenue (Million) Forecast, by Application 2019 & 2032
- Table 13: Canada Fluorinated Fluids Market Revenue (Million) Forecast, by Application 2019 & 2032
- Table 14: Mexico Fluorinated Fluids Market Revenue (Million) Forecast, by Application 2019 & 2032
- Table 15: Global Fluorinated Fluids Market Revenue Million Forecast, by Country 2019 & 2032
- Table 16: Germany Fluorinated Fluids Market Revenue (Million) Forecast, by Application 2019 & 2032
- Table 17: United Kingdom Fluorinated Fluids Market Revenue (Million) Forecast, by Application 2019 & 2032
- Table 18: Italy Fluorinated Fluids Market Revenue (Million) Forecast, by Application 2019 & 2032
- Table 19: France Fluorinated Fluids Market Revenue (Million) Forecast, by Application 2019 & 2032
- Table 20: Rest of Europe Fluorinated Fluids Market Revenue (Million) Forecast, by Application 2019 & 2032
- Table 21: Global Fluorinated Fluids Market Revenue Million Forecast, by Country 2019 & 2032
- Table 22: Brazil Fluorinated Fluids Market Revenue (Million) Forecast, by Application 2019 & 2032
- Table 23: Argentina Fluorinated Fluids Market Revenue (Million) Forecast, by Application 2019 & 2032
- Table 24: Rest of South America Fluorinated Fluids Market Revenue (Million) Forecast, by Application 2019 & 2032
- Table 25: Global Fluorinated Fluids Market Revenue Million Forecast, by Country 2019 & 2032
- Table 26: Saudi Arabia Fluorinated Fluids Market Revenue (Million) Forecast, by Application 2019 & 2032
- Table 27: South Africa Fluorinated Fluids Market Revenue (Million) Forecast, by Application 2019 & 2032
- Table 28: Rest of Middle East and Africa Fluorinated Fluids Market Revenue (Million) Forecast, by Application 2019 & 2032
- Table 29: Global Fluorinated Fluids Market Revenue Million Forecast, by Application 2019 & 2032
- Table 30: Global Fluorinated Fluids Market Revenue Million Forecast, by End-user Industry 2019 & 2032
- Table 31: Global Fluorinated Fluids Market Revenue Million Forecast, by Country 2019 & 2032
- Table 32: China Fluorinated Fluids Market Revenue (Million) Forecast, by Application 2019 & 2032
- Table 33: India Fluorinated Fluids Market Revenue (Million) Forecast, by Application 2019 & 2032
- Table 34: Japan Fluorinated Fluids Market Revenue (Million) Forecast, by Application 2019 & 2032
- Table 35: South Korea Fluorinated Fluids Market Revenue (Million) Forecast, by Application 2019 & 2032
- Table 36: Rest of Asia Pacific Fluorinated Fluids Market Revenue (Million) Forecast, by Application 2019 & 2032
- Table 37: Global Fluorinated Fluids Market Revenue Million Forecast, by Application 2019 & 2032
- Table 38: Global Fluorinated Fluids Market Revenue Million Forecast, by End-user Industry 2019 & 2032
- Table 39: Global Fluorinated Fluids Market Revenue Million Forecast, by Country 2019 & 2032
- Table 40: United States Fluorinated Fluids Market Revenue (Million) Forecast, by Application 2019 & 2032
- Table 41: Canada Fluorinated Fluids Market Revenue (Million) Forecast, by Application 2019 & 2032
- Table 42: Mexico Fluorinated Fluids Market Revenue (Million) Forecast, by Application 2019 & 2032
- Table 43: Global Fluorinated Fluids Market Revenue Million Forecast, by Application 2019 & 2032
- Table 44: Global Fluorinated Fluids Market Revenue Million Forecast, by End-user Industry 2019 & 2032
- Table 45: Global Fluorinated Fluids Market Revenue Million Forecast, by Country 2019 & 2032
- Table 46: Germany Fluorinated Fluids Market Revenue (Million) Forecast, by Application 2019 & 2032
- Table 47: United Kingdom Fluorinated Fluids Market Revenue (Million) Forecast, by Application 2019 & 2032
- Table 48: Italy Fluorinated Fluids Market Revenue (Million) Forecast, by Application 2019 & 2032
- Table 49: France Fluorinated Fluids Market Revenue (Million) Forecast, by Application 2019 & 2032
- Table 50: Rest of Europe Fluorinated Fluids Market Revenue (Million) Forecast, by Application 2019 & 2032
- Table 51: Global Fluorinated Fluids Market Revenue Million Forecast, by Application 2019 & 2032
- Table 52: Global Fluorinated Fluids Market Revenue Million Forecast, by End-user Industry 2019 & 2032
- Table 53: Global Fluorinated Fluids Market Revenue Million Forecast, by Country 2019 & 2032
- Table 54: Brazil Fluorinated Fluids Market Revenue (Million) Forecast, by Application 2019 & 2032
- Table 55: Argentina Fluorinated Fluids Market Revenue (Million) Forecast, by Application 2019 & 2032
- Table 56: Rest of South America Fluorinated Fluids Market Revenue (Million) Forecast, by Application 2019 & 2032
- Table 57: Global Fluorinated Fluids Market Revenue Million Forecast, by Application 2019 & 2032
- Table 58: Global Fluorinated Fluids Market Revenue Million Forecast, by End-user Industry 2019 & 2032
- Table 59: Global Fluorinated Fluids Market Revenue Million Forecast, by Country 2019 & 2032
- Table 60: Saudi Arabia Fluorinated Fluids Market Revenue (Million) Forecast, by Application 2019 & 2032
- Table 61: South Africa Fluorinated Fluids Market Revenue (Million) Forecast, by Application 2019 & 2032
- Table 62: Rest of Middle East and Africa Fluorinated Fluids Market Revenue (Million) Forecast, by Application 2019 & 2032
Frequently Asked Questions
1. What is the projected Compound Annual Growth Rate (CAGR) of the Fluorinated Fluids Market?
The projected CAGR is approximately > 6.00%.
2. Which companies are prominent players in the Fluorinated Fluids Market?
Key companies in the market include Halocarbon LLC, Solvay*List Not Exhaustive, Nye Lubricants Inc, 3M, F2 Chemicals Ltd, Engineered Fluids, AGC Chemicals Americas, IKV Tribology Ltd, Halocarbon, Perstorp, Lubrilog.
3. What are the main segments of the Fluorinated Fluids Market?
The market segments include Application, End-user Industry.
4. Can you provide details about the market size?
The market size is estimated to be USD 1.12 Million as of 2022.
5. What are some drivers contributing to market growth?
Growing Demand for High Performance Heat Transfer Fluids; Superior and Eco-friendly Properties of Engineered Fluids; Other Drivers.
6. What are the notable trends driving market growth?
Growing Demand for Lubricants from Automotive Sector.
7. Are there any restraints impacting market growth?
Higher Manufacturing and Maintenance Costs; Other Restraints.
8. Can you provide examples of recent developments in the market?
April 2023: Solvay launched the new Tecnoflon SHP, a new product line of fully fluorinated synthetic rubbers (FFKM) industrial.
9. What pricing options are available for accessing the report?
Pricing options include single-user, multi-user, and enterprise licenses priced at USD 4750, USD 5250, and USD 8750 respectively.
10. Is the market size provided in terms of value or volume?
The market size is provided in terms of value, measured in Million.
11. Are there any specific market keywords associated with the report?
Yes, the market keyword associated with the report is "Fluorinated Fluids Market," which aids in identifying and referencing the specific market segment covered.
12. How do I determine which pricing option suits my needs best?
The pricing options vary based on user requirements and access needs. Individual users may opt for single-user licenses, while businesses requiring broader access may choose multi-user or enterprise licenses for cost-effective access to the report.
13. Are there any additional resources or data provided in the Fluorinated Fluids Market report?
While the report offers comprehensive insights, it's advisable to review the specific contents or supplementary materials provided to ascertain if additional resources or data are available.
14. How can I stay updated on further developments or reports in the Fluorinated Fluids Market?
To stay informed about further developments, trends, and reports in the Fluorinated Fluids Market, consider subscribing to industry newsletters, following relevant companies and organizations, or regularly checking reputable industry news sources and publications.
Methodology
Step 1 - Identification of Relevant Samples Size from Population Database


Step 2 - Approaches for Defining Global Market Size (Value, Volume* & Price*)

Note*: In applicable scenarios
Step 3 - Data Sources
Primary Research
- Web Analytics
- Survey Reports
- Research Institute
- Latest Research Reports
- Opinion Leaders
Secondary Research
- Annual Reports
- White Paper
- Latest Press Release
- Industry Association
- Paid Database
- Investor Presentations

Step 4 - Data Triangulation
Involves using different sources of information in order to increase the validity of a study
These sources are likely to be stakeholders in a program - participants, other researchers, program staff, other community members, and so on.
Then we put all data in single framework & apply various statistical tools to find out the dynamic on the market.
During the analysis stage, feedback from the stakeholder groups would be compared to determine areas of agreement as well as areas of divergence


